ADX determines the existence or nonexistence of a trend and if the movement is gaining or losing momentum. Despite being an excellent trend tool, some traders, particularly newbies, cannot understand the indicator. One reason is that the ADX line may rise even as the market is going down. For experienced traders, this matter is no longer an issue.
While the tool is popular among traders, many are perplexed about using the ADX successfully in trading. Perhaps you experienced jumping on trade to find out you entered at the end of the move and suffered a loss. You might have had the same confusion yourself.
Maybe the usual way of trading the ADX is not working. Perhaps you need a different approach. That is what you are going to learn in this article. There is no need to move heaven and earth here. A minor tweak is what it takes to turn your ADX trading around.
ADX components
The ADX is an oscillator usually plotted in a sub-window and ranges in value from 0 to 100. The indicator has three lines that can give you trading signals:
- ADX line
- +DI line
- -DI line

If you get the difference between +DI and -DI and smooth the result, you will get the ADX value. There is no need to go further beyond that. Knowing how to get the values of +DI and -DI is not necessary for our purpose. What you should spend time on is how to interpret the ADX signals.
How to interpret the ADX
The ADX performs two main functions:
- Identify the market condition
- Determine the trend strength
Market condition
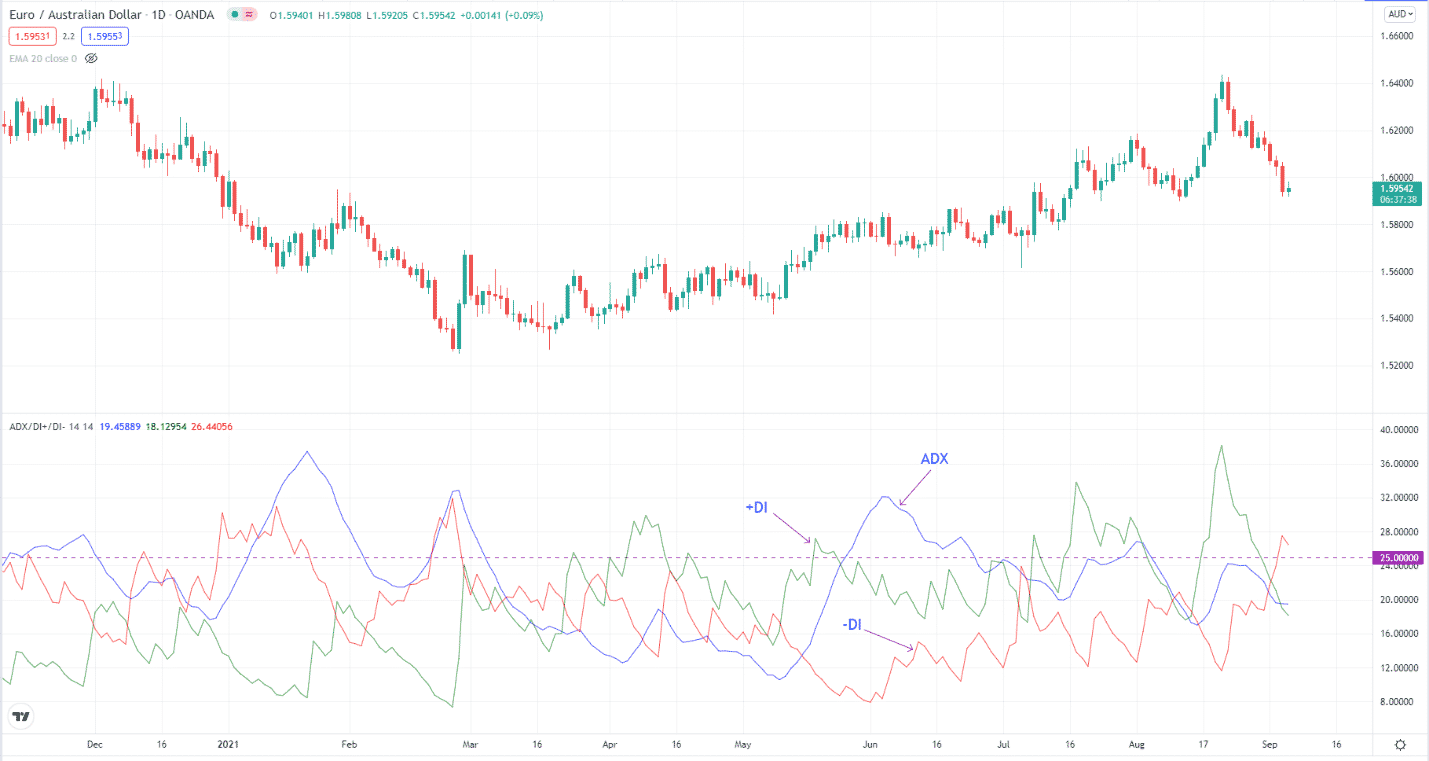
Since the ADX line can go up even if the market is going down, you must look at the +DI and -DI interaction to determine the trend.
- If +DI is above -DI, the underlying asset is trending upward.
- If -DI is above +DI, the underlying instrument is trending downward.
To quickly identify the trend using the +DI and -DI lines, use different colors for each line. However, knowing the trend in this manner is not enough to become profitable at trading the ADX. You can get many false signals if you deal with every crossover between +DI and -DI. If you trade this way, you may catch explosive moves, but frequent losses could quickly eat up your profits.
Trend strength
Since it is not enough to trade profitably with the +DI and -DI lines, the ADX line is added to the mix. Now you can be picky with your trade entries. You can use the value of the ADX as a filter when considering a crossover of +DI and -DI.
Usually, traders consider the 25 level as the baseline for when a trend exists or not. An ADX value of less than 25 suggests a ranging market, while an ADX value of 25 suggests a trending market. While this ballpark figure is suitable in most instruments, it might not work in all types of markets. Therefore, you have to study the markets to develop the best ADX threshold value for each one.
Not the best way to trade ADX

Many traders trade the ADX casually and wonder why it does not seem to work. Although trading should not be complicated, that kind of approach to dealing with the ADX will not work. When you browse online, many authors tell you to follow these steps, namely:
- Check if the ADX line is above a certain threshold level, such as 25.
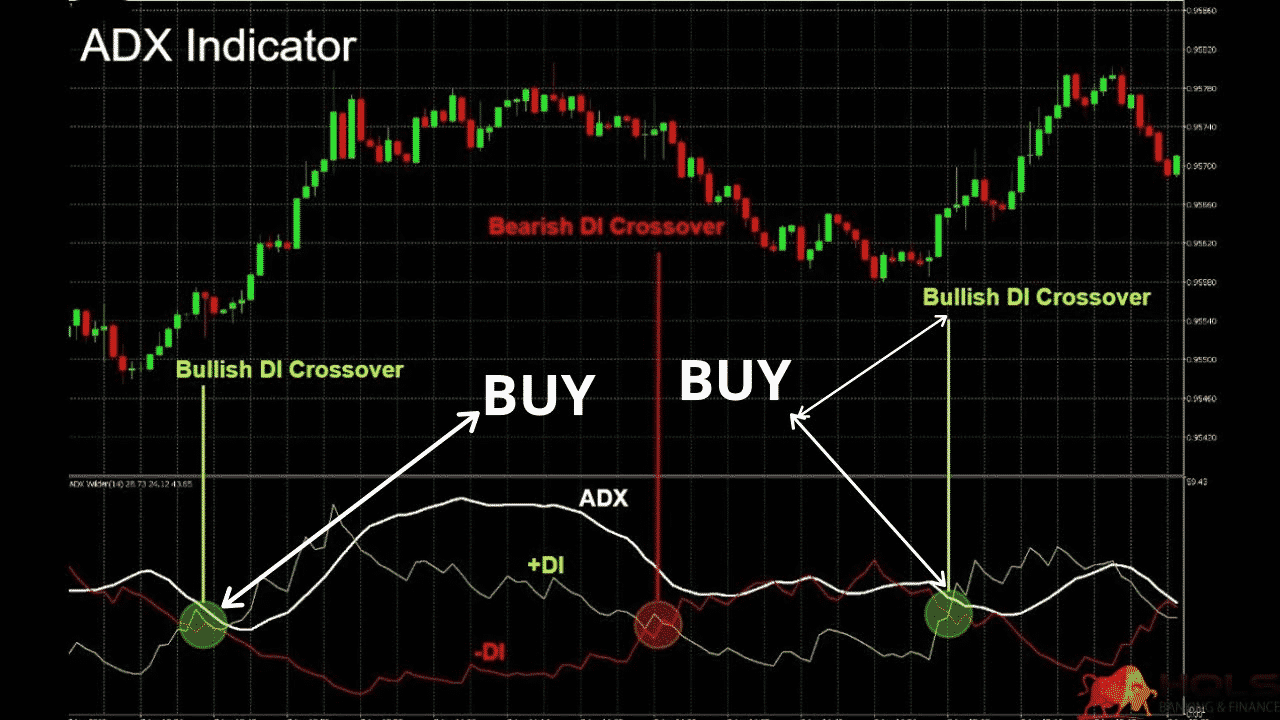
- Determine if the +DI and -DI crossovers are bullish or bearish and trade accordingly.
- If +DI is above -DI, the crossover is bullish; otherwise, the crossover is bearish.
When you trade in this manner, you could catch great trades, but you will often take losing trades because you have entered at the top or bottom of a move when the market has turned around.
At other times, traders blindly take trades as long as the ADX reading is above a minimum level without realizing that the ADX line is already going down. Be aware that a falling ADX line is an indication of fading momentum. You might be trading in a direction whose momentum is already decelerating.

The right way of trading the ADX
Now let us discuss a better way of trading the ADX indicator. To do this, you must follow three steps.
- Wait for ADX to go above a threshold
The first step is awaiting approach. You want to see the ADX building momentum and the market consolidating first. Let us use 25 as the threshold level in this example. As soon as the ADX breaks and closes above this level, the first step is satisfied. The reason why you want the ADX to break above a threshold is to ensure that it is sloping upward when you open a trade.
- Determine the trade direction
Check if you have a bullish or bearish +DI and -DI crossover. If plus DI is above minus DI, the crossover is bullish, and you would consider a buy entry. If plus DI is below minus DI, the crossover is bearish, and you are looking for a sell entry.
- Check the slope of +DI/-DI
This last step is what differentiates this trading strategy from many ADX strategies presented by other authors online. This consideration will ensure that you do not open a buy trade at the top of a bullish trend or a sell trade at the bottom of a bearish trend.
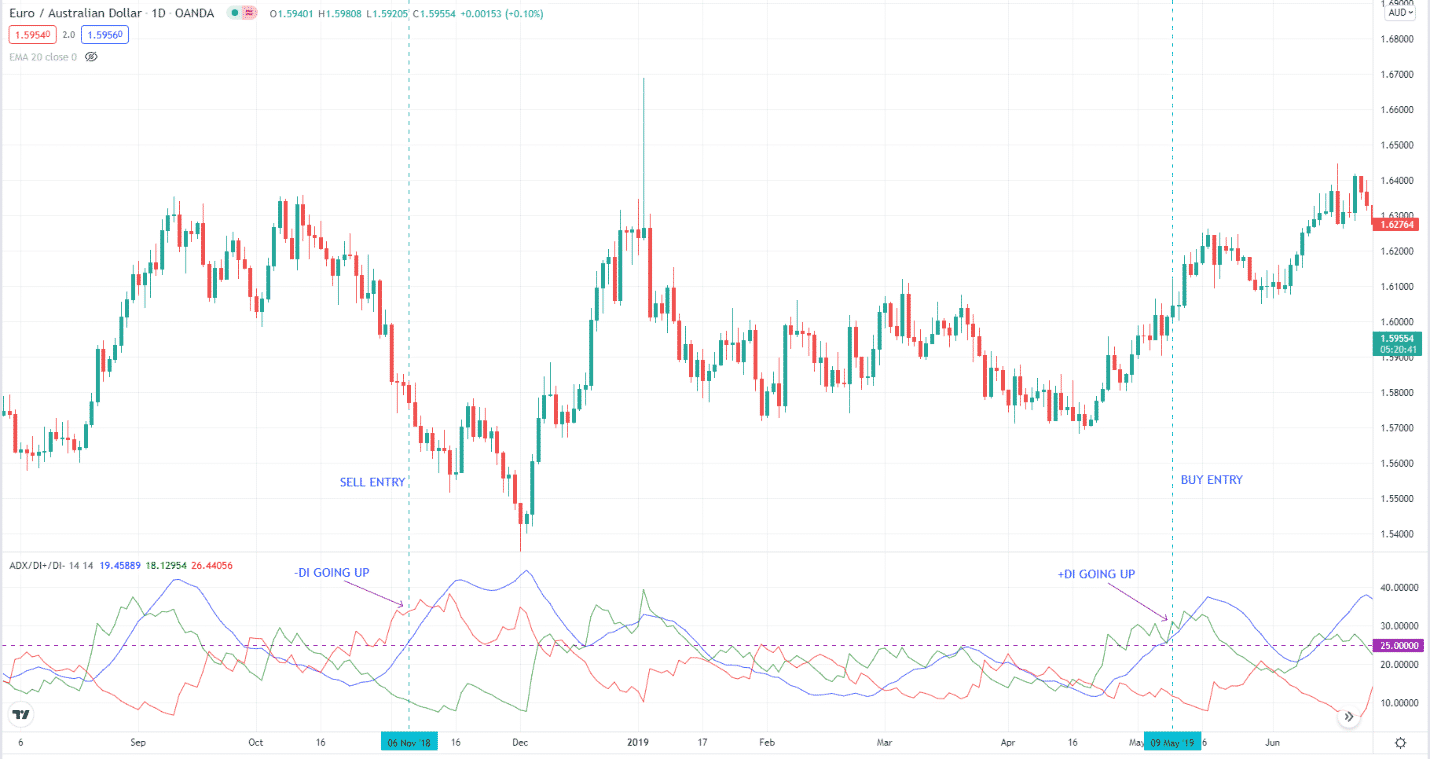
You would like to see a +DI line sloping upward in at least two candles for a buy trade, including the trigger candle. You would like to see the -DI line sloping upward in at least two candles for a sell trade, including the trigger candle. Of course, you will open a trade at the close of the trigger candle and the open of the next candle.
See an example of a buy entry and a sell entry in the above chart. Notice that -DI is sloping upward when ADX closes above 25 for the sell trade, and +DI goes up when ADX closes above 25 for the buy trade. That is a little-known trick for using ADX.
Final thoughts
Now you have learned a little secret to trading ADX successfully. If you can combine this method with other tools, you will get better results. Although you will trade less often when you muster different tools, you will reap the reward of trading patiently over the long term. Now it is time to put what you have learned here to use.


