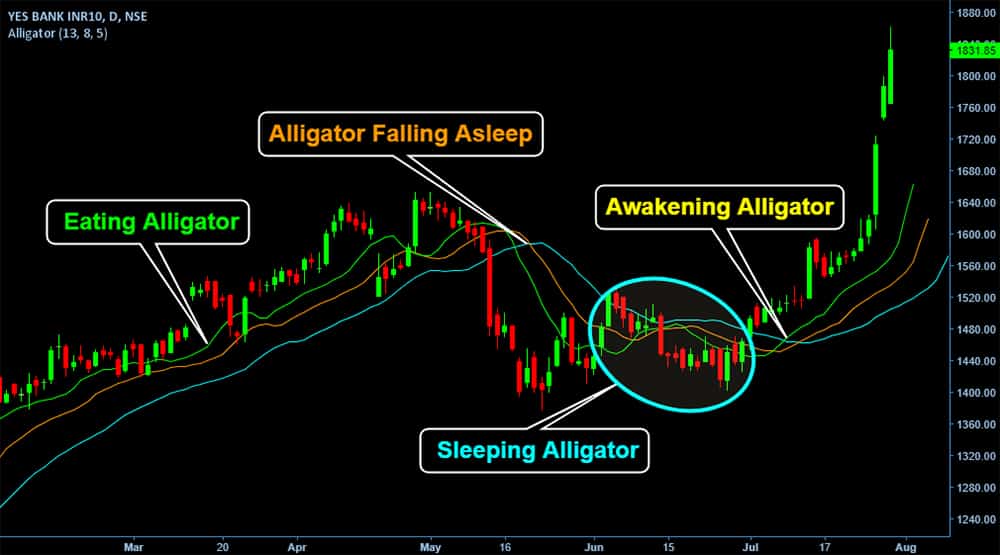
Forex traders often use technical indicators to identify the most potential trading positions. Using indicators enables market participants to get more accuracy on analysis and also increases the profitability of trading.
Williams Alligator is a unique indicator that works with market data, identifies trends, and suggests accurate trading positions.
However, using custom indicators for trading involves basic understanding and knowledge about that indicator and market information.
Let’s learn all the needed information about this indicator — how it works, the formula, and complete strategies with examples.
What is the Williams alligator indicator?
An American author Bill Williams is the developer of this indicator, who first wrote about it in 1995. The market only chases trends 15-30% of the time, as the author believes. This indicator is popular by many names, such as Alligator indicator, Williams indicator, etc.
Traders use this technical indicator to identify several financial asset trends that suggest profitable trading positions, including possible entries, exits, and holding periods. This indicator is a combination of three moving averages (MAs) of different periods.
How does the Williams alligator indicator work?
The working procedure is so simple for the Williams Alligator indicator. Three smooth MA shows trends of the price movement, and each MA has a different name as part of the Alligator.
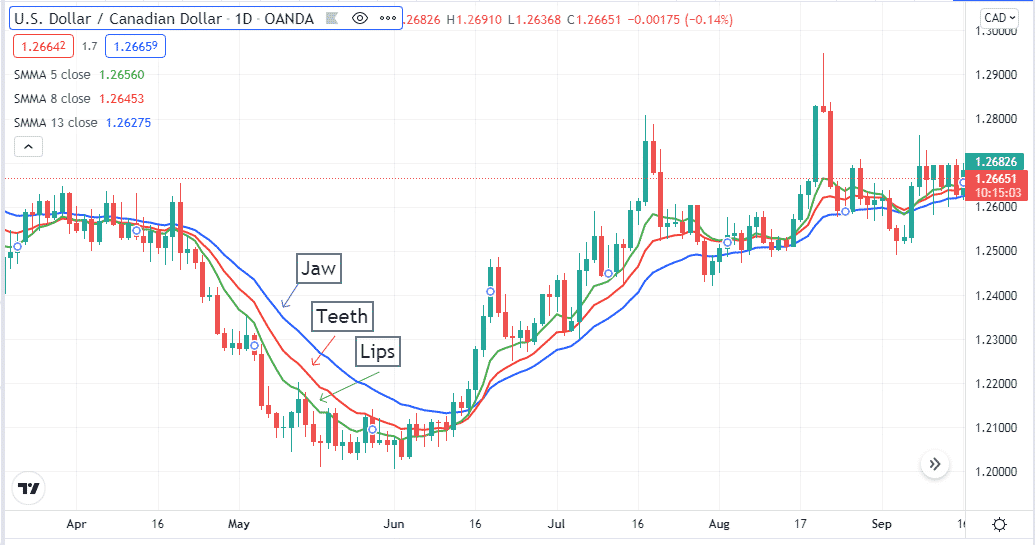
The figure above shows a daily chart of USD/CAD, in which we apply an alligator indicator. The primary explanation of this indicator you can get from this figure.
Lips
The smooth MA value of five is the lips, the smallest of those three MAs. It is the green MA line.
Teeth
The smooth-moving average value of eight is the teeth. It is the middle line, and the color is red.
Jaw
The smooth-moving average value of thirteen is the jaw. It is the large MA line among those three, which is blue.
Now, when the MA signal lines get closer, it indicates that the Alligator is sleeping. It means the asset has less volatility, and it is a sideway price movement. The more it sleeps, the more hungry, and a more significant breakout happens with the opportunity to buy or sell the asset.
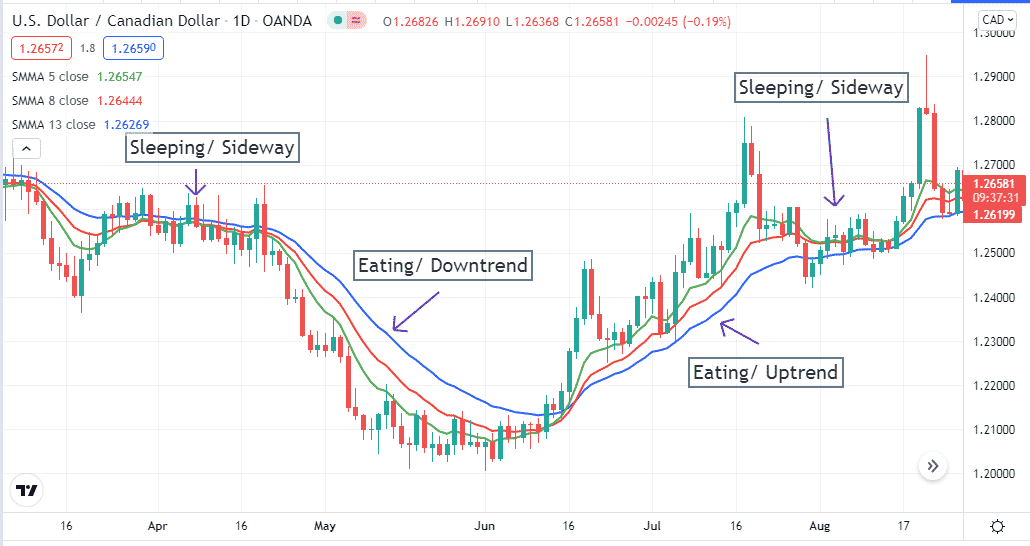
More comprehensive MA lines mean more massive movement. When the price movement remains downtrend, lips remain at the downside and the jaw at the upside.

For an uptrend, the jawline remains at the downside and lips at the upside. When the green and the red MA line crosses above the blue line, it signals a bullish pressure on price movement and vice versa for bearish pressure.
What is the Williams alligator formula?
Williams alligator indicators use 13, 8, and 5 smooth MA values to generate trading ideas. These are also numbers of the Fibonacci Series. You calculate smooth MA values initially by SMAs.
The formula of alligator indicator
Simple moving average (SMA):
- SUM1 = SUM (CLOSE, N)
- SMMA1 = SUM1/N
Subsequent values are:
- PREVSUM = SMMA(i-1) *N
- SMMA(i) = (PREVSUM-SMMA(i-1)+CLOSE(i))/N
Where:
- SUM1 — the sum of closing prices for N periods
- PREVSUM — smoothed sum of the previous bar
- SMMA1 — smoothed MA of the first bar
- SMMA(i) — smoothed MA of the current bar (except for the first one)
- CLOSE(i) — current closing price
- N — the smoothing period
How to trade with the Williams alligator indicator?
This part includes complete setups for both bullish and bearish market conditions. This indicator works fine in any time frame you use. We recommend using charts minimum of hourly or above charts to avoid false swing highs and lows in smaller time frames charts. It is an easily adaptable strategy for any FX trader, which generates constantly profitable trading ideas.
Bullish trade setup
Check the green signal line cross above both the red and the blue signal lines. Then check the red line must cross above the blue signal line. If these conditions are true, then the market is entering a bullish phase. Wait till the recent bullish candle closes and place a buy order.
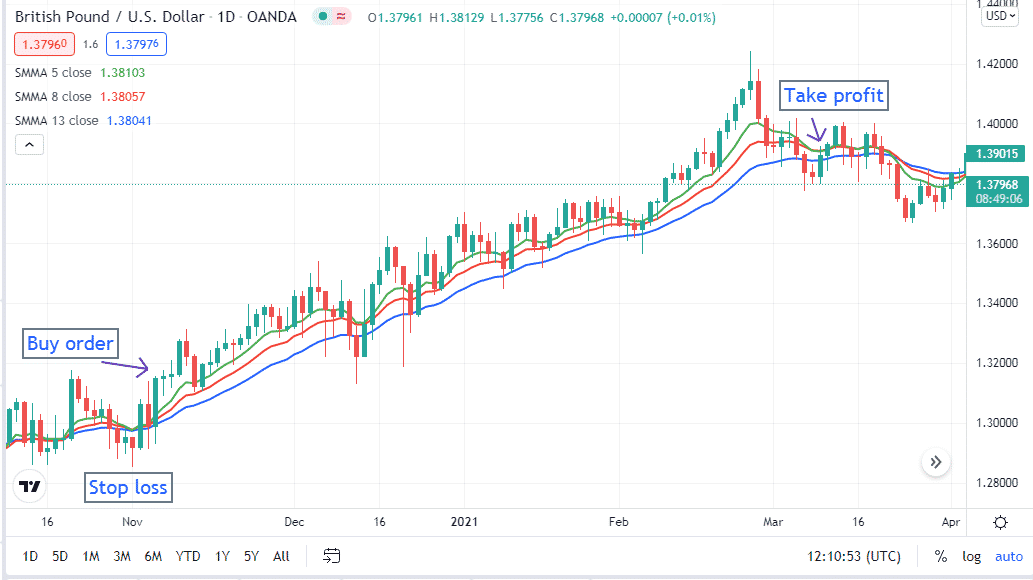
Stop loss will be at your tolerance level below the recent swing low. Continue the buy order till the trend remains intact. Close the position when the green signal line crosses below the red signal line. That signals an ending of the recent trend.
Bearish trade setup
Bearish is just the opposite of the bullish order on the MA signal lines. The green signal line crosses below the other two signal lines. Check the red signal line also crosses below the blue signal line. When green and red signal lines cross below the blue signal line, it indicates starting a possible bearish trend. Wait until the closing of the recent bearish candle, then enter a sell order.
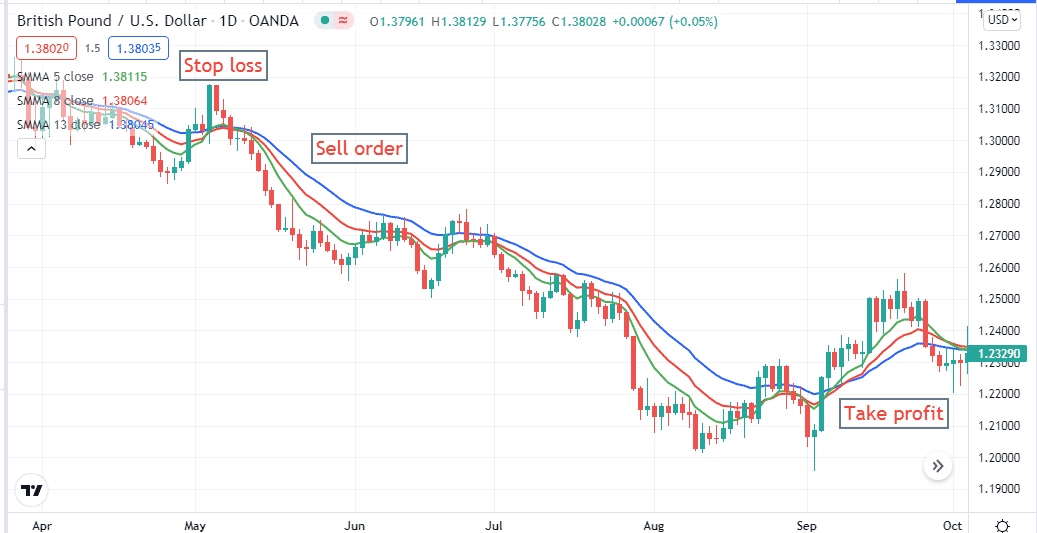
Initial stop loss will be above the recent swing high at your tolerance level. Continue the sell order till the trend remains intact. Close the sell position when the green signal line or lips cross above the teeth or red signal line. That indicates a possible ending of the downtrend price movement.
How to manage risks?
Risk management is an essential factor in FX trading. Check all conditions carefully before entering any order at the asset price. When the price movement is on a sideway or the signal lines remain closer, avoid taking entries. After making entry positions, you can shift your stop losses as a part of trade management to reduce risks at your trade.
For example, look at the figure above.
- The sell position is at X, and the stop loss is near point A.
- When the price falls near point B, it creates a new lower low.
- Wait till price movement makes point C and trend remains intact; shift your stop loss at X or 2-5 pips below the breakeven point X as a part of trade management.
- Never risk too much of the trading capital that you can’t afford.
- Strict to the plan and follow the trade and money management rules properly.
Final thoughts
You may not always pick the trading position at the beginning of the trend. In that case, try to make positions as close to starting the trend as you can. It is a very efficient strategy but never ignore your risk management to trading with this system.
