The pound and dollar pair (GBP/USD) is among the most popular financial instruments in the FX.
- The pound pertains to the Great British Pound, the official currency of the United Kingdom.
- The dollar pertains to the US dollar, the official currency of the United States.
The pound is the base currency for the GBP/USD symbol, and the dollar is the quote or counters currency. The value of the GBP/USD asset represents the relative strength between the two currencies. For example, if the price of GBPUSD is 1.40, it means that buyers must pay 1.40 dollars to get the one pound.
What the pound & dollar trader should know
GBP/USD is the third most popular trading instrument in the FX. As such, it is among the most liquid assets heavily traded by forex traders. Trading with a highly liquid asset has many advantages to traders, including high volatility, tight spreads, and instant fill and liquidation.
Since Great Britain and the United States have stable economies, traders and investors consider GBP/USD a safe trading and investment vehicle. You can find lots of valuable resources and information anywhere online to guide you in making trading decisions. Many people are talking about and watching the asset as it reaches critical levels, trying to understand where it might go next.
Major economic indicators
You can use economic data in your trading if you know how to interpret the results and impact the GBP/USD rate. Traders call this type of trading approach fundamental analysis. Fundamental traders analyze how news events affected market prices in the past to get an idea of how incoming news releases will likely move the markets.
It is easy to find reports online about economic factors that influence the exchange rate of GBP/USD since the United States and Great Britain publish such reports regularly.
| Numerous factors affect the value of the cable: | The following economic factors affect the value of the USD: | The following economic factors affect the value of the GBP: |
|
|
|
Top 3 practical strategies for the pound/dollar trader
You can trade the GBP/USD pair in various ways. However, for new traders, you must use simple strategies at first. In the succeeding sections, you will find three simple strategies to trade the GBP/USD market. Learn these strategies and apply your knowledge in the market by trading with a demo account.
Strategy №1: Buy/sell the pullback
GBP/USD is among the currency pairs that show strong trending tendencies in recent history. This is partly because of the number of market participants trading and investing in this financial asset partly because of its strong tendency to be affected by market fundamentals.
When it trends, the currency pair shows relatively similar energy when moving down as it is when moving up. So this creates many golden opportunities for traders looking to enter the market when the trend presents itself, either bullish or bearish.
The best way to trade during trending times is:
- To buy the pullback when GBP/USD is in an uptrend.
- To sell the pullback when the pair is in a downtrend.
This strategy attempts to time the entry when the market shows signs that the correction is over and the initial trend is about to resume.

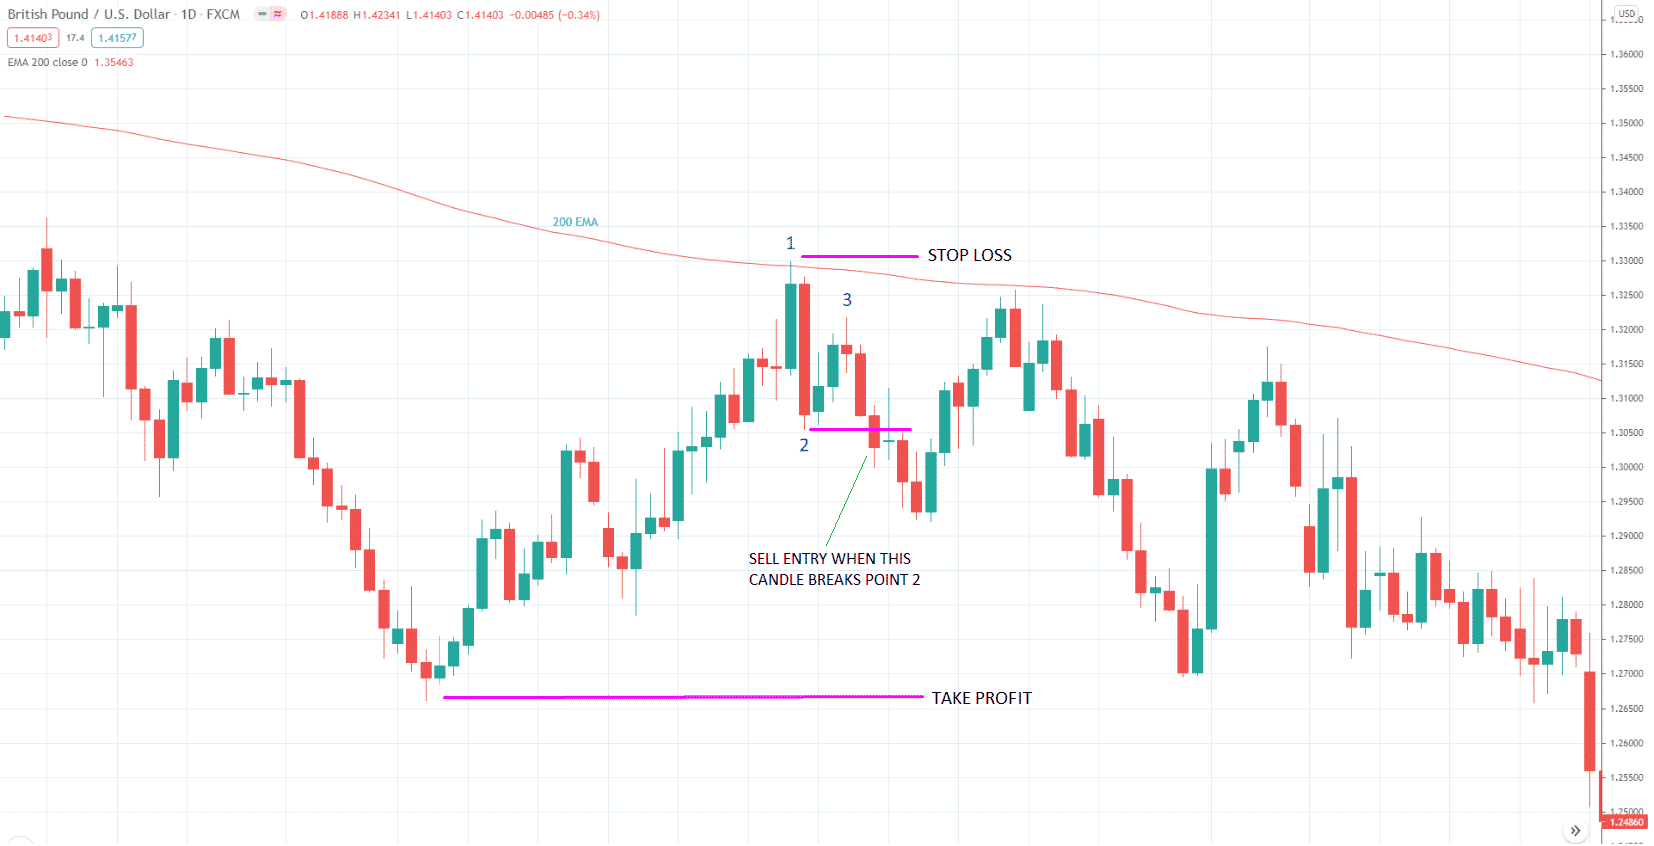
You can enter the market using this strategy in many ways. The chart above shows an example.
- The slope of the 200 EMA defines the trend direction.
- Since the 200 EMA has a downward slope, the trend is bearish, and you would like to enter a sell trade.
- The entry presents itself after the market makes a pullback and begins to falter.
- The current entry occurs after the break of the 1-2-3 pattern.
- The chart also shows where the stop loss and the take profit should generally go.
Strategy №2: Buy/sell the breakdown
Another way to trade the GBP/USD pair is to enter the breakout when the market consolidates in a tight price range with clearly defined support and resistance zones. This market situation is known as ranging or consolidation. Many traders stay on alert when they see this condition and closely monitor the market as it unfolds. They know that at some point, the market will break out of consolidation and start trending again.
Trading this type of market is not difficult at all, even for beginner traders. You can save the guesswork by waiting at which level the market will break, that is, support or resistance, and then trade in the breakout direction.
- If GBP/USD breaks support, then you sell the breakout.
- If it breaks resistance, then you buy the breakout.

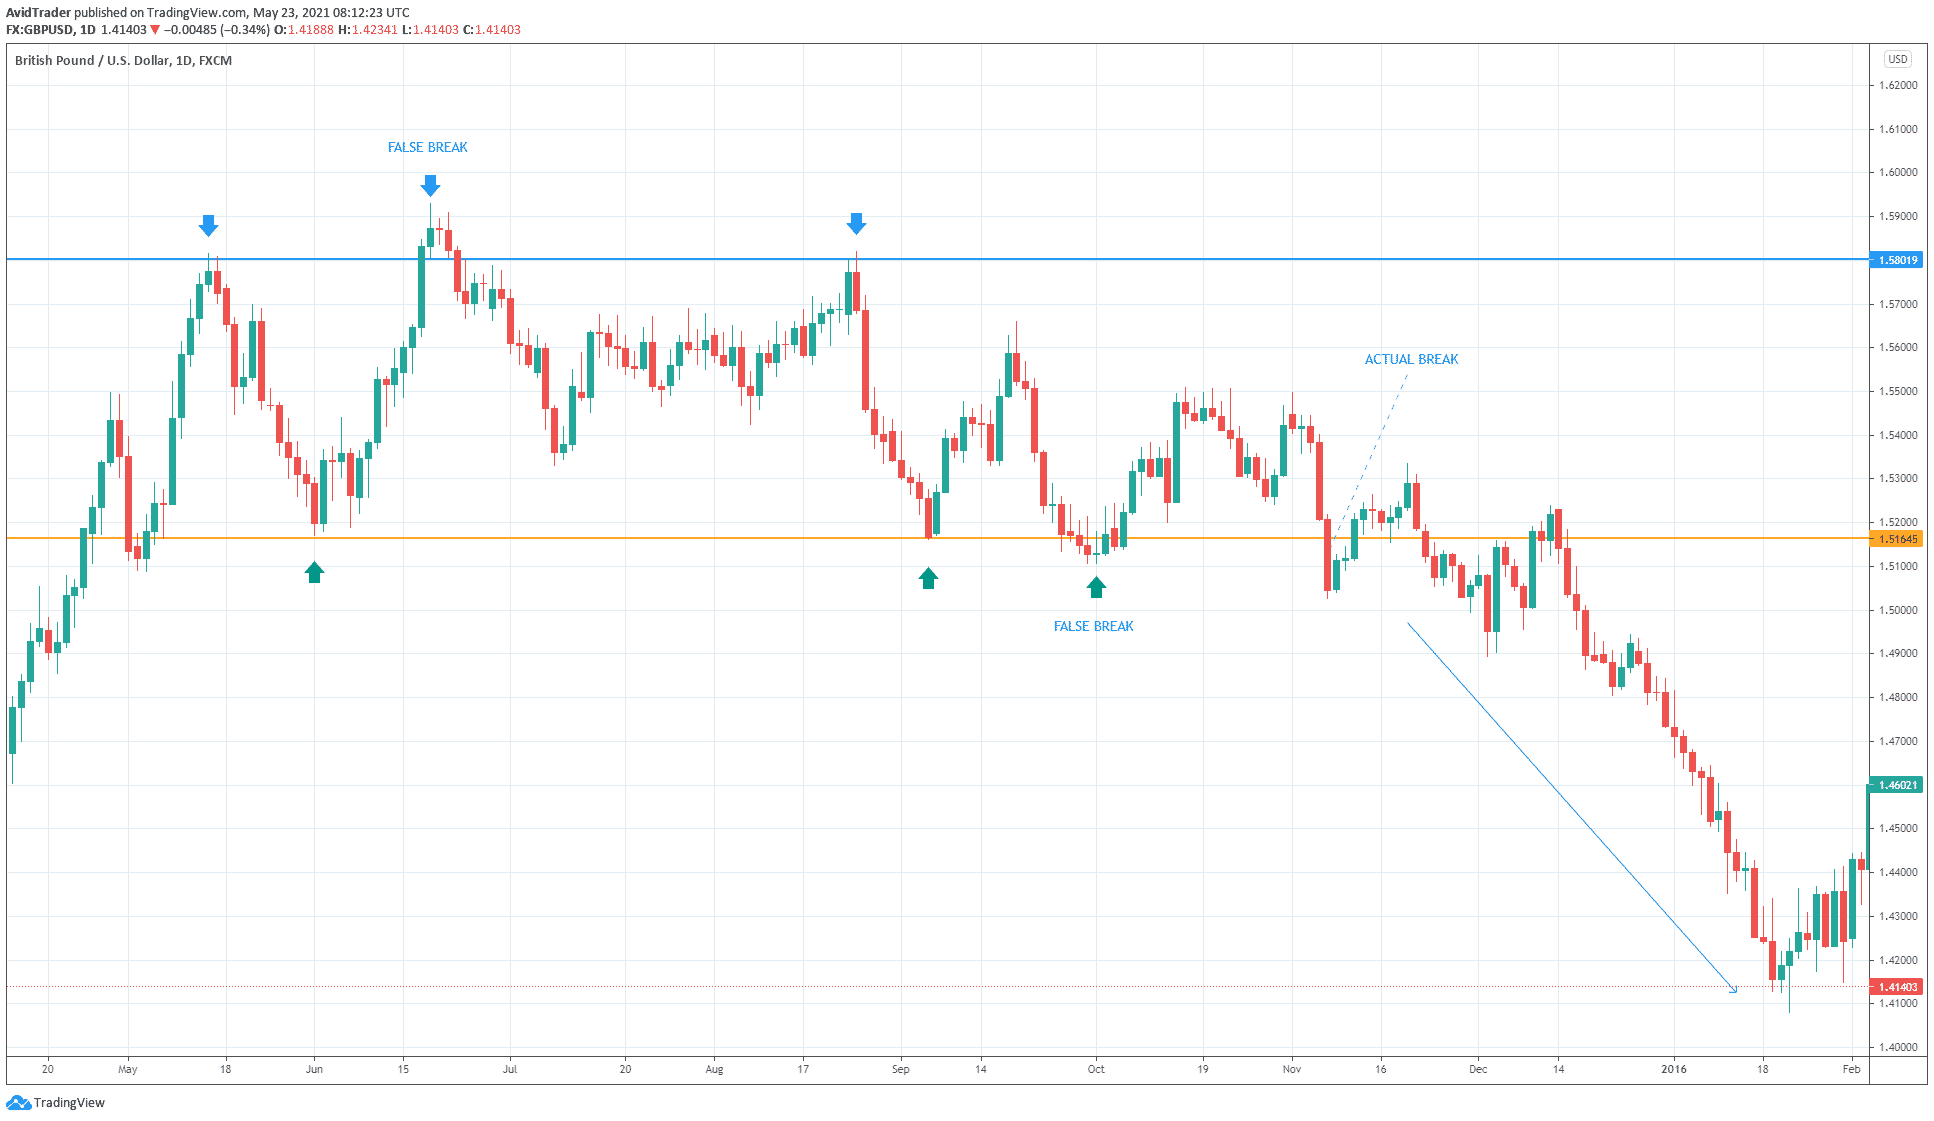
A chart example will illustrate the trading process. The above chart shows that GBP/USD ranged for around six months, starting 14 May 2015 until 6 November 2015.
You would need at least two touchpoints both for the upper and lower boundary to say that a market is ranging. In this case, we see six touches in total, including the false breakpoints. The eventual breakdown occurred on 6 November 2015 when a big red candle pierced through support and closed below it. What happened next is that the price retraced a little and then made a massive sell-off.
Strategy №3: Narrow range patterns
Price action is the name of a host of trading strategies that do not use any technical indicators in the process of identifying trade entries.
The most popular price action method is probably the classical chart patterns:
- Wedge
- Triangles
- Pennants
- Flags
- Head and shoulders
- Double tops and double bottoms
However, there is a price action pattern that exists but is not popular among traders. It is called a narrow range pattern. Unlike other ones that form specific shapes, the narrow range pattern relies on candlesticks. This makes it difficult to find it on the chart as it can lie hidden in a group of candlesticks.
- The narrow range pattern requires seven candles to form, so look at the range of candles to find it.
- Candle range refers to the distance between the high and low of the candle.
- Consider the range of any random candle and count seven candles backward. If this candle has the smallest range compared to the six other candles, you have found a narrow range pattern.

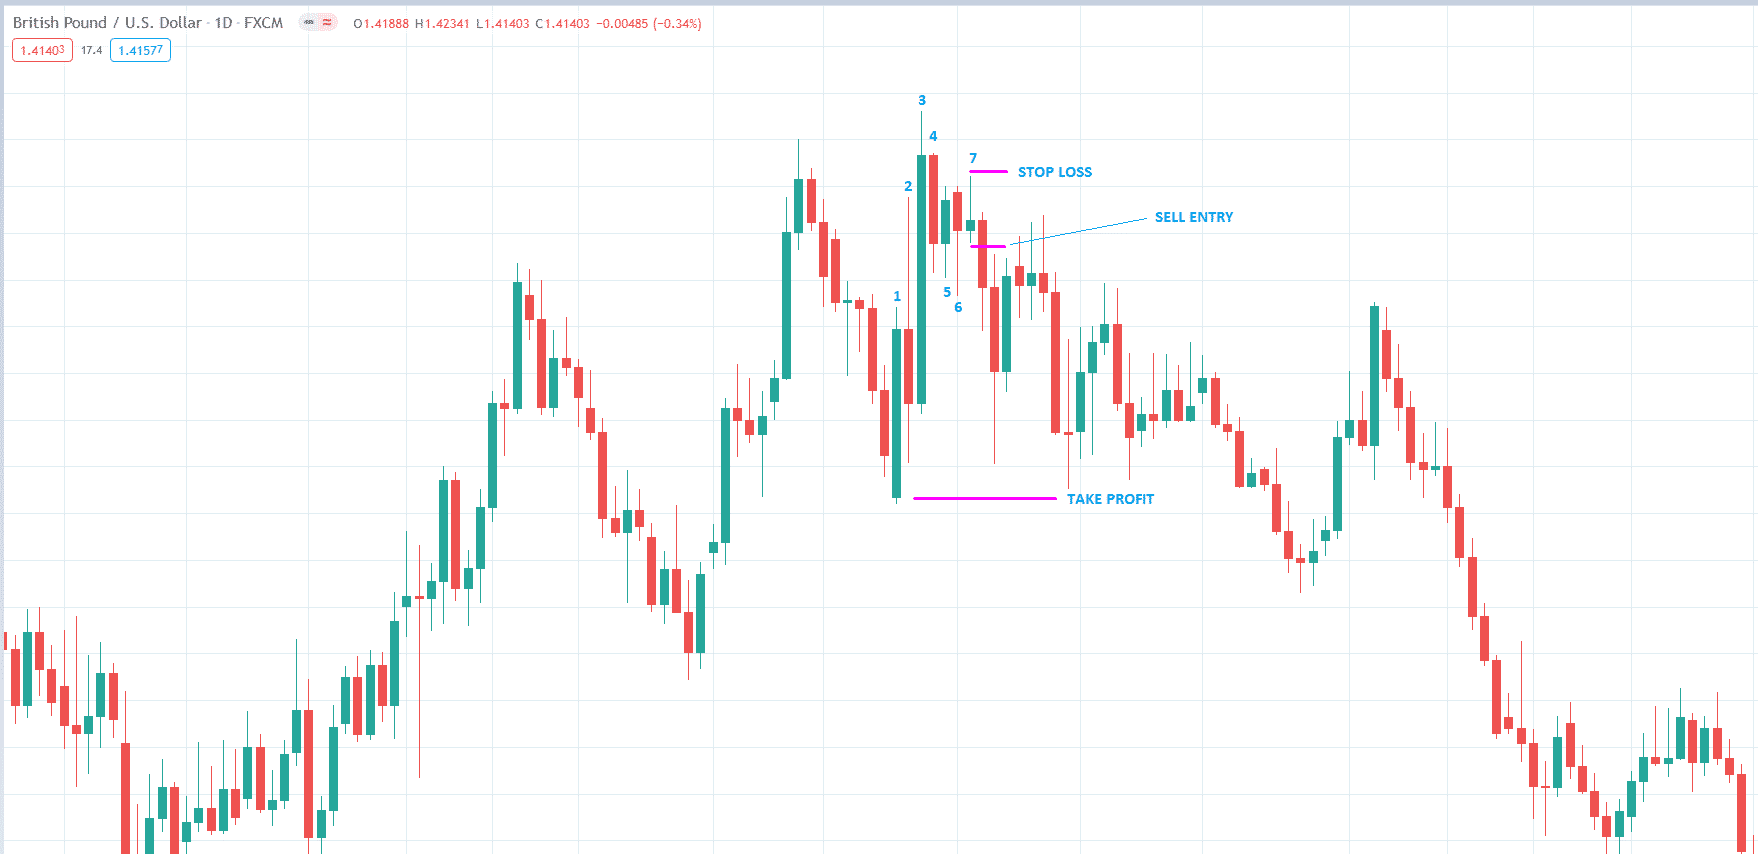
The above chart illustrates how to trade this pattern:
- First, you must make a judgment call whether the current trend is predominantly bullish and bearish.
- In this example, we can decide that the price is in a resistance area, so we would like to enter a sell trade.
- Since a narrow range pattern forms in the vicinity of resistance, you can open a sell trade at the break of the low of candle seven.
- When this happens, you can put the stop loss at the high of candle seven or a little higher and then set the take profit at the nearest swing low.
Final thoughts
Trading the GBP/USD pair is challenging due to its volatile nature when compared to other symbols. However, if you spend time analyzing how this pair behaves using either technical or fundamental analysis, you might find something to help you navigate this market.
You can use any of the three simple strategies above as a starting point. Start trading with a demo account and do it as you would trading with real money. Try to make any of these strategies work for you and improve a little over time.


