Technical analysts and other financial market entities develop many trading tools and indicators to make the trading life effortless. The Chande Kroll Stop is a unique tool becoming popular day by day.
However, it is mandatory to learn the components of any technical indicator besides understanding the calculation process to obtain the best results. This article will briefly discuss the Chande Kroll Stop indicator and its trading techniques.
What is a Chande Kroll Stop indicator strategy?
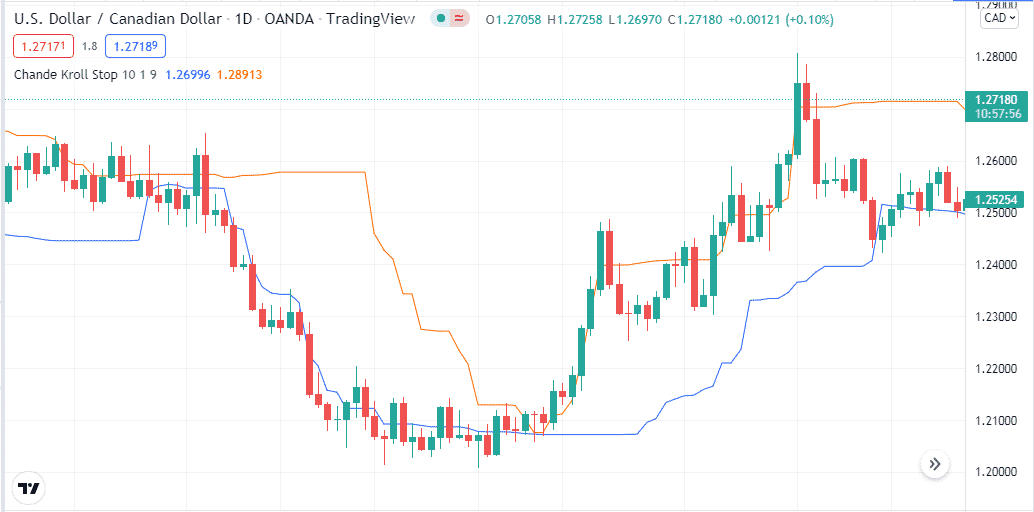
It is a unique indicator that finds the price direction using the volatility of various trading assets. The inventors of this indicator are Tushar Chande and Stanley Kroll, two technical analysts. The book “The New Technical Trader” describes this indicator as a trend director with two lines above and below, showing stop loss levels for buy or sell positions. This trading tool uses ATR period, stop period, and multiplier to preside price direction.

ATR period
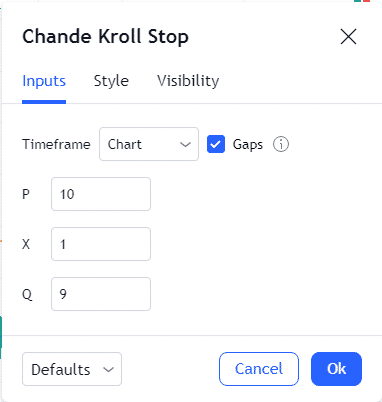
The ATR period (P) measures the initial stop loss level by considering the price volatility. The default setting for this parameter is 10.
Stop period
The stop period (X) identifies the last stop-loss time. The standard setting is 20 for this parameter.
Multiplier
The multiplier (Q) determines the stop loss distance from the price. For instance, when the value is 2, the stop loss will be at a distance of two times the average volatility value.
Meanwhile, the calculation formulas are:
Stop on purchase = Highest of Stop preliminary to purchase on Y periods,
where initial purchase stop = Highest of X periods – (Coefficient * Average True Range of X periods)
Stop sale = Lowest of Stop primary sale over Y periods
Where stop preliminary sale = Low of X periods + (Coefficient * Average True Range of X periods)
Any trading strategy that uses this technical indicator to generate trade ideas is a Chande Kroll Stop trading strategy.
How to trade with Chande Kroll Stop strategy?
The Chande is a straightforward indicator applicable to any trading asset. If you use smaller time frames to determine trading positions through this indicator, it is better to choose volatile assets to get frequent trading positions. The price reaches above both lines, declares bullish pressure on the asset price, and suggests opening a buy position.
Meanwhile, the prices below this indicator claim bearish pressure and signal to open a sell position. Executing a buy trade suggests an initial stop loss level at the upper line, and the stop loss level will be near Chande Kroll low when opening sell positions. Both stop-loss levels change according to market context.

You can use it as a standalone indicator or combine other technical tools and indicators to determine more accurate trading positions. For example, you can use the ADX indicator. When the price reaches above the upper line and the ADX value increase above 20, it declares sufficient bullish pressure on the asset price and an excellent level to open a buy position.
We use the RSI indicator alongside the Chande Kroll stop indicator to determine precious entry/exit positions.
Bullish trade setup
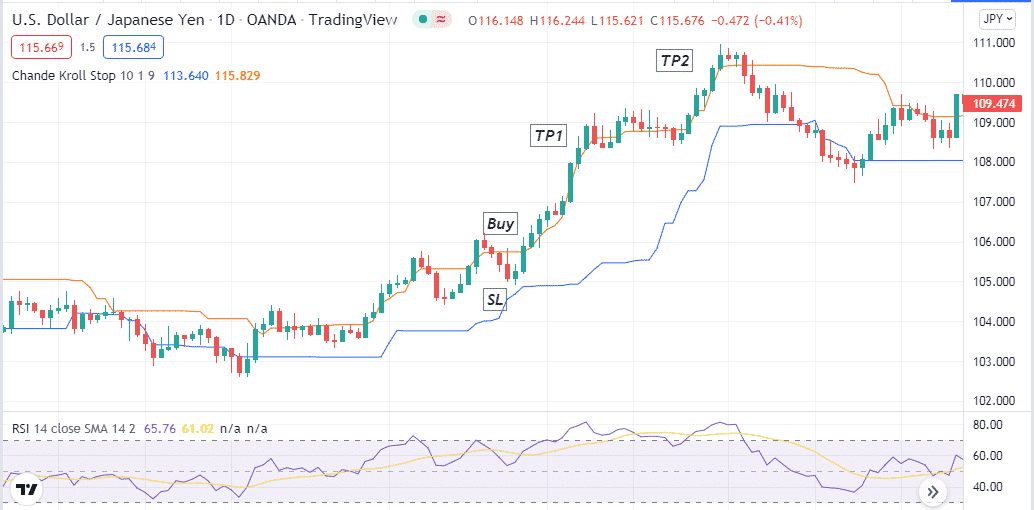
This method suggests opening buy position when:
- The price reaches above the upper or both lines of the Chande Kroll Stop indicator.
- The dynamic RSI line is near the central (50) line heading on the upside.

Entry
When these conditions above match your target asset chart, it declares sufficient bullish pressure on the asset price. Open a buy position after the current bullish candle closing.
Stop loss
The initial stop loss level will be near the upper line of the Chande Kroll Stop indicator; you can place it below the current swing low if you like to put a conservative stop loss.
Take profit
Close the buy position when the price reaches below the upper line. You can also use the reading of the RSI indicator to define when the bullish momentum ends. In that case, close the buy position when the RSI line reaches the overbought level or start declining back from that level toward the central (50) line.
Bearish trade setup
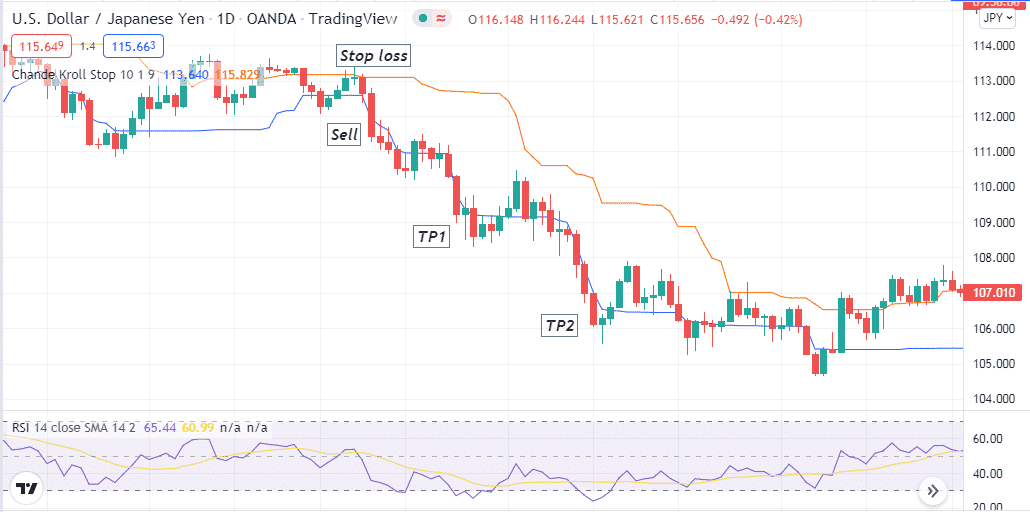
This method suggests opening sell position when:
- The price reaches below the lower or both lines of the Chande Kroll Stop indicator.
- The dynamic RSI line is near the central (50) line heading on the downside.

Entry
When these conditions above match your target asset chart, it declares sufficient bearish pressure on the asset price. Open a sell position after the current bearish candle closing.
Stop loss
The initial stop loss level will be near the lower line of the Chande Kroll Stop indicator; you can place it above the current swing high if you like to put a conservative stop loss.
Take profit
Close the sell position when the price reaches above the lower line of the Chande Kroll Stop indicator. You can also use the reading of the RSI indicator to define when the bearish momentum ends. In that case, close the sell position when the RSI line reaches the oversold level or start rising back from that level toward the central (50) line.
How to manage risks?
Risk management is a vital part of financial trading. Several factors affect the price movement of currency pairs, so be aware of that factors before entering trades. Some professional tips to reduce risks are:
- Use fair trade and money management in your executing positions. Never risk too much that you can not afford.
- Check on fundamental data from reliable sources or follow economic calendars before opening any trading positions.
Final thought
The Chande Kroll Stop indicator is a unique and valuable indicator that you can use in many ways while understanding the entire concept. You can customize any of those three parameters that this indicator uses. We recommend mastering the indicator concept by using some demo practice before applying it on live accounts.


