The Elliott wave is one of the basic concepts of financial trading that can effectively explain market behavior. Moreover, this strategy is easy to adopt and can collaborate with price actions and other trading methods. Therefore, using this pattern in financial trading would be a good way to make money online.
However, unlike technical indicators, the Elliott wave is different, and it includes several price swings that may confuse new traders. If you are interested in building an advanced swing trading method, the Elliott wave might increase your trading accuracy.
What is the chart pattern Elliott wave strategy?
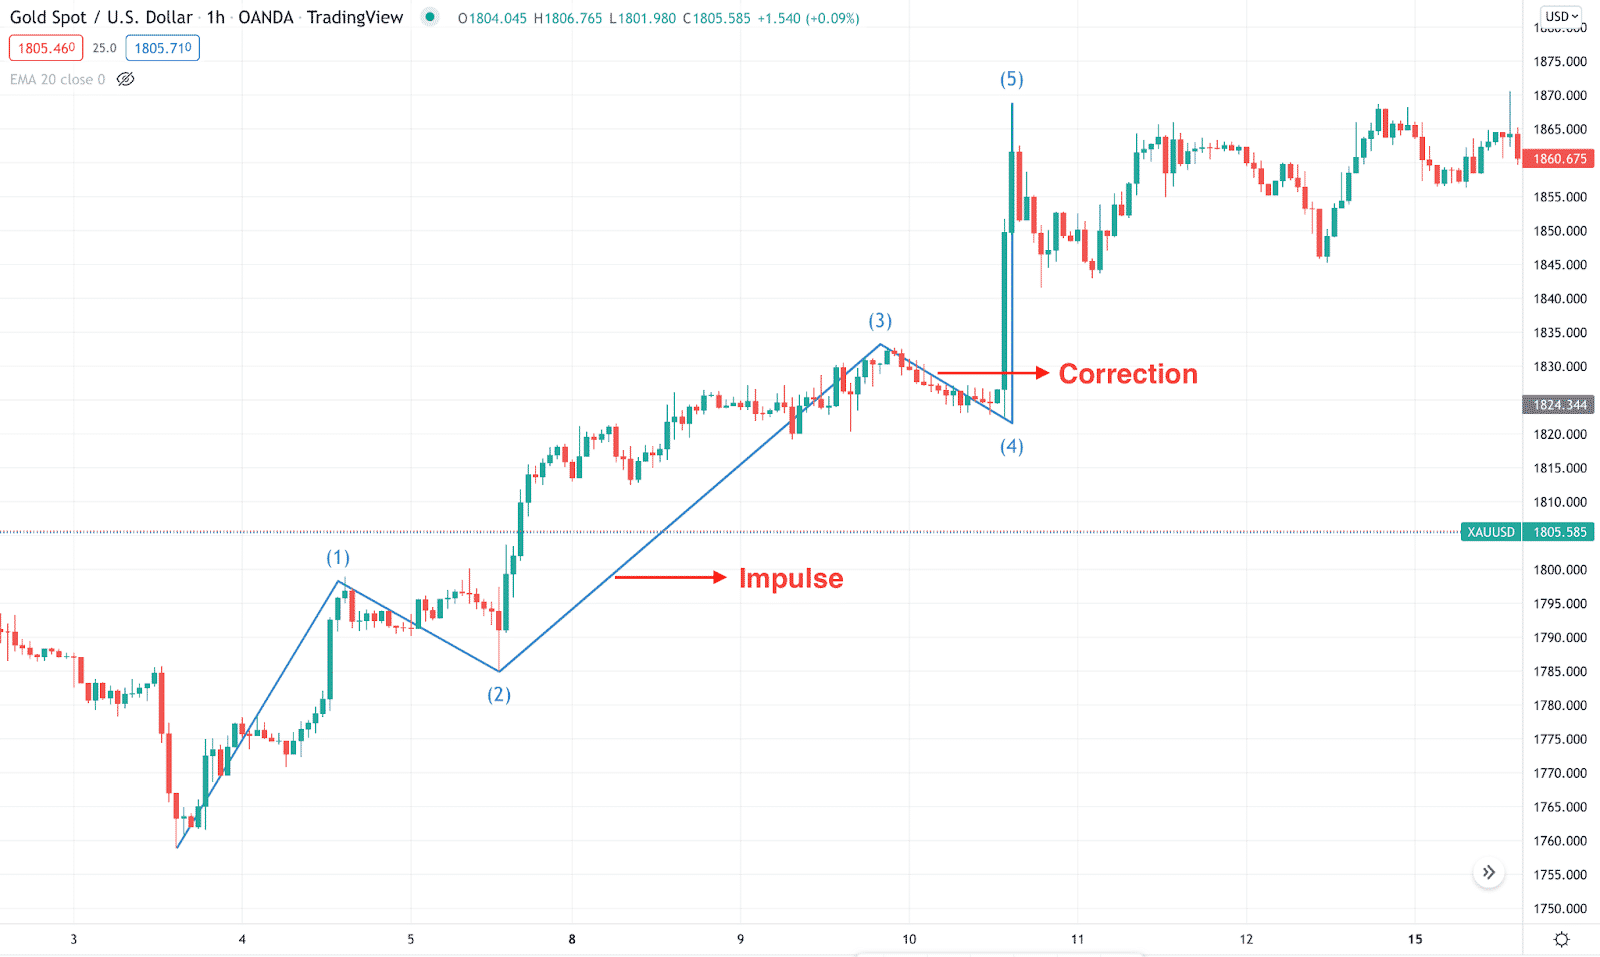
The Elliott wave finds the price direction based on five consecutive waves. Among these waves, we can differentiate the characteristics by looking at the price behavior.
- An impulsive wave is a price swing that shows an aggressive movement by breaking above the near-term highs and lows with massive pressure. It shows a strong trend continuation pattern, which signifies that the existing market trend may extend. Therefore as a trader, it is wise to find trade setups where the impulsive price pressure is heading.
- The corrective wave is the price pattern where candlestick formation remains weaker, and the price barely breaks near-term highs and lows. In that case, any reversal trading from the corrective pattern signifies that the price is likely to follow the previous impulsive movement.
Traders should closely monitor how the price swings are coming, especially where the change from the impulse to correction or correction to impulse happens.

How to trade with the chart pattern Elliott wave?
While taking trades using this tool, investors should follow the basic structure of the wave. The primary indication of the wave is that it initiated a new pattern once the price stars a new trend or direction.
Once you find the first wave, you can easily define other waves with some conditions mentioned below:
- Wave 2 should not exceed the length of wave 1. If it does, the whole pattern will become invalid. The typical way is that wave 2 should retrace up to 50% to 61,8% Fibo retracement level of 1st wave.
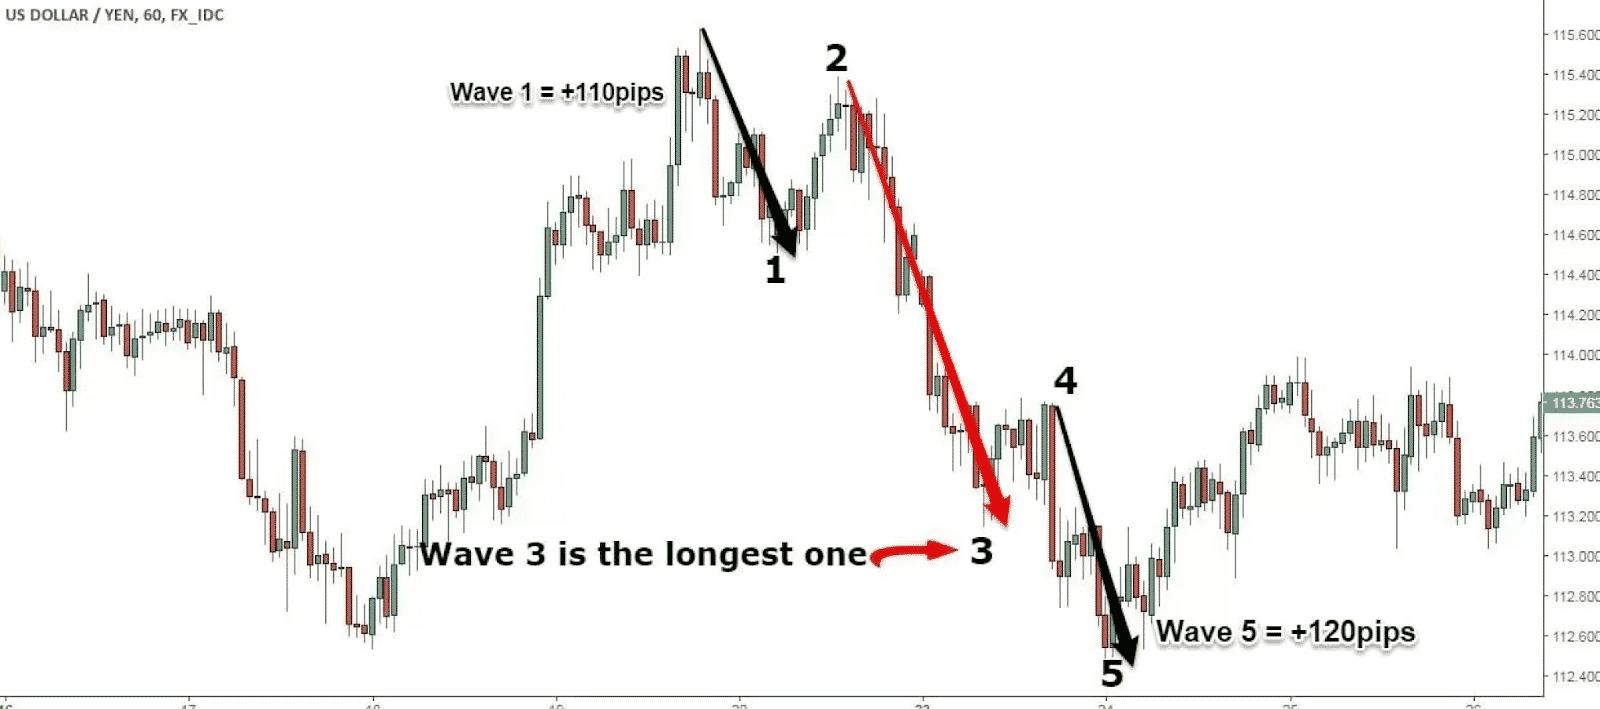
- The 3rd wave comes after the 2nd, and it is likely the longest wave among them. Therefore, it should retrace up to 38.2% to 50% retracement level of wave 2. In the extension, wave 3 might extend at 161.8% Fibonacci extension level of wave 1.
- After wave 3, the 5th wave is the final wave that will complete the pattern. After the 5th wave, the price is likely to initiate a correction where trading opportunity is unavailable.

When we talk about trading, the best approach is finding where corrective waves are completing, and impulsive waves are coming. Any trade setup towards the impulsive wave has higher accuracy rates.
Bullish trade setup
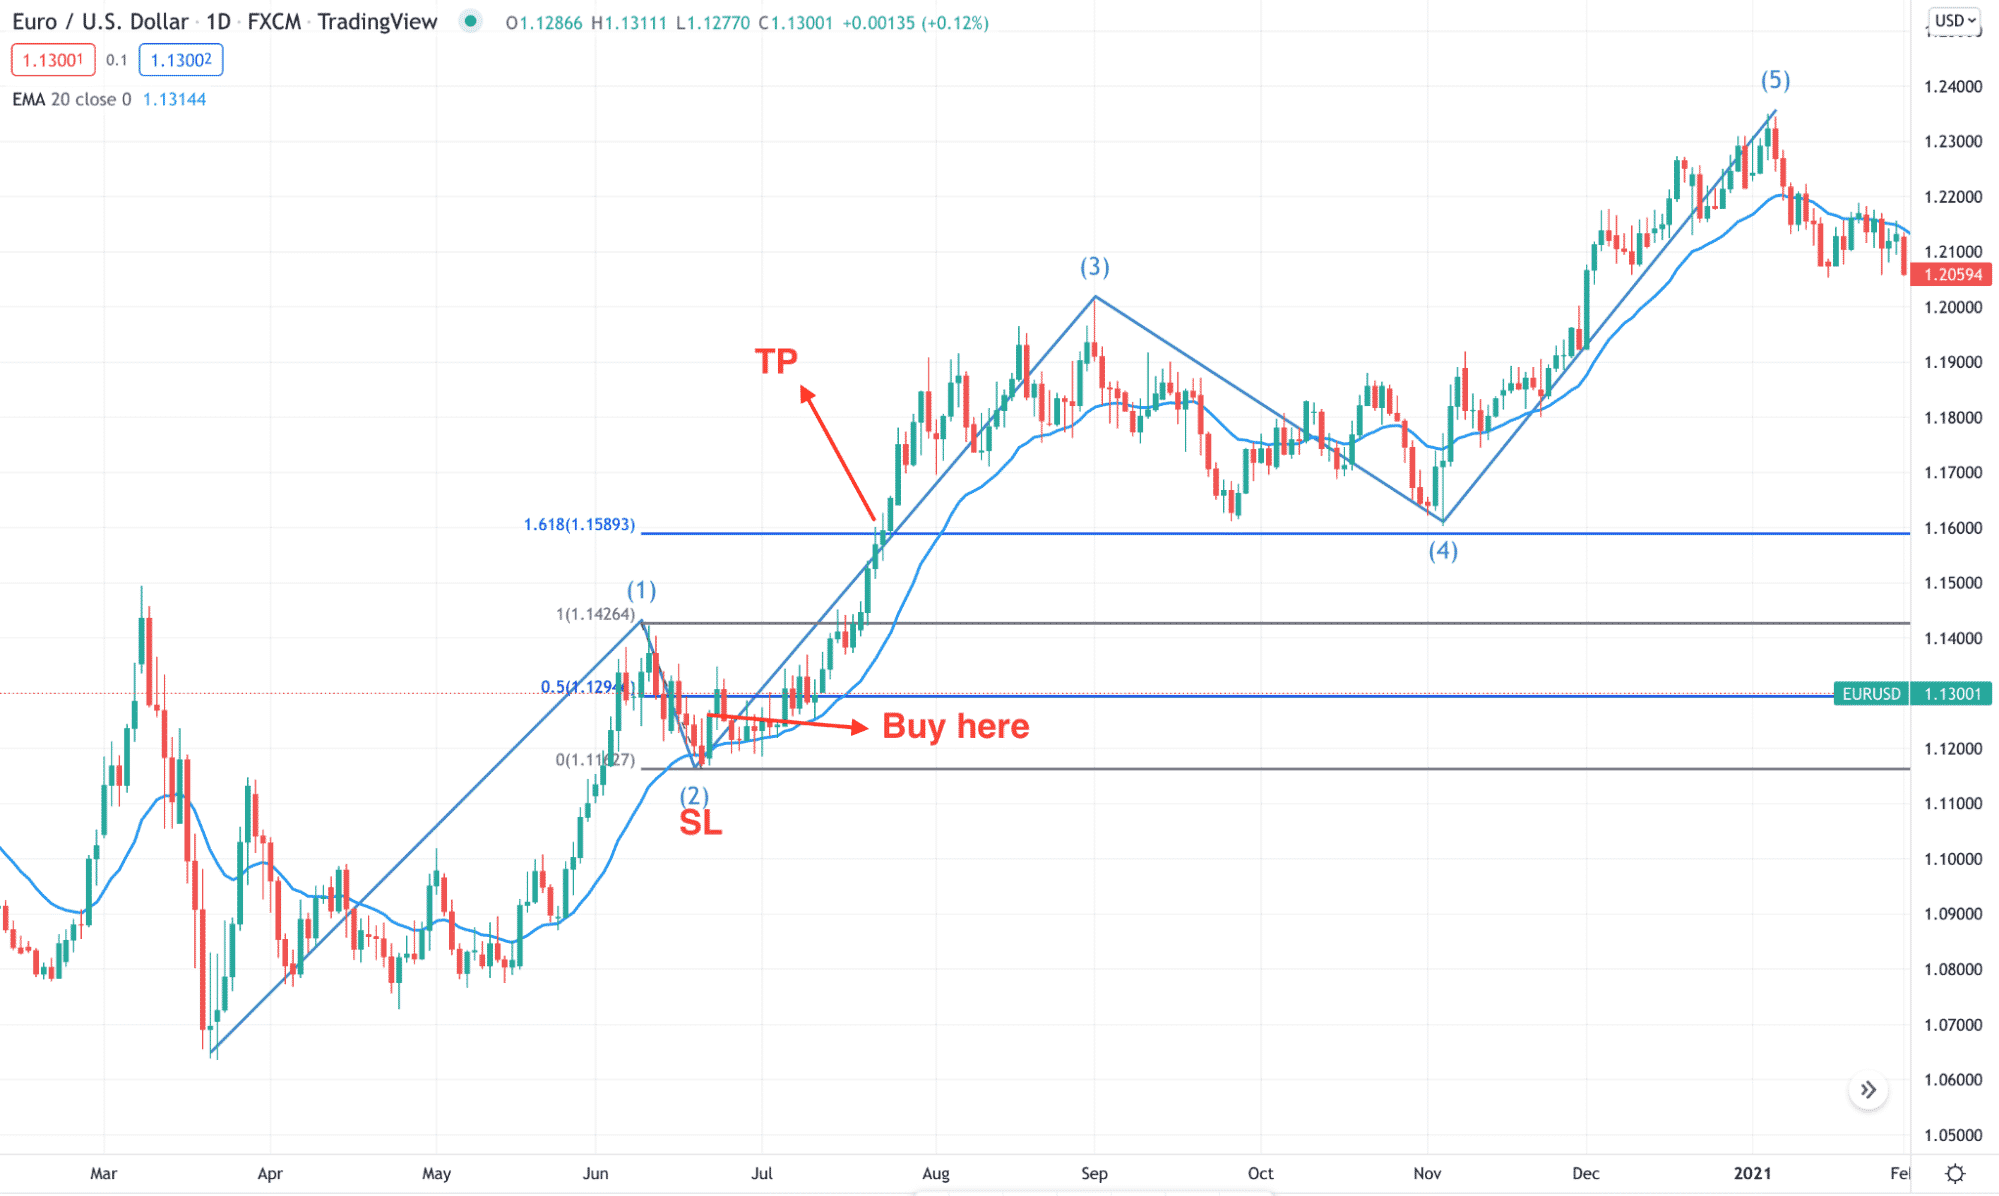
If you have read the above section, you will know that wave 3 is the largest wave. Therefore, in this trading strategy, we will focus on the price action where wave 2 changes to wave 3. Besides using the chart pattern Elliott wave, we will use dynamic 20 EMA as an additional tool to confirm the trade.
Entry
The bullish trade is valid in any time frame, but investors should follow where the broader market trend is heading while trading in the lower timeframe. Before opening a trade, make sure to follow these conditions:
- 3rd wave appeared, and it retraced up to 38.2% to 50% retracement level of wave 2.
- The price moved higher from the Fibonacci level, and price action showed buyers’ interest above the dynamic 20 EMA.
- The price showed a bullish rejection, and at least one candle appeared above the dynamic level.
- Open the buy trade as soon as the candle closes.
Stop loss
The aggressive approach is to put the SL below the rejection candle. Make sure to use some buffer to avoid unexpected loss.
Take profit
Theoretically, wave 3 may extend up to 161.8% Fibonacci extension level of wave 2, which is the ultimate target of the buy trade. However, booking some profits from 1:2 RR is important to avoid price rebounds.

Bearish trade setup
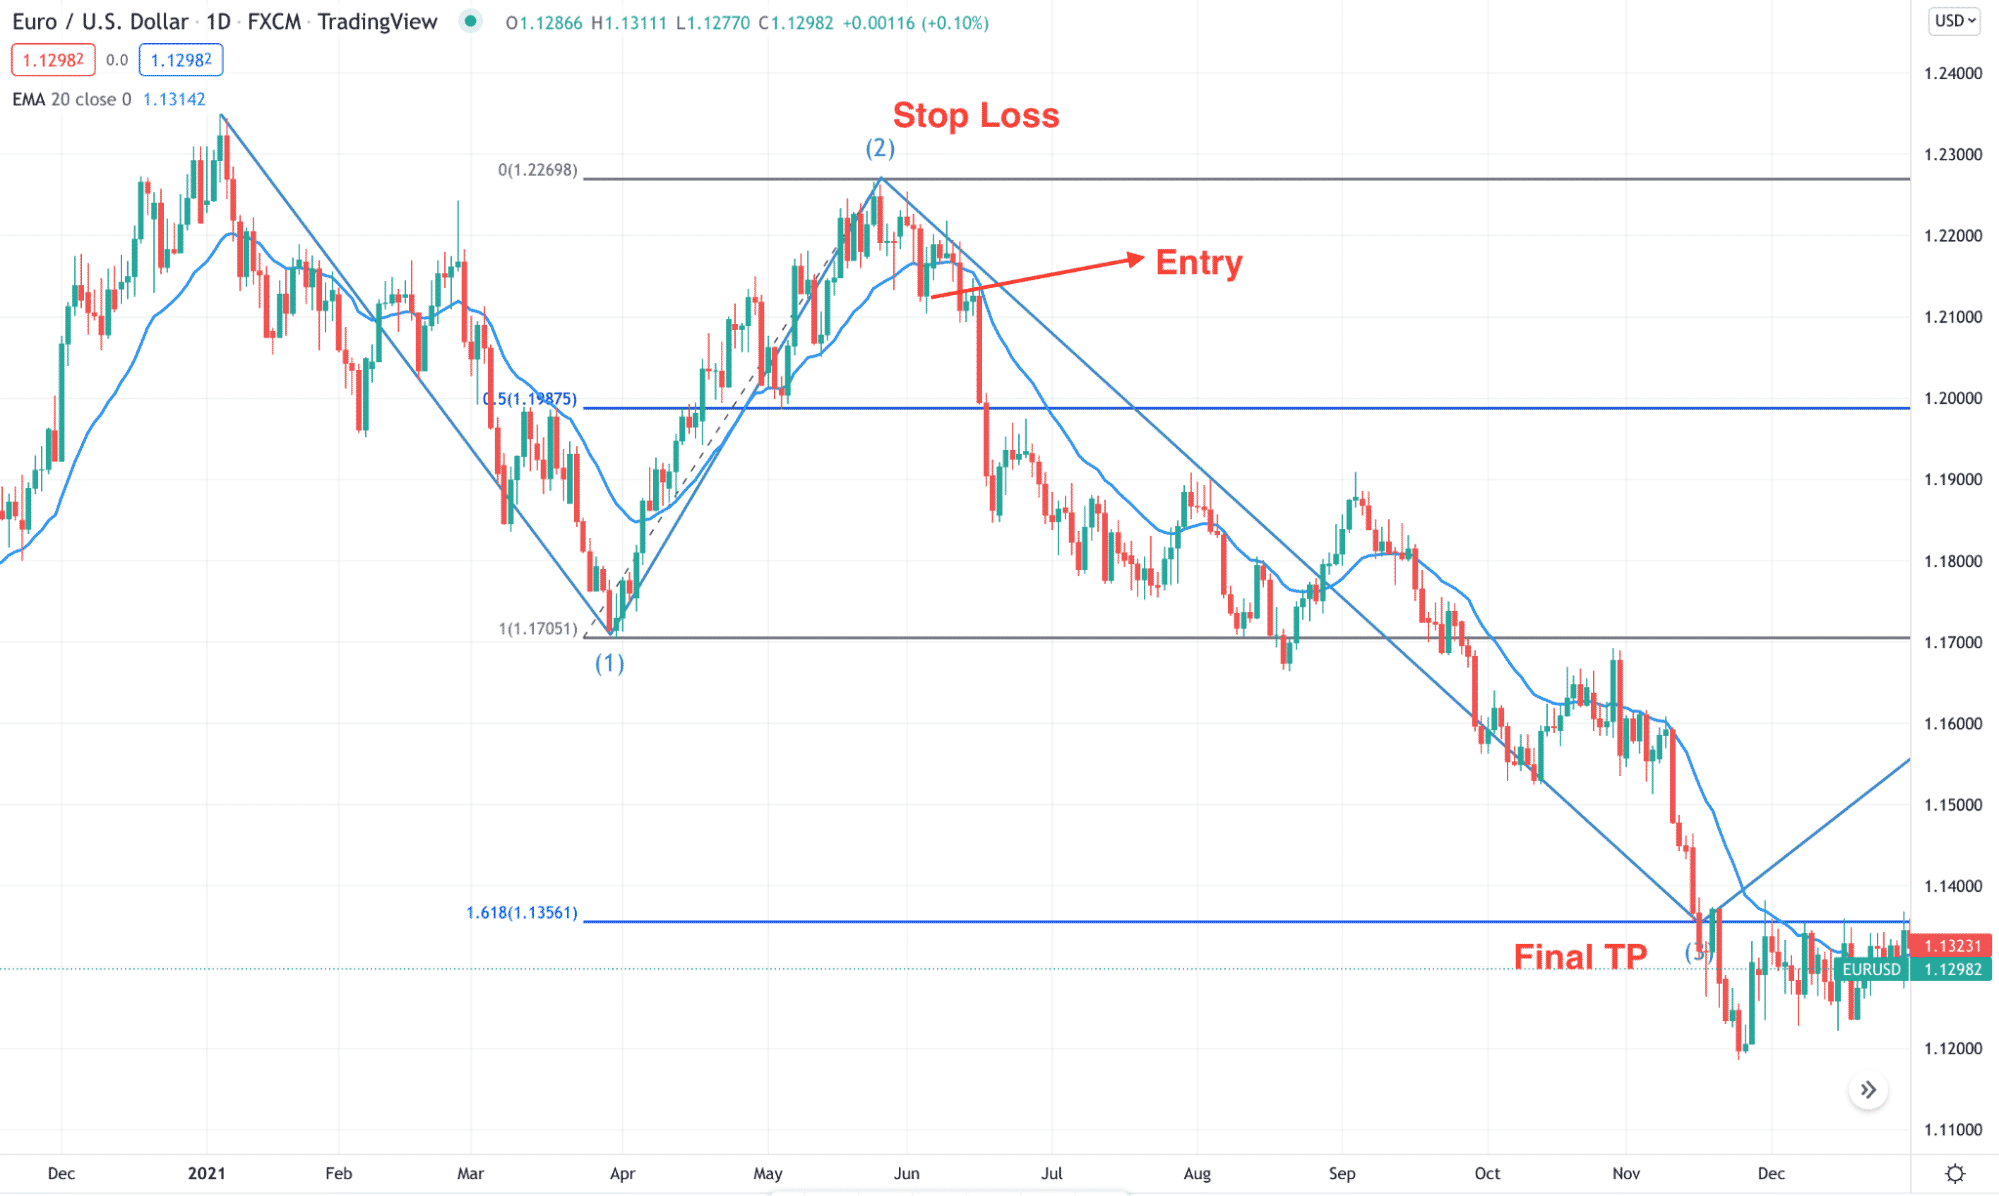
The bearish trade is the opposite version of the buying trade, where investors should find the price at a dynamic level with bearish price actions.
Entry
Before opening a trade, make sure to follow these conditions:
- In the bearish market, third-wave appeared, and it retraced up to 38.2% to 50% retracement level of wave 2.
- The price moved lower from the Fibonacci level, and price action showed sellers’ interest above the dynamic 20 EMA.
- Open a sell trade as soon as the candle closes.
Stop loss
The ideal SL is based on the candle closing. Make sure to use some buffer while setting the SL.
Take profit
The first take profit is based on 1:1 RR, and the secondary and final take profit is 161.8% Fibo extension level of wave 2.

How to manage risks?
One of the biggest challenges in this method is to identify wave 1. Other waves depend on wave 1; therefore, making mistakes in finding wave 1 might affect other waves. Make sure that the price showed a significant breakout or trend change during wave 1.
Investors should follow a strict risk management system to avoid unusual market behavior like other trading methods. Never take too much risk per trade and always use other trading indicators to increase the accuracy.
The ideal approach is 0.5% to 1% risk per trade with a higher return. Investors should follow the broader market trend in lower time frame trading and find the market movement in an active trading session.
Final thoughts
Elliott wave is one of the basic trading concepts that help traders make a reliable profit-making system. Moreover, it would be a reliable money-making machine if you included this trading tool’s price action and candlestick formation. However, close attention to risk management is required where the ultimate success from this technique depends on how investors are getting familiar with it by doing a lot of practice.


