When it comes to technical analysis, chart patterns are some of the most effective tools to use, combined with an in-depth knowledge of price action. Traders use many patterns, but only a few are robust and work most of the time when applied correctly.
Unlike trending trading systems that rely on continued price movement or counter-trend strategies that look for a pivot point, pattern trading does not always account for price movement in its purest form.
It does not matter for us where the trend is. Instead, we need to determine tactical market situations that we can unambiguously interpret and use to profit.
Examples of patterns in forex are:
- Japanese candlestick combinations
- Figures of classical technical analysis
- Price formations from Elliott’s theory
Strictly speaking, anything can be a pattern. For example, a trader saw a pattern of price movement after combinations. Three rising days in a row + 1 falling day. This will also be a pattern. However, it is not a fact that it will give us a significant advantage.
The main thing is to search for tactical situations with quick entry and exit from the market.
The two main categories are reversal & continuation patterns:
- The first one signifies that the trend is changing from an uptrend to a downtrend or vice versa.
- The second one indicates that the price is continuing in its current trend but has consolidated before continuing in the same direction.
Reversal patterns
These are double tops, double bottoms, head & shoulders, inverse head & shoulders patterns.
Double top
This pattern usually forms after an extended uptrend. Thus, it is the formation of two tops after an uptrend.
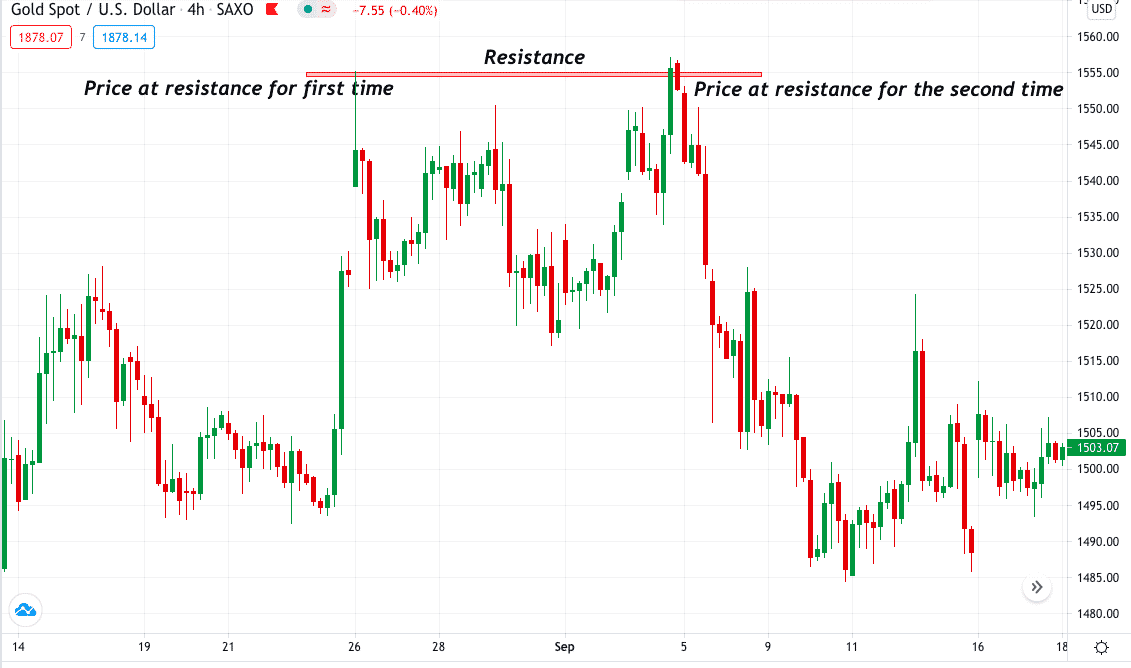
The double top pattern is famous for its simplicity yet the most effective strategy in any trading.
- In the chart, the price makes a new resistance and reverts to create a new swing low.
- The new swing low can be a buy signal for many scalpers but not for a long position as we have a resistance zone very close.
- We further notice that the price touches the resistance twice but fails to make a new high giving us a signal to sell and a potential reversal.
Double bottom
This pattern is the opposite of the double top pattern. When a double bottom forms, it is a sign of price reversing upwards.
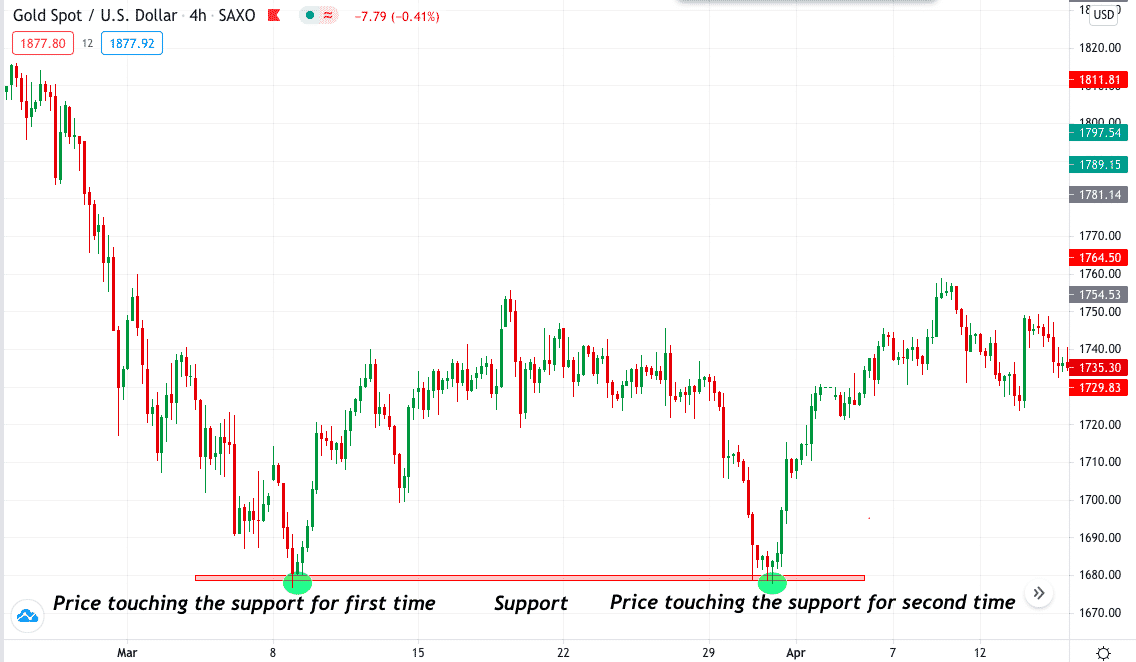
- In the chart, price touches dynamic support once and bounces back, failing to make any new low with momentum loss.
- When we see the price touching the support level twice, we also need to see if the price is making indecision candles, giving us a confirmation of trend break and potential reversal.
Head & shoulders
Head and shoulder is one of the most common patterns. It indicates a price reversal after an uptrend, meaning you would be looking for selling opportunities. First, however, you have to identify critical formations in this pattern to enter a selling trade.
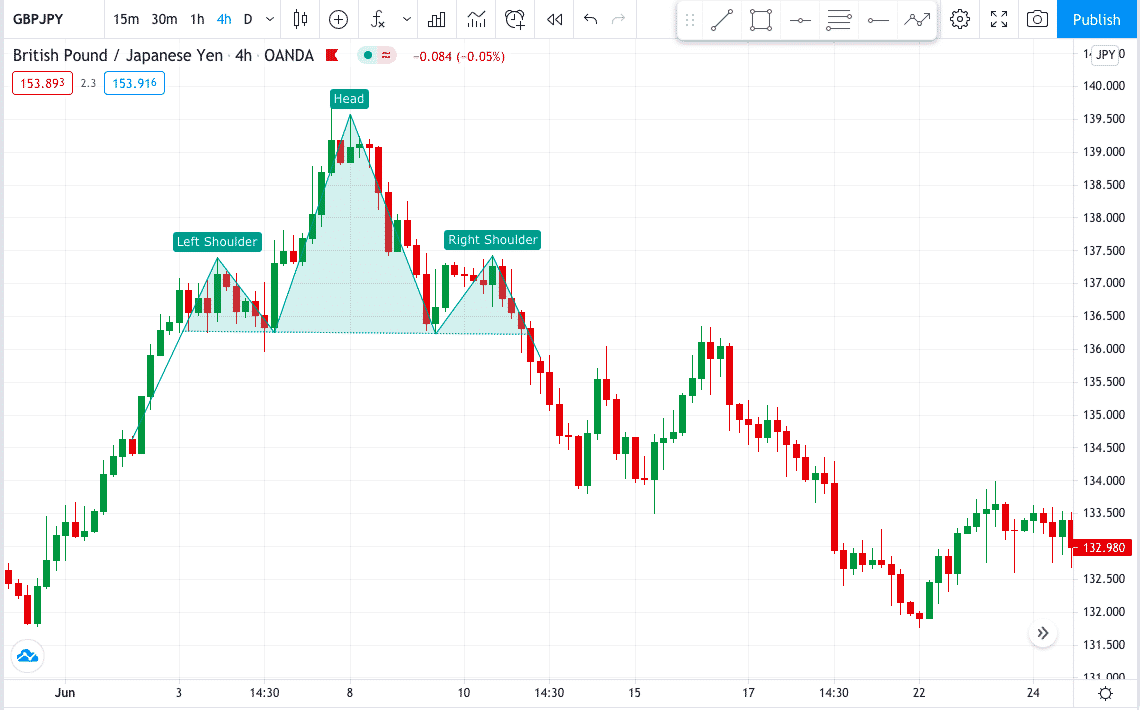
The image above shows the pattern forming a head & shoulder pattern.
- The pattern formation is complete when the market reaches a specific high and fails to break it.
- The pattern formation takes when the market is in an uptrend.
- The price first makes a swing high and then a low, the high is broken, and the price makes another high but makes it low near the first swing low.
- Price then starts making a new high and failing to break the major swing high.
- When the price crosses the neckline, the trade is taken, which is the zone where the price made two new swings low.
Inverse head & shoulders
This pattern, as the name suggests, is the opposite of the head and shoulders. It forms after a downtrend and is usually a sign that the price changes direction upwards.
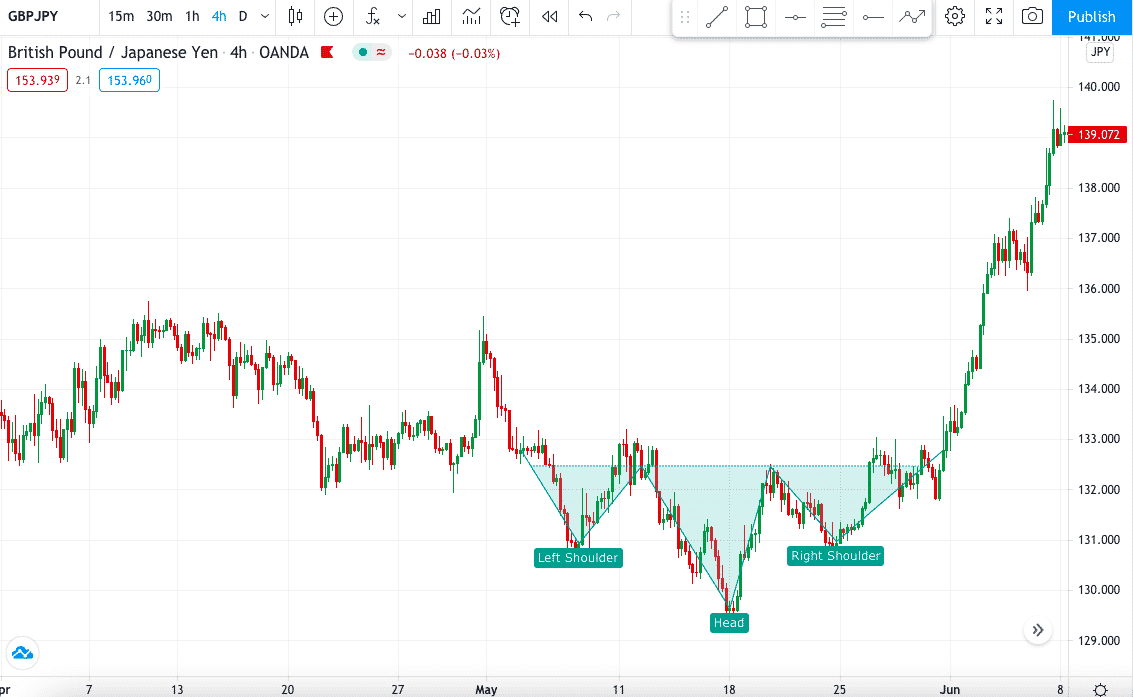
The first shoulder:
- After a downtrend, the market reaches a low price but fails to break it and then bounces up to resistance.
- This price movement forms the first shoulder.
- When the price reverses from the neckline and moves down again, passing the low cost of the first shoulder, it moves back up to the neckline, forming the head.
The second shoulder:
- It forms when the price moves down again to a low price level similar to the first shoulder and moves up to the neckline.
- A neckline break signifies that the trend is moving upwards, and there are opportunities to go long.
Continuation patterns
As mentioned above, these patterns signify that price is likely to continue in its current trend, either upwards or downwards. Let’s look into these patterns type, namely the ascending, descending, and symmetrical triangle patterns.
Ascending triangle
An ascending triangle formation is when the price forms a resistance level in a horizontal plane parallel to an upward trendline. The triangle shape is complete where the two lines converge. It is essentially a consolidation of price until it breaks the resistance upwards.
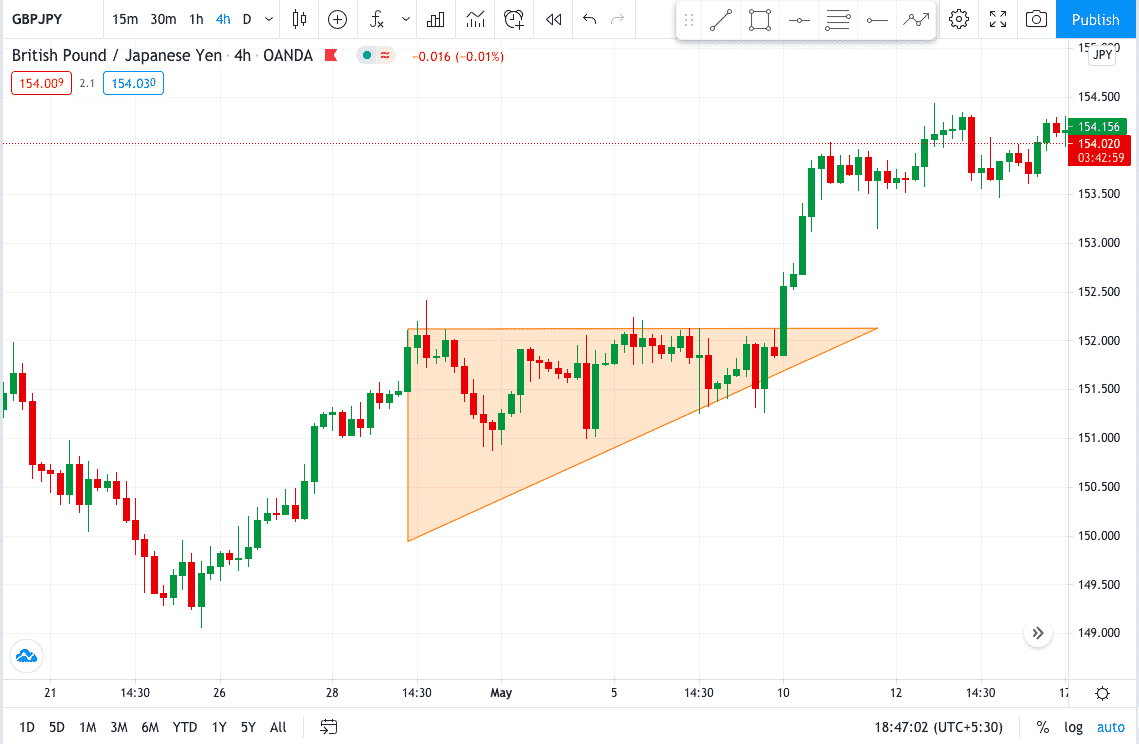
In the image, the market was on an uptrend.
- There are a lot of bullish candles showing high momentum and bullish sentiment.
- The candle then started to form a resistance level that did not allow the price to make the swing high.
- This new resistance formation is to complete the market orders. Eventually, we can see the price broke through the resistance and continued moving up forming. A valid entry for a buy is confirmed once the price breaks that resistance upwards.
Descending triangle
This pattern consolidates the price that forms a support level in a horizontal plane and a downward trendline, where it converges with the support line completing the triangle shape.
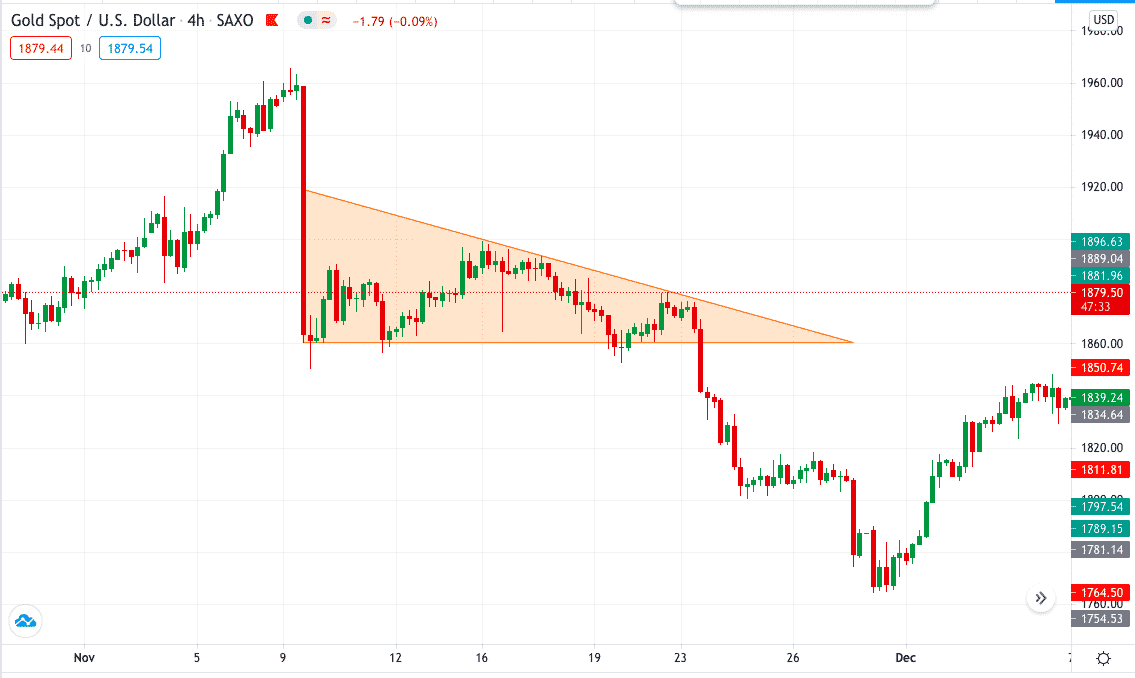
- The pattern forms after prices have moved downwards and fail to break a certain level, bouncing on that same support multiple times while the upper trend is in a downward formation.
- The upper trendline links the lower highs, therefore, forming a downward trendline.
- Once the price breaks, the support is downward, it is confirmation of the continuation of the downtrend.
Symmetrical triangle
It forms by the converging of the upper/lower sloped trend lines. It is formed by connecting the lower highs to form the top and lower lows to create the bottom sloped line.
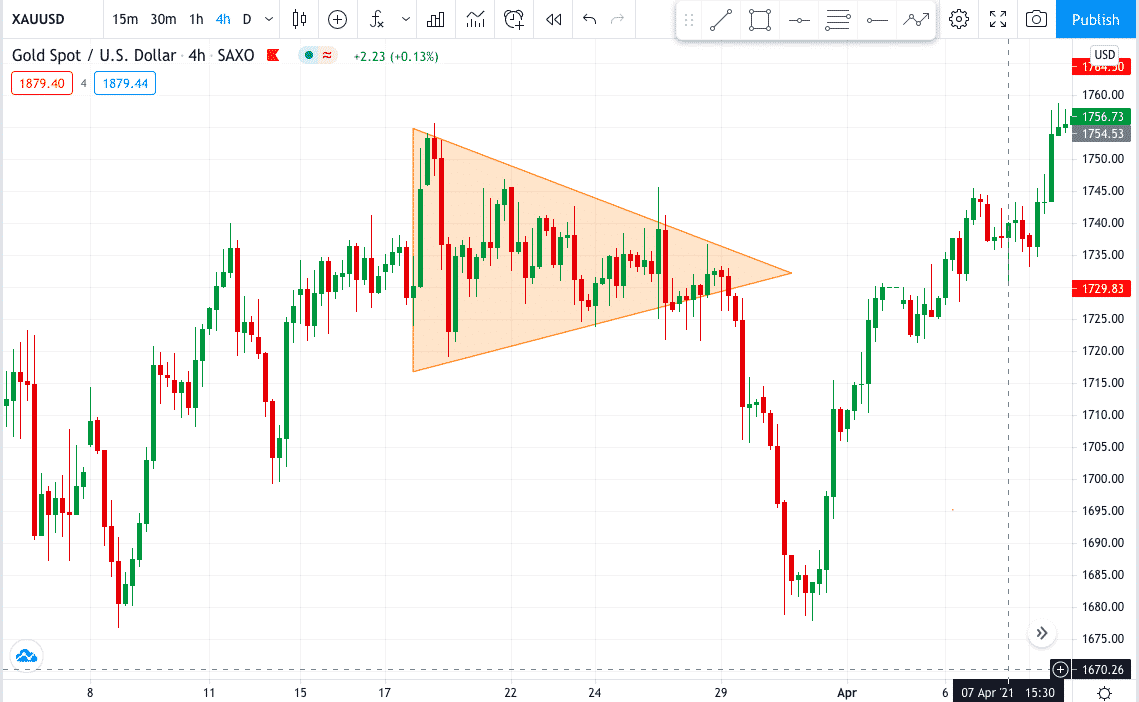
Let’s take an example of price moving in an uptrend and then consolidating to form a symmetrical triangle.
- Price starts to consolidate and creates higher lows. Connecting these higher lows forms the upper trendline.
- Finally, the bottom trendline is formed by combining the lower highs.
- As seen in the image, the price movement starts to reduce, and the candlesticks are smaller towards the point where the two lines converge.
- So this completes the triangle, and a break above the upper trendline is a sign of price continuing upward.
Conclusion
Many patterns do not work the way they are written in the books. The fact is that most of the forex materials are taken from books 20-30 years ago. Then there was a slightly different market. Therefore, most of the patterns do not work as described in the classical literature. That is, it is necessary to check the knowledge gained with the current market situation.
The topic of patterns is truly inexhaustible. For example, with trends, everything is much simpler. The trend is either there or not. If there is no trend, then the trend system will generate losses.
On the contrary, searching for trading patterns gives you almost limitless possibilities in terms of successful trading. For example, we can find patterns that work in a trend and flat environment. Or we can look for simple ones that form within 1-2 candles or, on the contrary, multi-figure and multi-phase combinations.
We recommend choosing strategies that you understand and hone them to perfection.
As Bruce Lee said: “I fear not the man who has practiced 10,000 kicks once, but I fear the man who had practiced one kick 10,000 times.”


