Moving average (MA) is a technical indicator that captures the crypto market moves by updating the average prices. A lagging indicator illustrates the previous price action to depict future price moves. Understanding MA can help you increase your profitability.
Let’s talk about the top five tips to utilize the MA effectively and crypto trade to allow you to earn and gain.
What is the crypto-adjusted moving average?
It depicts the average price of crypto. By applying for the MA, you can determine what the future holds for crypto.
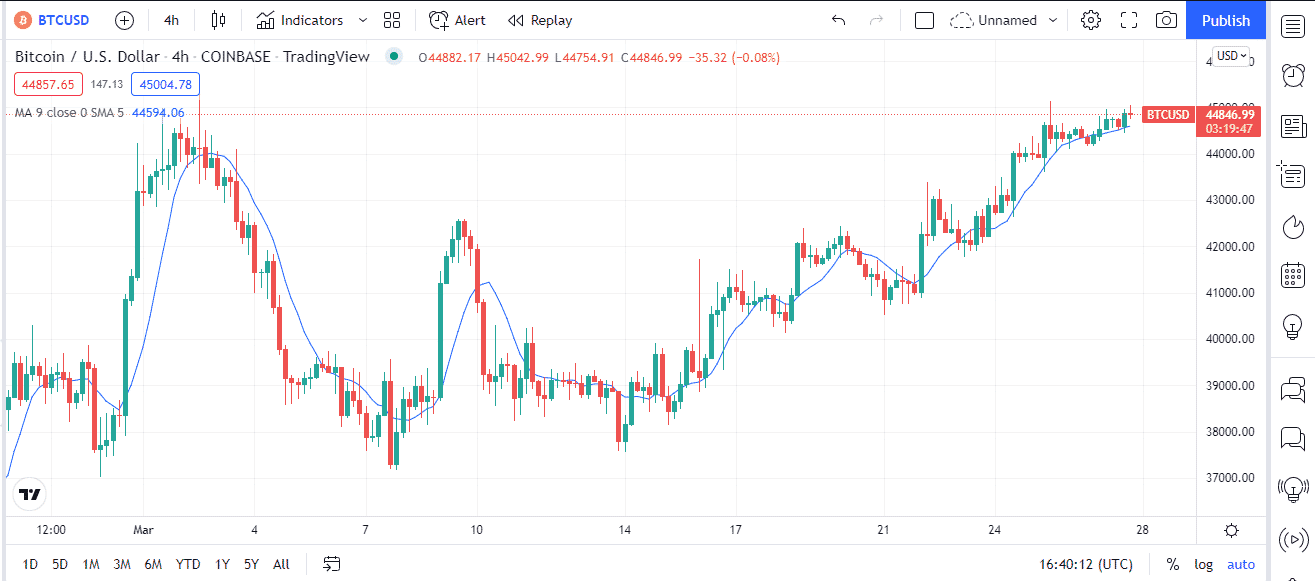
We know that the price in a market tends to move in the same direction as the ongoing trend. The crypto-adjusted MA is a highly effective indicator that gives a glimpse of what traders, on average, are doing in the market. In other words, it helps traders to gauge the market sentiment.
Top 5 tips for trading with crypto-adjusted MA
Below are the top five tips based on MAs that market participants can use for crypto profitability. Traders pick out the most suitable one, depending upon their trading styles, preferences, and risk appetite.
Tip 1. Finding the direction of the trend
Finding the trend’s direction is the simplest strategy you can apply. MAs instantly give traders an idea of the trends occurring in a crypto market.
Why does it happen?
Using the MA indicator, traders can pinpoint whether the price is making a new high or not. Market participants who trade according to market trends tend to accumulate when the price hits significant MAs.
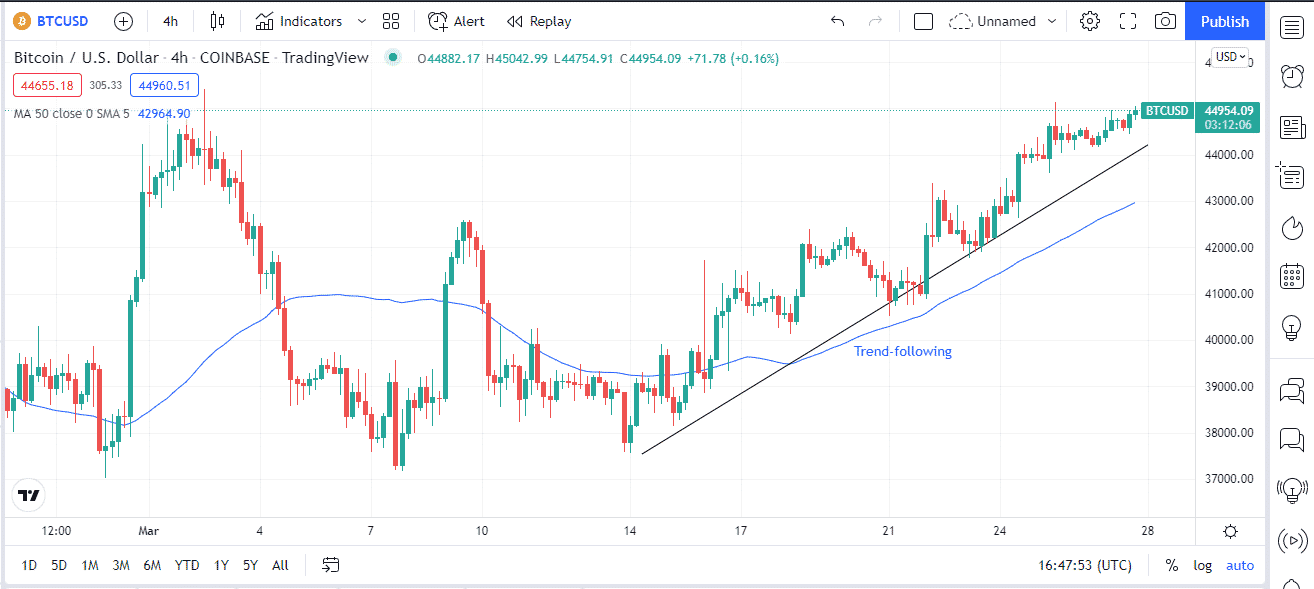
- If the price action stays above the MA, it is an uptrend.
- Conversely, if the price action remains below the MA, it signals a downtrend.
How to avoid the mistake?
Following a trend is a bit risky, and there are many price pullbacks. So make sure to look out for reversals.
Tip 2. Identifying crossovers
The general idea of a crossover is that one MA crosses the other. Traders use this to identify when to get in or get out of a trade.
Why does it happen?
Traders’ most significant crosses are 50 MA, 100 MA, and 200 MA. A Golden Cross occurs when 50 MA crosses over the higher 200 MA. Wait for this crossover to correct before entering a trend.
A short-term MA crossing a long-term MA shows that short-term traders have become more aggressive.
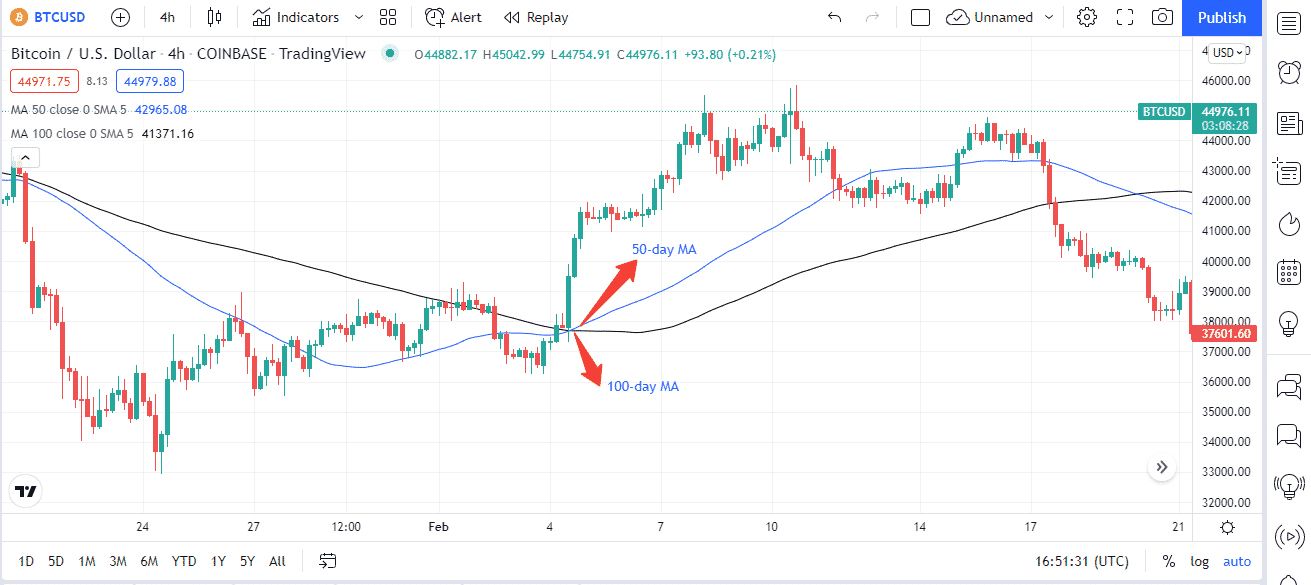
Entering a trade after this type of crossover gives more profit. A shorter period MA closing over a longer period MA depicts that the trend is bullish. In this case, the traders can begin buying.
How to avoid the mistake?
A shorter period of MA closing over a longer period of MA depicts that the trend is bullish. In this case, the traders can begin buying. Entering a trade after this type of crossover gives more profit.
Tip 3. The Guppy method
You can also apply multiple MAs, which refers to as the Guppy method. Traders use multiple Guppy MAs to see long- and short-term trends simultaneously.
Why does it happen?
Changing trends, breakouts, and trading opportunities at different periods can be identified using multiple MAs: double MAs, triple MAs, or even a whole moving average ribbon.
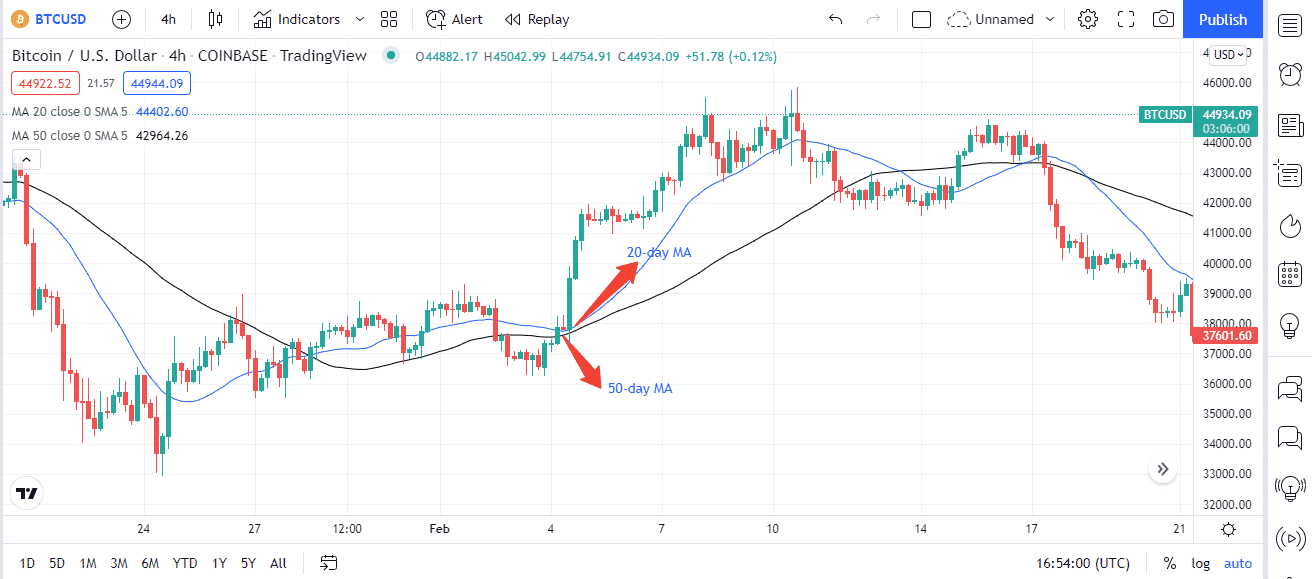
A 20 MA crossing over a 50 MA means that the trend is bullish, and a trader can enter the market. If the opposite occurs, traders tend to exit the market.
How to avoid the mistake?
The crypto market is prone to volatile news, so these crossovers sometimes don’t depict the actual situation of the market.
Tip 4. Identifying support and resistance levels
Three points of interest are determined by traders using resistance and support levels. They are the market trend, the best time to enter the market, and the best spots in the market to exit with a profit or loss.
Why does it happen?
A trader may use the indicator to locate acceptable entry and exit positions if he responds around the resistance and support lines inside the value area. A support region, more particularly, shows that the price has declined but does not fall below the support level.
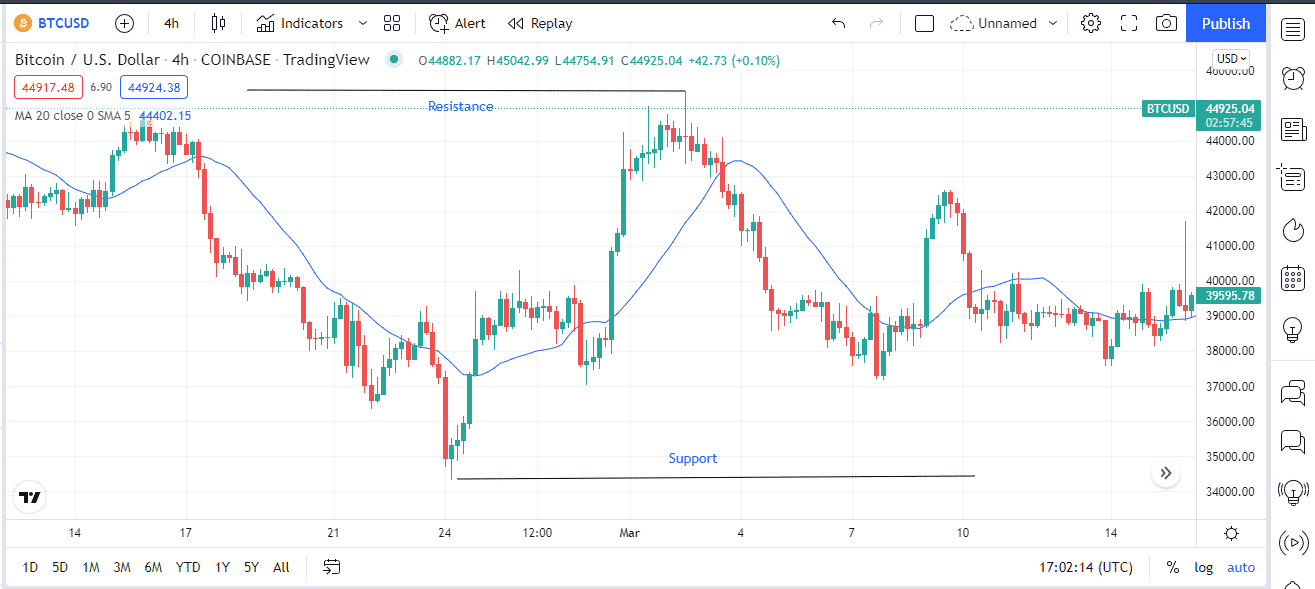
A resistance area is where the price rises but does not rise beyond the resistance level. Instead, the price gets closer and closer to the resistance level, becoming more expensive in the process.
How to avoid the mistake?
MA doesn’t detect the cyclic nature of the crypto markets. It means that if a market is going up and down frequently, MA won’t be able to capture it.
Tip 5. Combining with BB
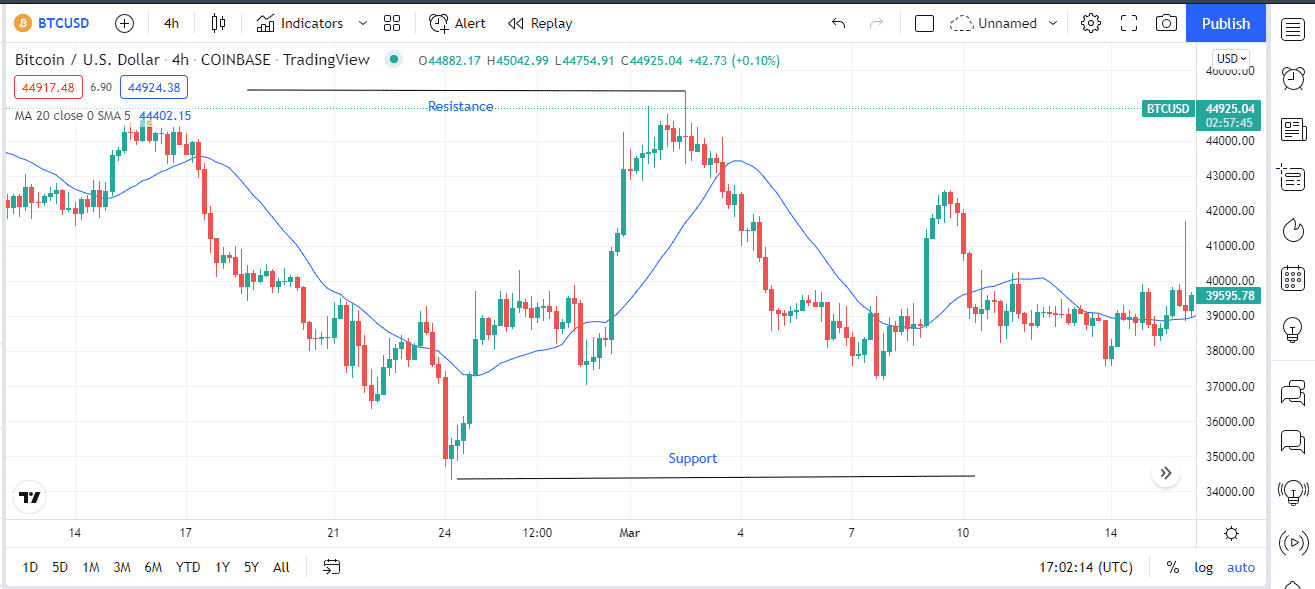
MA illustrates trend changes. This can be used to spot trends once they have been developed. Combined with Bollinger Bands (BB), MA envelopes can identify high-probability turning points in short-term trends.
Why does it happen?
You can find the momentum in a crypto market by the distance between a leading MA and the spot price. BB depicts how well MAs can gauge momentum and thus volatility.
Traders usually use BBs with 20 periods of MA. They are typically set at 2.0 standard deviations, which means that 95% of the price action occurs between these channels. Experimenting with these techniques can prove advantageous for traders.
How to avoid the mistake?
MA with BBs doesn’t work well if the market is constantly moving or staying neutral. If there’s no trend, then there’s no trading opportunity.
Final thoughts
As are highly popular and for the right reason. They can be excellent indicators for traders, especially those who pick out trends. However, they may not be precise all the time and can lag as well. Therefore, traders should be wary of this when utilizing MAs.
Nonetheless, MAs allow traders to understand the crypto market better to make profitable decisions.


