The Directional Movement Index (DMI) indicator is a powerful technical indicator to assure the price pressure in any specific direction. When someone can use this indicator efficiently, it enables making enormous profits by participating in potentially profitable trades. So it makes sense that the DMI indicator becomes an attractive technical indicator to crypto investors.
However, there is no alternative to learning the components alongside a professional’s using procedures to obtain the best results from any trading indicator. This article will introduce you to the DMI indicator and the top five tips to use this indicator with chart attachments for a better understanding.
What is the DMI indicator?
It is a precious technical indicator that helps investors to determine both trends and trend strengths of any trading instrument. The developer of this technical indicator is J. Welles Wilder and the developing period is 1978. The DMI results in an independent window containing three dynamic lines, and crossover between these lines or readings declare the price direction and force of the trend.
Three components of the tool are:
- Positive line (DI+)
- Average line (ADX)
- Negative line (DI-)
The top five tips for using the DMI indicator in crypto trading
Now you know the basic concept and components of this tool. Obtaining the best results from this technical indicator requires following specific guidelines or professionals. The following part will list the top five tips to win through the DMI indicator.
Tip 1. Entering a bullish market
When seeking to open buy positions, check the DMI indicator window. The positive (blue) directional index line (DI+) will surpass the negative (DI-) on the upside; it declares a buy pressure on the asset price. In this situation, crypto investors usually check the ADX line; if the value rises above 20, the DMI indicator suggests opening a buy position.
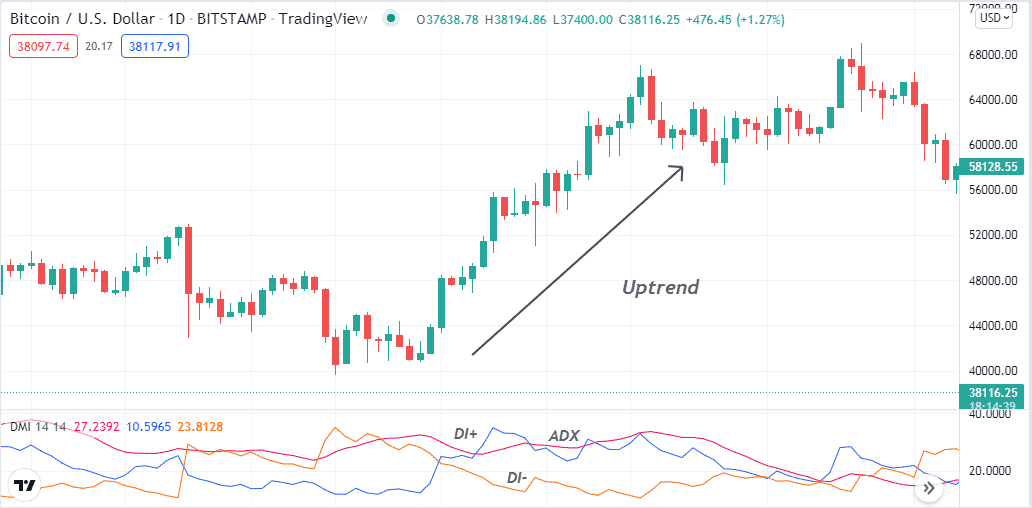
How does this happen?
The calculation formula of the DMI indicator is like oscillator indicators. Crossovers between the positive and negative lines declare trend and the direction. These two lines get wider indicating more significant force. Meanwhile, the ADX line shows the strength of the current trend. The value increases as the strength increases of the trend.
How to avoid mistakes?
Check the indicator readings carefully before entering trades; try to open positions near any finish line of a downtrend. Before entering trades, you can conduct a multi-timeframe analysis to confirm the actual direction.
Tip 2. Entering sell trades
The bearish setup scenario is the opposite crossover between the DI+ and the DI- lines. The DI- line will cross above the DI+ line to declare sellers’ domination at the asset price. Moreover, checking the ADX (maroon) line that shows a value over 20 indicates sufficient declining pressure on the asset price and suggests opening a sell order.
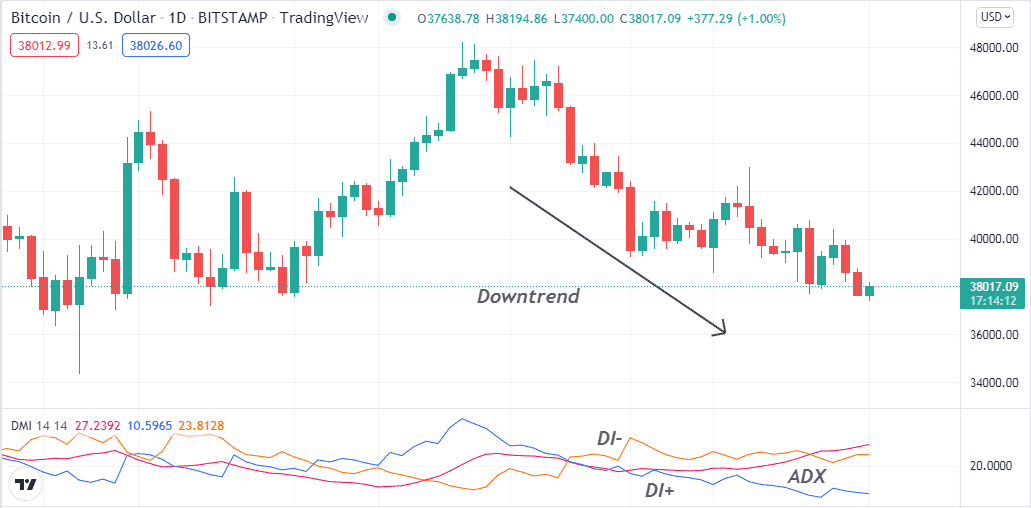
Why does this happen?
The crossover between two lines defines the market context like many other oscillator indicators to determine the trend direction. Moreover, the ADX line declares the strength of the current trend. Many investors use only ADX as a supportive tool while making trade decisions.
How to avoid mistakes?
Try conducting a multi-time frame analysis to confirm the price direction before entering trades. Don’t make early entries and must follow specific trade and money management rules while using this indicator to make trade decisions on crypto assets.
Tip 3. Determine sideways using the DMI indicator
You can use the DMI indicator to determine sideways. Determining sideways is important as it enables catching swing trades by identifying breakouts. When the DI+, DI-, and the ADX line make frequent crossovers, it declares a ranging market or consolidating phase of price movement.
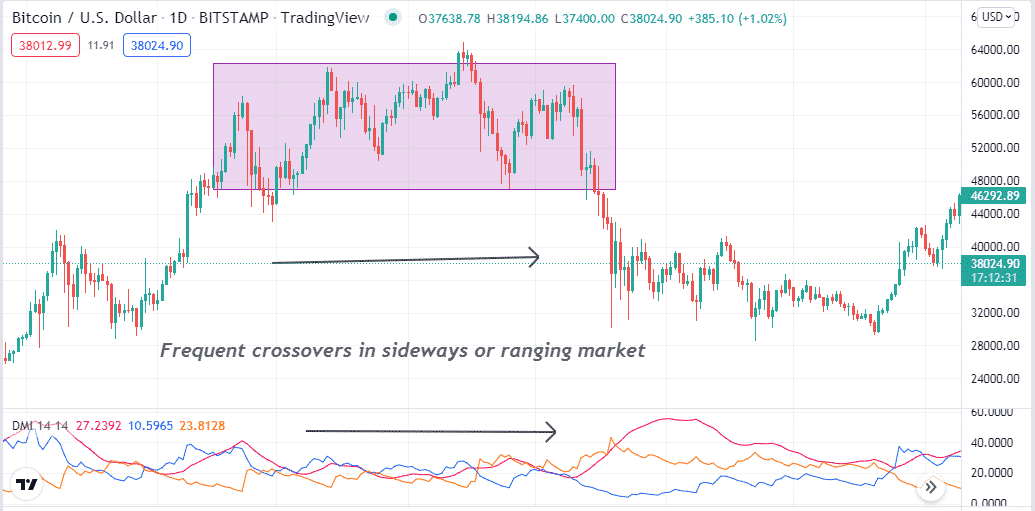
How does this happen?
When the volatility decreases, the trend loses strength and starts moving sideways. So it makes sense that the directional lines (DI+, DI-) start making frequent crossovers within a specific period. Meanwhile, the ADX line won’t move in any direction and will start moving in sideways.
How to avoid mistakes?
It is better not to enter trades sideways as you may not be able to make significant profits. Meanwhile, smart crypto investors seek breakouts to enter more potentially profitable trades with more minor risks.
Tip 4. Combining Bollinger Bands with DMI indicator to determine breakouts
The Bollinger Band (BB) is a popular technical indicator among financial traders to determine breakouts. When the bands of the BB indicator get closer, wait till the price reaches any edge and observe the price movement. Meanwhile, the DMI indicator can determine that direction’s price direction and trend strength.
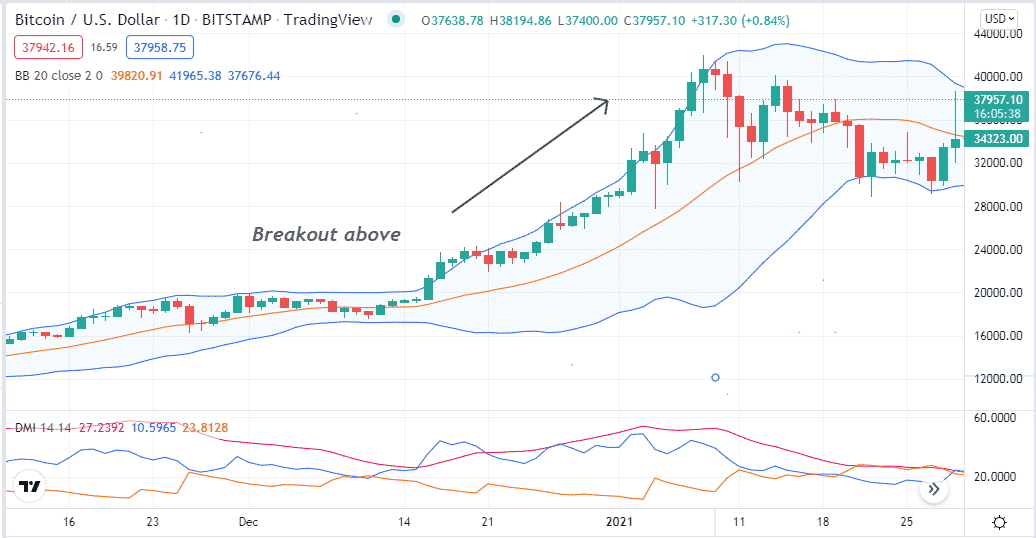
How does this happen?
It is common among financial instruments that when the volume decreases, the price movement loses direction and moves slower. As soon as the price gets stronger in any direction, it starts to move rapidly, so both indicators show results according to the movement.
How to avoid mistakes?
Don’t make early entries and better seek to open positions near support resistance levels as it enables participating in more potent trades.
Tip 5. Combining the parabolic SAR indicator with the DMI indicator
You can combine the DMI indicator readings with another popular technical indicator, the Parabolic SAR, to determine precious trading positions. For example, a bullish crossover occurs between the DI+ and the DI- line. In the meantime, the parabolic SAR starts making a series of dots below price candles. Then combining these two readings, it is safe to open buy positions.
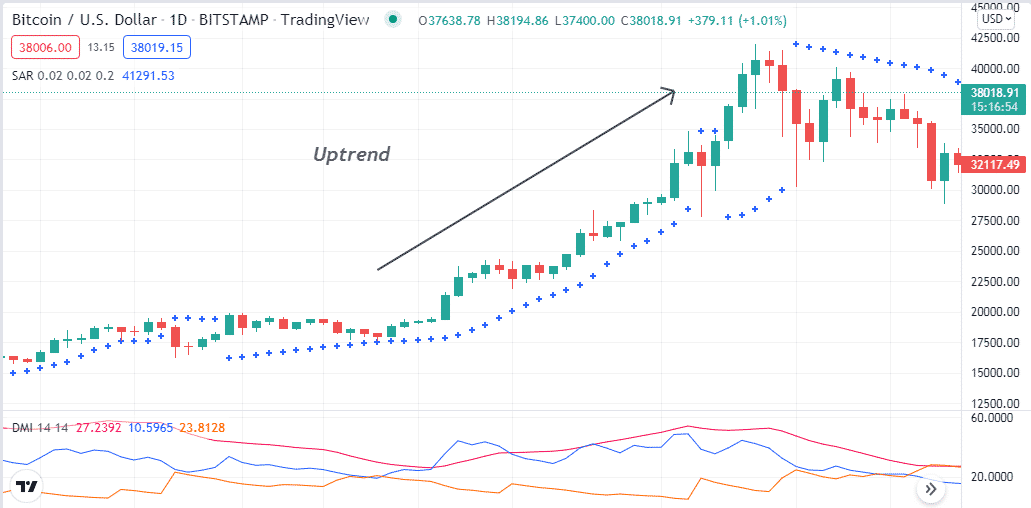
How does this happen?
When both indicators suggest the price movement in any specific direction, you can consider it precious as each calculates the market data by different calculations.
How to avoid mistakes?
It is not wise to make investment decisions only relying on technical indicators while many other forces affect the price movement. It is better to check on fundamental info before making trade decisions; it will enable catching the most potential trades.
Final thought
Finally, the DMI indicator is already famous among financial traders, and you can undoubtedly use this concept to generate trade ideas in crypto assets. We recommend mastering the concept with sufficient practice before using it on live trading.


