Because the crypto markets are constantly open and trading occurs around the clock, trend lines can only be constructed when there are price variations that fit the trader’s requirements.
Why is Zig Zag a helpful signal in turbulent markets such as cryptocurrency? The reason is the same. This strategy detects trend lines in cryptocurrency prices such as Bitcoin. The trend lines in crypto fluctuate, and a trader can see when the trend has stopped and begins to reverse.
What is Zig Zag RSI strategy?
The indicator is a technical analysis chart tool used to identify the highest and lowest price points on a chart. So it can only detect two trends: upward and downward.
So if the cryptocurrency is rising, the Zig Zag indicator will indicate an upward trend from when it climbs out of the preceding downward trend until it reverses.
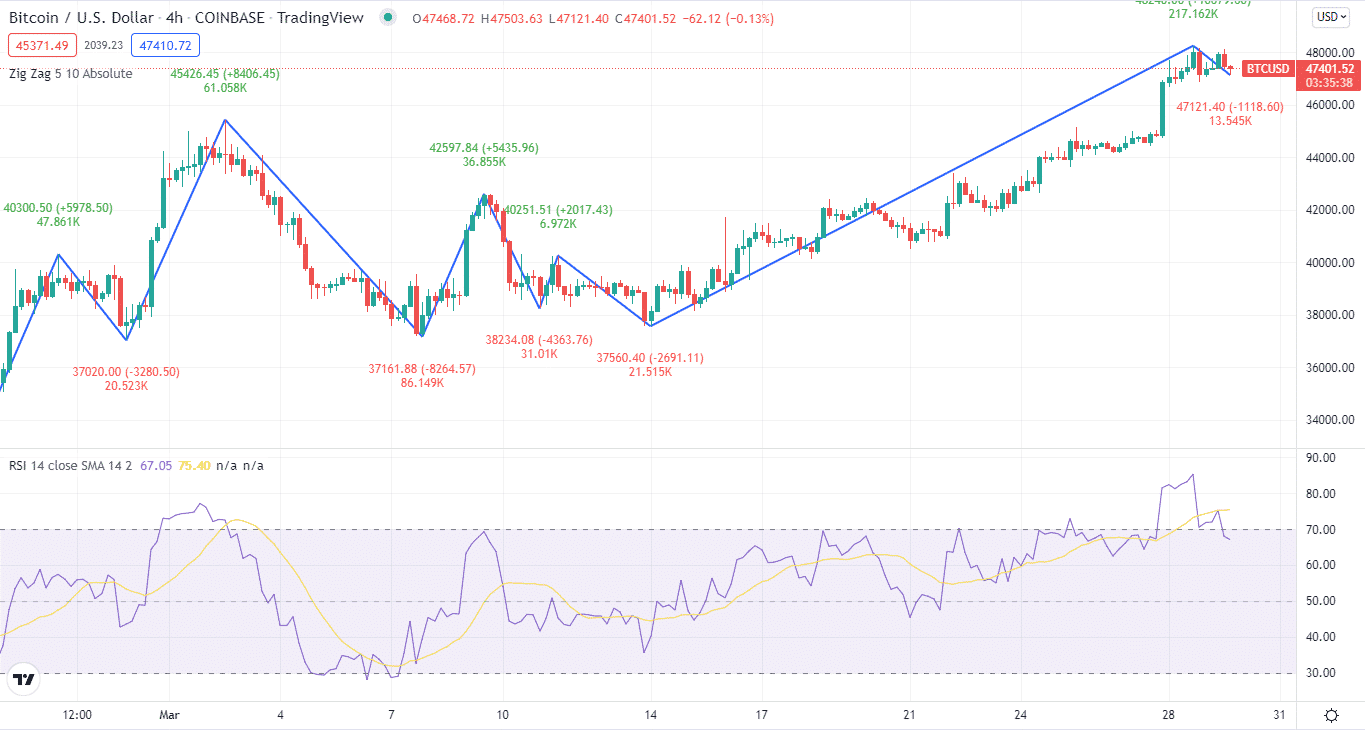
Unlike other trend-based indicators, this indicator aids in determining the influence of random price fluctuations in cryptocurrency trading and identifying price patterns and changes in these trends.
In addition, traders can use popular technical indicators and, in our case, the relative strength index (RSI) to confirm whether the price of a security is overbought or oversold.
Top five tips for trading with Zig Zag RSI strategy
If you want to succeed in the crypto market, you must be ahead of several trends. Here are the top five tips for mastering the crypto Zig Zag RSI strategy. Go on reading this article.
Tip 1. Setting the depth, deviation, and backstep indicator settings to standard
Depth determines how far back in time you wish to travel. Deviation specifies how much of a % variation in value you wish to achieve before the indicator reverses direction. The minimal number of candlesticks between highs and lows is the backstep.
Why does it happen?
Most versions of the indicator have a default value of 5%. This implies that the Zig Zag indicator will not detect less than 5% price fluctuations.
This solid price foundation sets the stage for a greater price gain while filtering out tiny 2-3% price fluctuations that may indicate the cryptocurrency is moving sideways. When the price moves in a new direction, the indicator begins to create a new line.
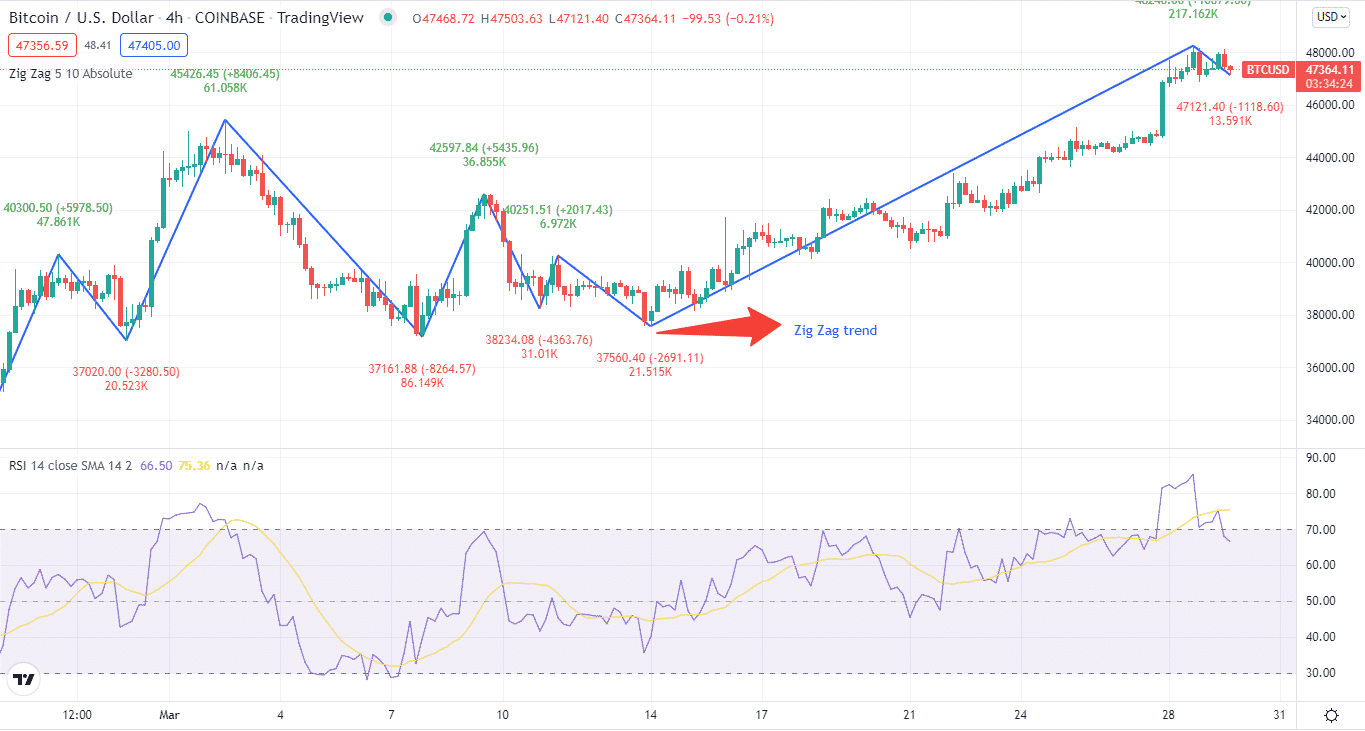
Suppose the line does not reach the indicator’s % setting and the crypto’s price reverses direction. In that case, it is deleted and replaced with an extended Zig Zag line in the trend’s original direction.
How to avoid the mistake?
When we minimize these parameters, the indicator becomes more sensitive, giving us more and more zags or zigs that it uses in the tool.
Tip 2. Choosing starting point
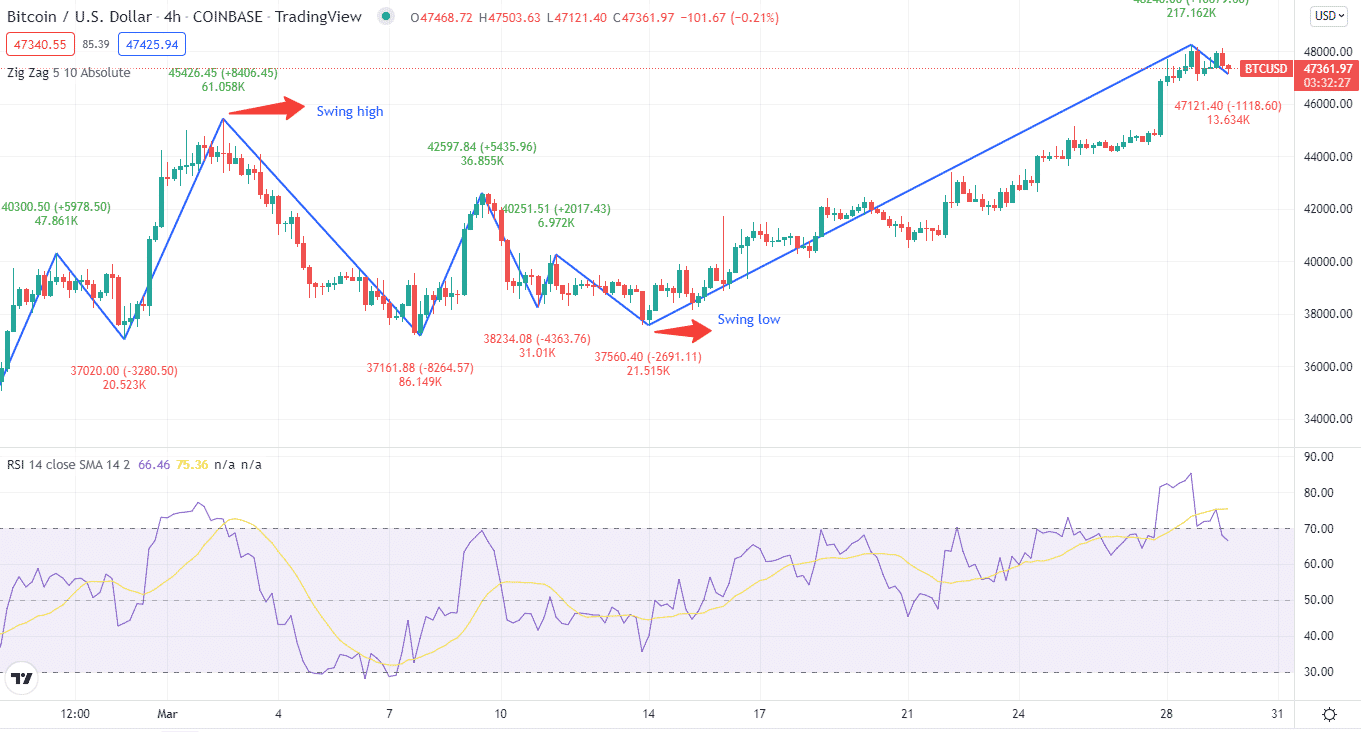
We want to ensure that the Zig Zag tool only displays the market’s most significant swing high and swing low points. So the first step is drawing the latest or the most recent swing high and low. These highs and lows in some situations it does give us some indication of a price reversal. Unfortunately, however, that price reversal often comes to us late.
Why does it happen?
When a higher proportion of price movements (deviation), such as 10%, is used, it guarantees that only price swings of 10% or greater are represented in the chart. This eliminates market swings, providing an analyst with a complete view of what’s going on in the market.
How to avoid the mistake?
It’s recommended to use the strategy on high time frames to reduce the impact of false breakouts. To correctly represent market fluctuations, we must utilize at least 20 periods for the depth and a 5% deviation.
Tip 3. Using backtesting strategy
The trader needs to use an expert advisor to ensure that the trades are placed according to the strategy rules.
Why does it happen?
The setup requires an expert advisor designed according to the Zig Zag breakout strategy to backtest a strategy. In addition, it comes with different features and options.
Backtesting strategy takes some time, especially if you are using the open price or control point methods, as the trading software creates many objects and keeps on adjusting the take profit and stop-loss levels.
How to avoid the mistake?
You can download the database before starting the backtest to overcome this challenge. This will also help you increase the modeling quality.
Tip 4. Evaluate profitability potential
While you are trading, what if you lose everything all at once? This is a major issue. Trading cryptocurrencies has never been accessible, but you can better optimize rates and decrease your risk by utilizing the Zig Zag indicator.
Why does it happen?
After a large loss, many issues can occur, such as getting out of trades too quickly, holding them too long, skipping trades out of fear of losing, or getting into more trades than you should get some winning trades.
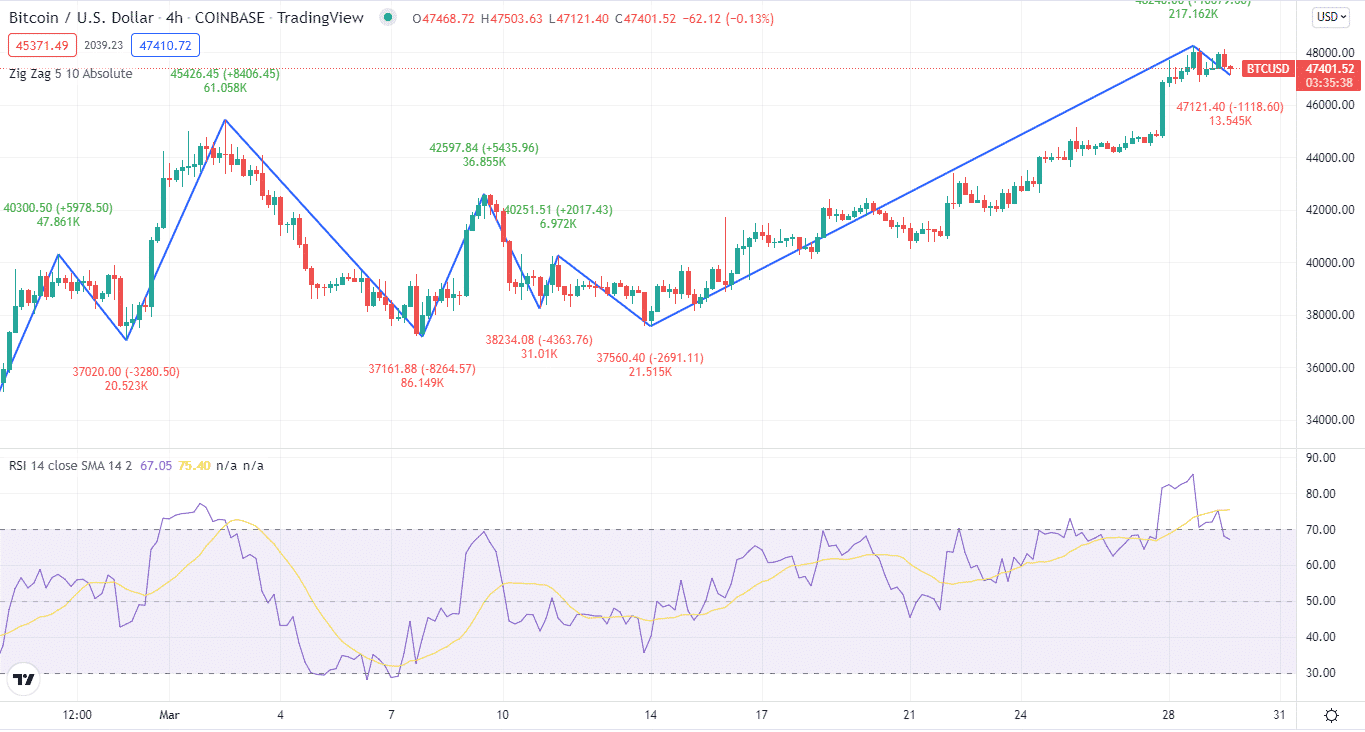
How to avoid the mistake?
The optimization process to evaluate the profitability potential of this trading method. For this make profit and stop-loss levels are completely different in the settings.
Tip 5. Using the Zig Zag indicator without RSI
The indicator’s primary function is to identify market trends and filter out extra noise. But this does not tell us future prices.
Why does it happen?
Zig Zag doesn’t perform well in choppy sideways markets. This is because it doesn’t take into account other technical factors.
The biggest disadvantage of trading using Zig Zag patterns is that it might be difficult to discern whether you are in an upward or negative trend.
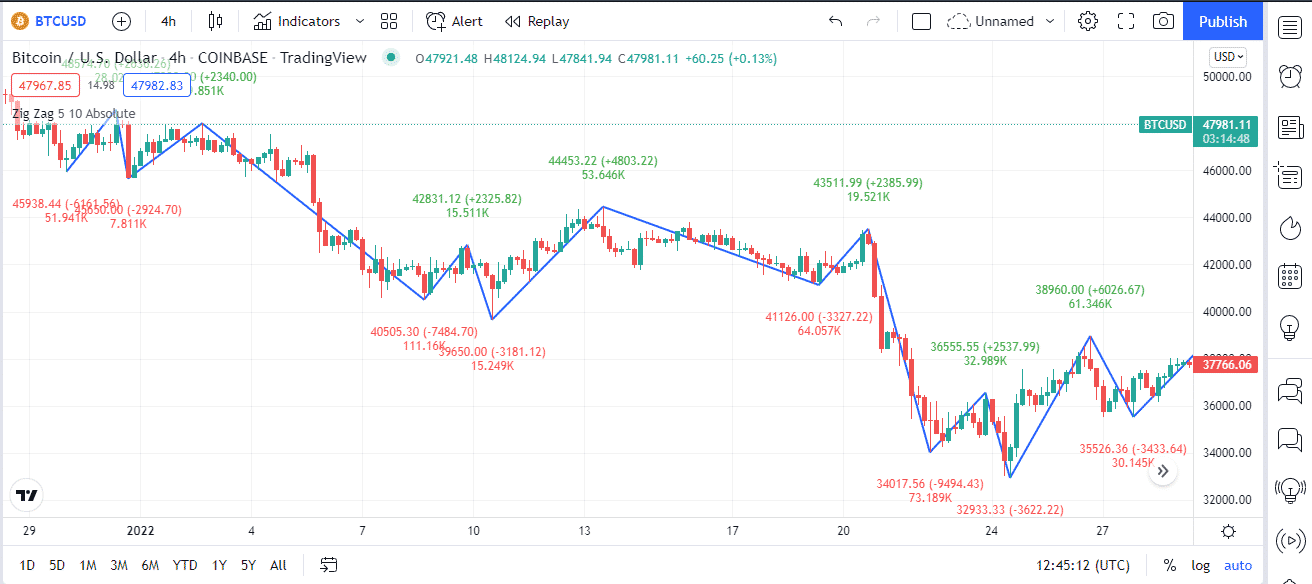
If Bitcoin or other cryptos are trending sideways, a trader must rely on other signs to determine whether Bitcoin will rise or fall.
How to avoid the mistake?
Combining the Zig Zag indication with the RSI indicator can filter out even more market noise. Moreover, as a momentum trend indicator, the RSI will aid us in detecting overbought and oversold levels in the market.
Final thoughts
The indicator is one of the most prominent chart interpretation and analysis tools. The Zig Zag is a signal that many people are unaware of. Nonetheless, it is an indication that may be beneficial to you as a trader. However, you must also understand how to utilize it with other indications.


