Technical traders read price action to trade the financial markets. However, there are various flavors of price action. You may use line studies such as horizontal and trend lines to find trading opportunities. A combination of these lines may produce common price patterns such as head and shoulders, trend channels, double top, double bottom, etc.
There are other types of price patterns not familiar to traders. While many market participants slowly adopt harmonic trading, not everyone can harness the power of harmonic patterns. The three-drive pattern is a powerful but underutilized price pattern.
Let’s learn some practical ways to trade it.
What is a three-drive pattern?
It is among the harmonic patterns pioneered by Scott Carney in one of his books about harmonic trading. Although not as familiar as classical chart patterns, the harmonic patterns, particularly the three-drive pattern, often occur in any pair and time frame of the FX market.
It consists of three drives in the trend direction, and the market participants are looking to trade in the opposite direction. Along with the three drives are three corrections. Therefore, this pattern contains six swings in total. Because of this, you can use a wedge or trend channel around the pattern to track its movement.
How to identify three-drive patterns?
It is straightforward to identify such patterns on your chart. You might struggle a bit in the beginning. However, once your eyes become familiar with the pattern, you will see it immediately while scouring your charts or when you go about your day looking for trade entries.
However, not all chart formations made up of three lunges are valid three-drive patterns. They are a unique formation that you must qualify using some rules of thumb. In many articles online, authors often specify specific Fibonacci numbers to the swings making up the pattern. Even Scott Carney himself suggests the measurement of the swings using the Fibonacci tool.
In this article, you will not see a chart example with Fibonacci numbers in them. This author humbly believes these measurements do not matter at all. What is important is the pattern itself.
To define a valid three-drive pattern, you can use the following rules:
- The three drives should form in quick succession. The whole pattern itself should complete quickly in a specific area of the chart.
- It should be obvious even without the use of trend lines.
- The swings should look symmetric. There is no need for measurements.

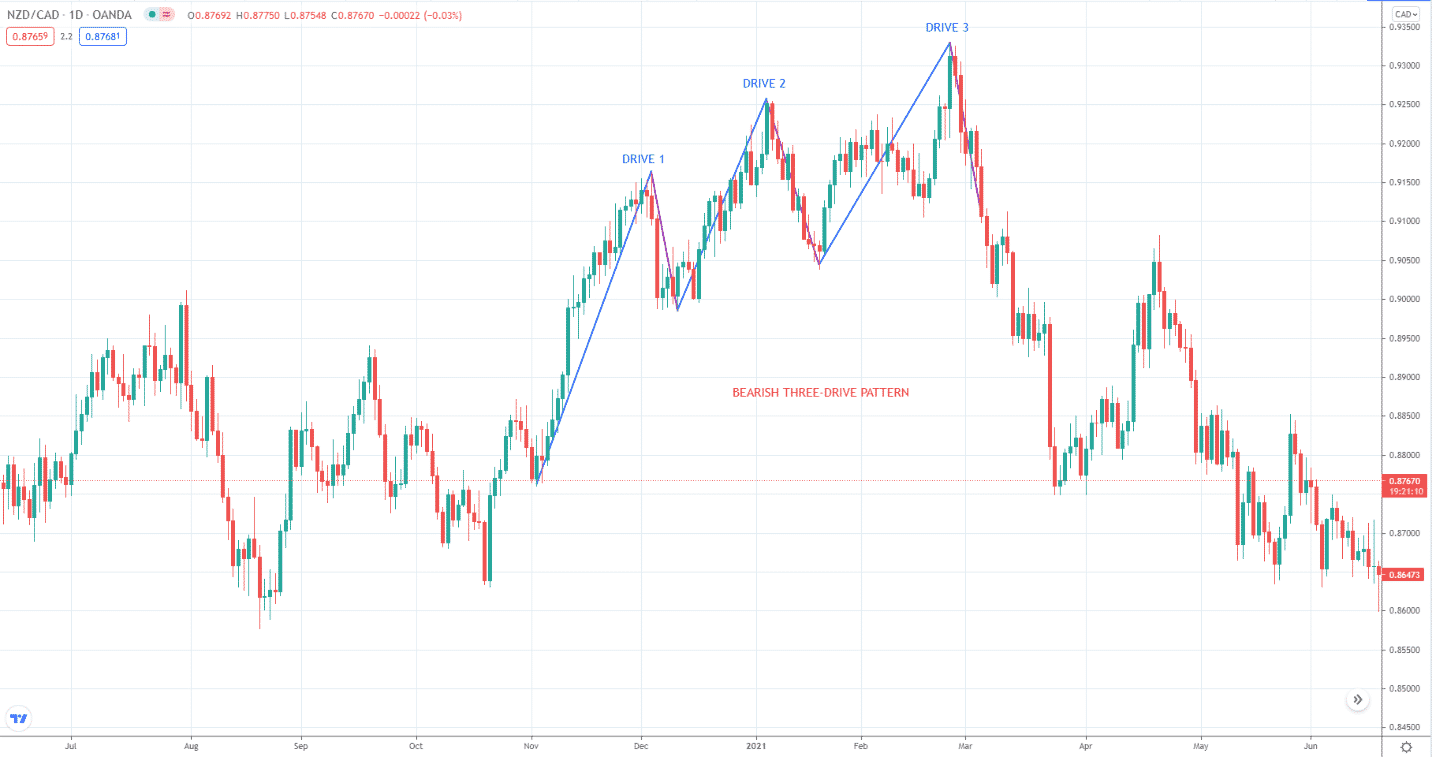
Refer to the above NZD/CAD daily chart. You can see there a bearish three-drive pattern as it forms at the end of an uptrend. This pattern suggests that the market is likely exhausted and is ready to reverse downward. If the pattern forms at the end of a downtrend, it is a bullish pattern.
Please note that this pattern type is always formed at the end of a trend in the context of a trending market.
Best ways to trade the three-drive pattern
There are three scenarios or contexts that improve the probability of success when trading the three-drive pattern. As hinted above, not all three-drive patterns are the same.
You must-have criteria to qualify ideal setups, such as the following:
- Pattern converts into a wedge.
- Pattern forms in the middle of a trend as a pullback entry signal.
- Three-drive pattern with accompanying divergence.
№ 1. The three-drive pattern forms a wedge
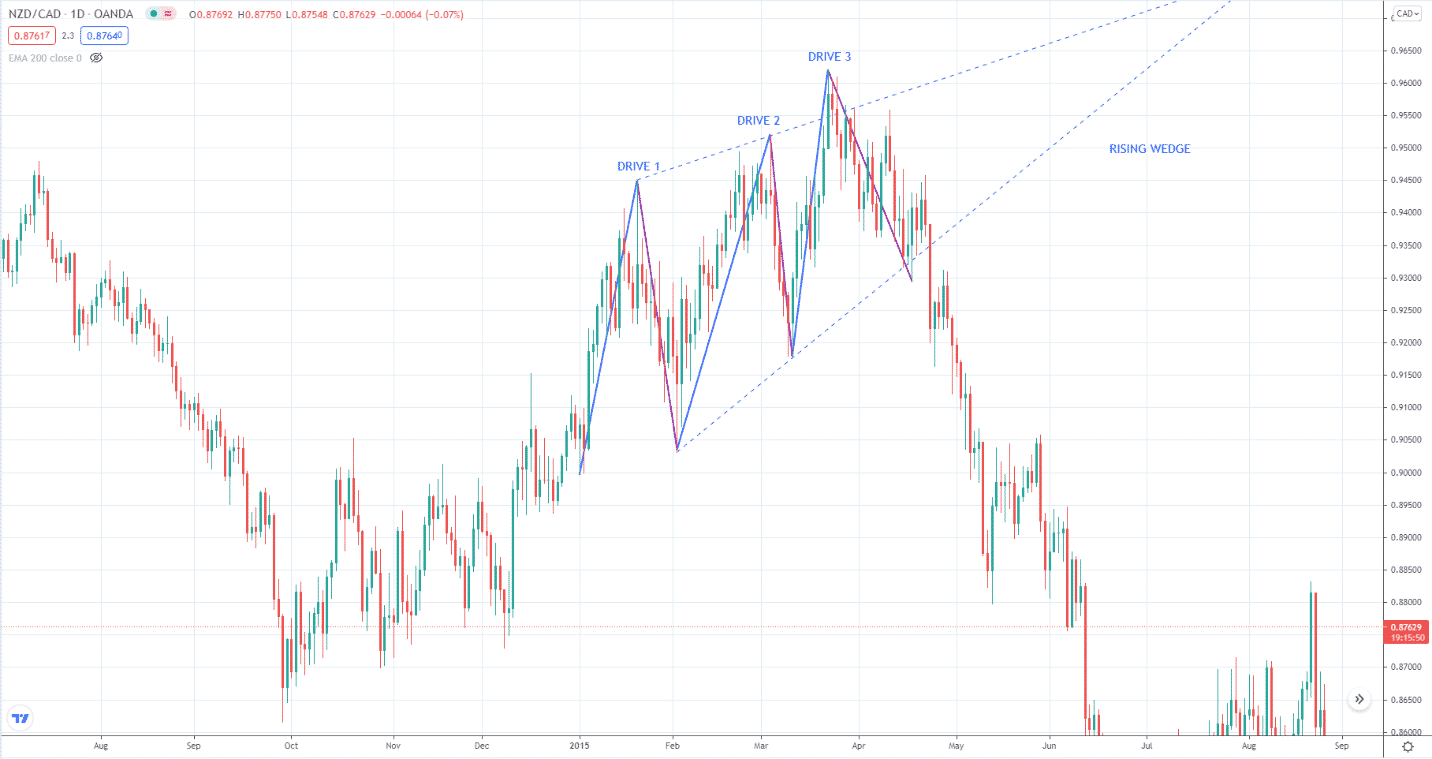
When a three-drive pattern turns into a wedge, the reversal signal becomes even more powerful. Please take note that the wedge is already a powerful reversal pattern in itself. As the three-drive pattern forms, you can use a trend channel to mark the upper and lower boundaries. Things begin to change after the pattern fixes the corrective swing after the second drive. At this point, you can tell that you do not see a trend channel but a wedge.

See the rising wedge in the NZD/CAD daily chart below, which formed at the top of an upswing. Note that the inner trend line has a steeper angle than the outer trend line. That is the distinguishing feature of a wedge. After a failed breakout in the third drive, the price went inside the three-drive pattern and broke below the inner trend line. The sell-off that ensued was very powerful.
№ 2. Three-drive pattern as pullback entry
A three-drive pattern can form in the middle of a trend. Therefore, you can add this pattern to your list of patterns that can form when the market makes a pullback. Trading this pattern in the context of a trend is one of the ideal setups you can find. This situation does not happen very often, but you cannot pass up or miss it.

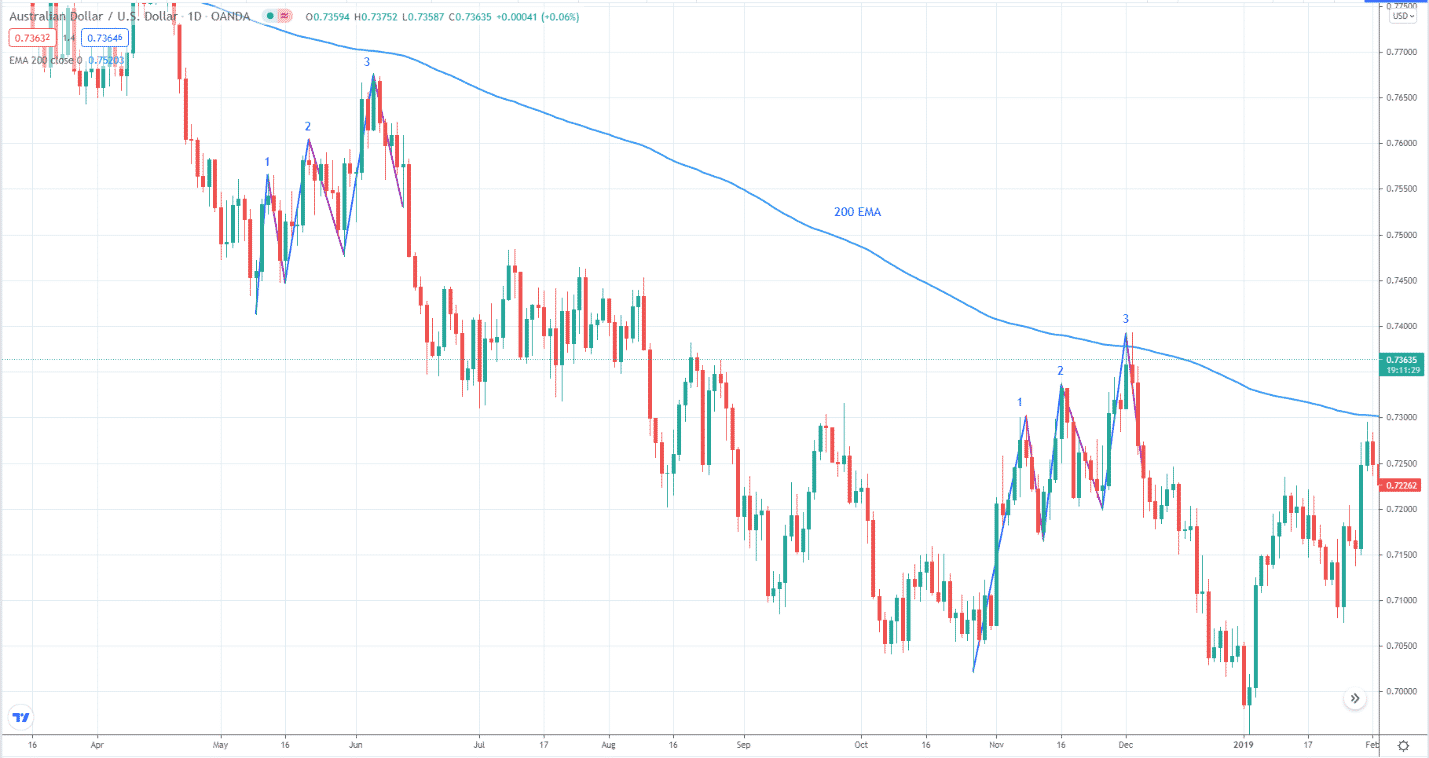
You can find two bearish three-drive patterns in the daily AUD/USD chart below. As you can see, the 200 EMA tells you that the primary trend is down. Finding a bearish setup in a bearish market is a golden opportunity that comes once in a while. Look at how the trend continues that occurred after the completion of the two three-drive setups below.
№ 3. Three-drive pattern with divergence
Divergence is a trading signal you can take without confirmation from other tools and still expect a high degree of success. Of course, not all types of divergence will play out, and the market may react differently to each type of divergence.
The best divergence signals have the following attributes:
- Divergence occurs on a higher time frame such as H4, daily, or weekly.
- The divergence formation is big enough and very obvious to see.
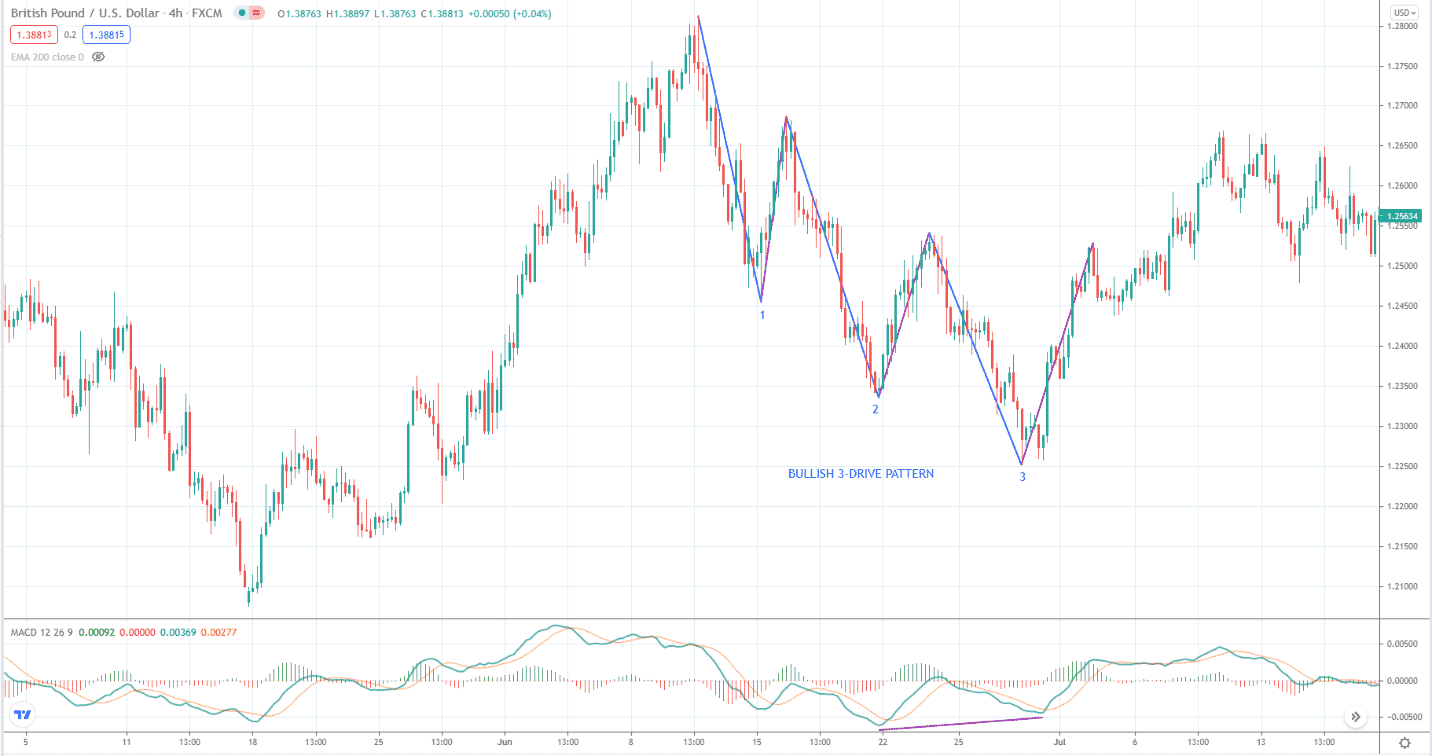
When you see divergence on the last two drives of the three-drive pattern, that adds weight to the viability of the trading setup. Also, it is not uncommon to see a divergence from the first drive to the second drive to the third drive.

Consider the GBP/USD H4 chart above. Here you can see a significant bullish MACD divergence on the last two drives of the pattern. As a result, the price rallied strongly after the reversal. Scour your charts, and you will see that divergence often forms in concert with a three-drive pattern.
Final thoughts
The only challenge in trading the three-drive pattern is the entry timing. Generally, you can enter the trade when the price breaks the inner trend line in the reverse trend direction. However, you may realize later that this entry is relatively delayed. To do it right, you might need to do hand testing and explore various options.


