Exponential moving averages (EMAs) are one of the most traditional technical indicators. It’s merely a method of smoothing out price swings to assist you in differentiating between ordinary market “noise” and the proper trend direction.
But why not simply glance at the pricing to discover what’s going on? The reason for MA utilizing rather than merely looking at the price is that the trends don’t move in a straight line.
If you are new to trading and want to learn EMA’s best trading strategy, you can land in the right place.
What is the exponential moving average?
One of the most widely used forex trading tools is the EMA. FX and crypto traders use the EMA tool on their charts to establish trade entry and exit points based on where the price action is on the EMA. If it is high, the trader may contemplate short selling; if it is low, the trader may consider a buy.
Speaking about the EMA indicator, it’s an average price calculation over a certain period that applies more weight to the most current price data, causing it to react faster to price change.
The following formula is used to compute the weighting multiplier:
EMA(current) = ((price(current) – EMA(prev) ) x multiplier) + EMA(prev)
The top five EMA trading strategies
Following that, we will go over five trading methods for day trading utilizing the EMA. Let’s also discuss the difficulties you’ll have when using the indication.
Tip 1. Plot on your chart the 20 and 50 EMA
Properly align our moving averages on our charts. We can afterward identify the EMA crossover. The EMA approach makes use of the 20- and 50-period EMAs.
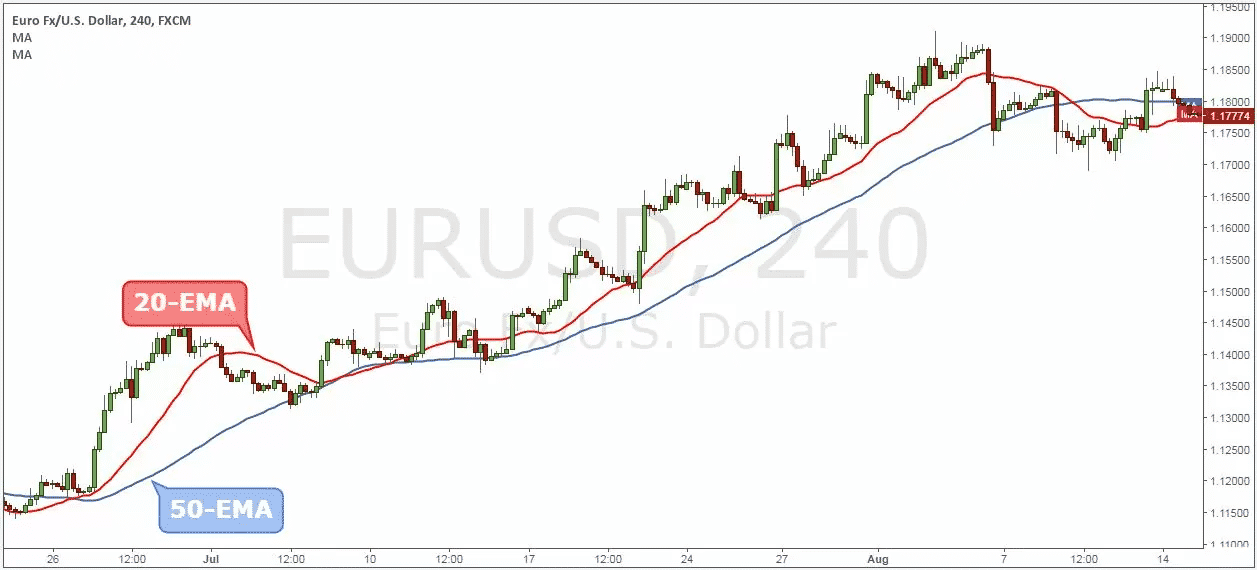
The majority of common trading systems provide MA indicators by default. It should be straightforward to locate the EMA on either your MT4 or Tradingview software.
Now, we’re going to take a closer look at the price structure. This moves us to the strategy’s next stage.
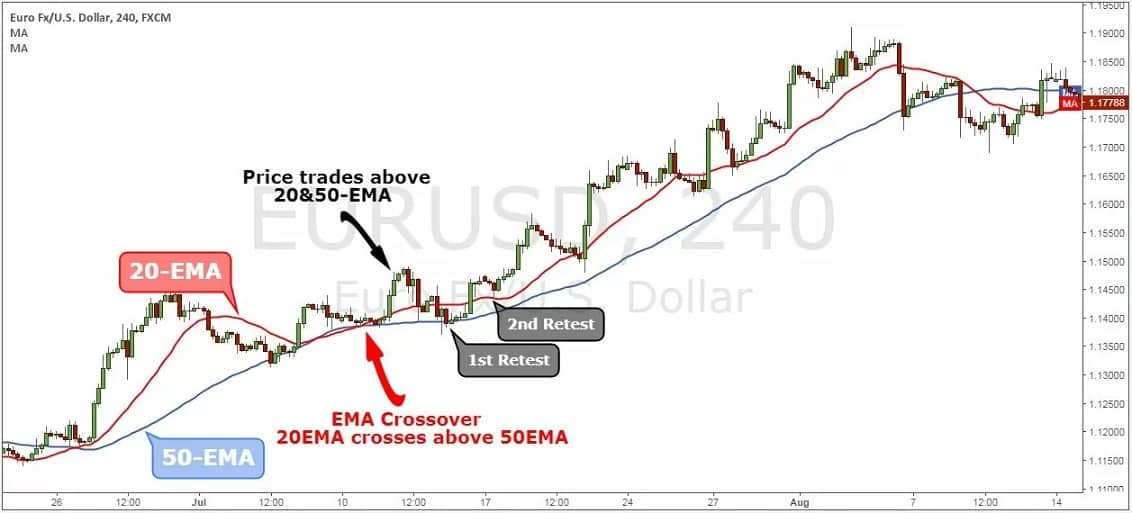
Once the asset’s price closes over the 20 and 50-day EMA, it demonstrates a bullish bias in the market. However, it’s better to wait for candlesticks to test the EMA lines two times before taking a buy trade.
Why does it happen?
The EMA lines are calculated based on historical prices. These lines exhibit where the asset price should be as per historical price data. If the price of an asset is above the EMA lines, it demonstrates that the bullish bias is stronger in the market. Alternatively, if the prices of an asset are below the EMA lines, it means the asset is under selling pressure.
How to avoid the mistake?
It’s very crucial to follow the EMA rules strictly. You need to ensure that the asset is closing candles above 20 and 50 EMA and that it has also tested the EMA lines before entering the trade.
Tip 2. Producing a buy signal
On the chart below, we’ve plotted a blue 13-period EMA and a red 21-period EMA on a 5-minute chart of gold (XAU/USD).
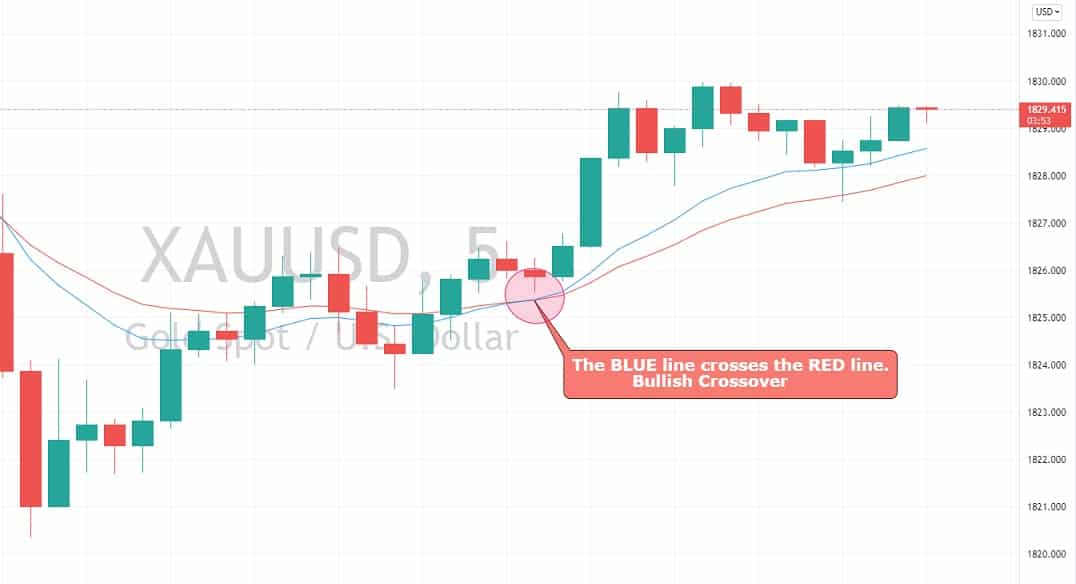
As you can see, as the blue line crossed over the red line on the far left, the price quickly gained bullish momentum and began to go upward. If you had captured a buy trade at a crossover level of $1,823 and exited at $1,829, you could easily have earned a $600 profit per lot.
Why does it happen?
A saying that trend is your friend, whereas a bullish EMA crosser exhibits a bullish trend. Therefore, it’s crucial to take only a buy position in that scenario.
How to avoid the mistake?
Please keep in mind that you will not earn from simply observing averages cross. Additional indicators and chart patterns will need to be added to the mix to create a winning combination. The purpose of this method is to demonstrate how the EMA can be used to trigger buy signals.
Tip 3. Producing a sell signal
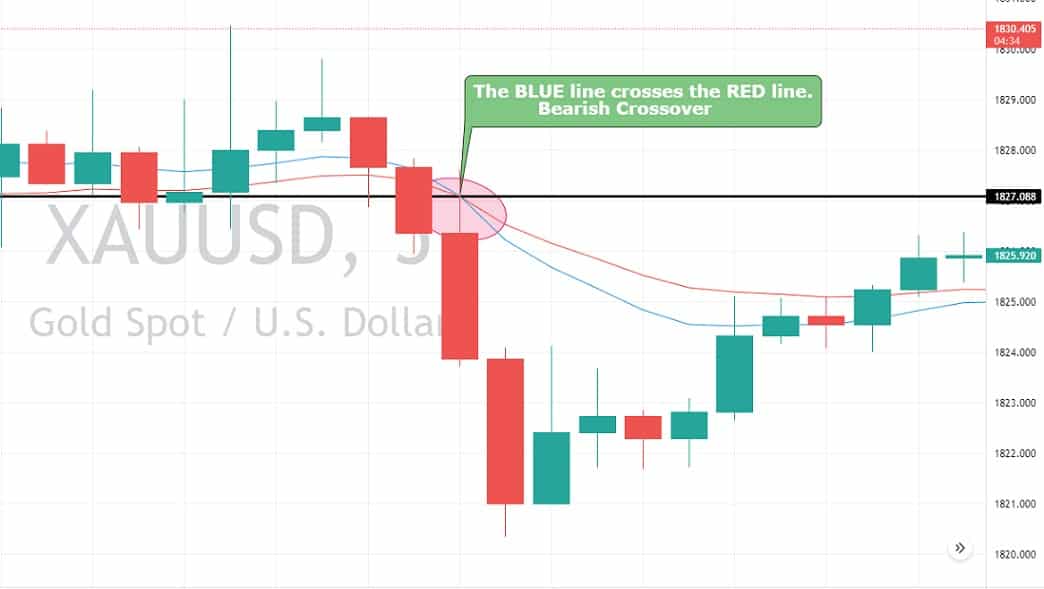
Producing a sell signal is exactly the opposite of producing a buy signal. As the blue line crossed below the red line on the far left, the price quickly gained bearish momentum and began to go downward. If you had captured a sell trade at a crossover level of $1,822 and exited at $1,820, you could easily have earned a $200 profit per lot.
Why does it happen?
When a blue line (13 EMA) crosses the green line (21 EMA) from upside to downside, it signals a selling trend in the asset. Therefore, it’s crucial to open a trade following the trend.
How to avoid the mistake?
Sometimes, these EMAs can be misleading. We need to combine the EMAs with additional indicators to ensure that we are entering the correct trend. Thus, the more indicators we use, the better it will be.
Tip 4. EMA and RSI combined
Advanced traders combine their EMA strategy with different leading indicators such as the RSI. Therefore, it’s crucial to open trades only when both indicators, RSI and EMA, support the sell/buy trades.
To open a sell trade, the current market price of gold needs to be below the EMA lines, but that’s not enough. We also need to make sure that the RSI line has also crossed below the 50 level. Once both conditions are met, we can take a sell trade in gold.
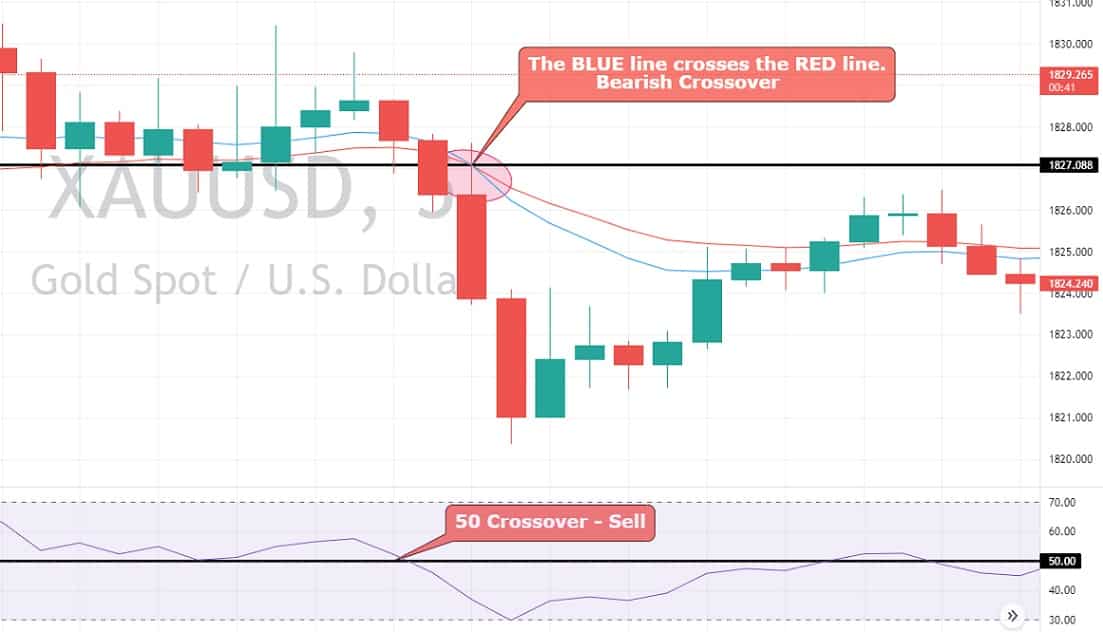
Why does it happen?
Combining the RSI with the EMA strategy offers additional confirmation of the trend. Thus, you can make better trades, and it helps improve efficiency.
How to avoid the mistake?
To open a trade, it’s essential to confirm that both indicators suggest the same trend. If one indicator suggests a sell trade, while the other supports buying trade, you should stay out of the market.
Tip 5. Hybrid of EMA and Parabolic SAR
The hybrid of EMA and Parabolic SAR also makes a lovely combo. To use this strategy, you need to follow two rules:
- Open a sell trade if there’s an EMA crossover.
- Open a sell trade if the Parabolic SAR has formed three black dots above the candlesticks.
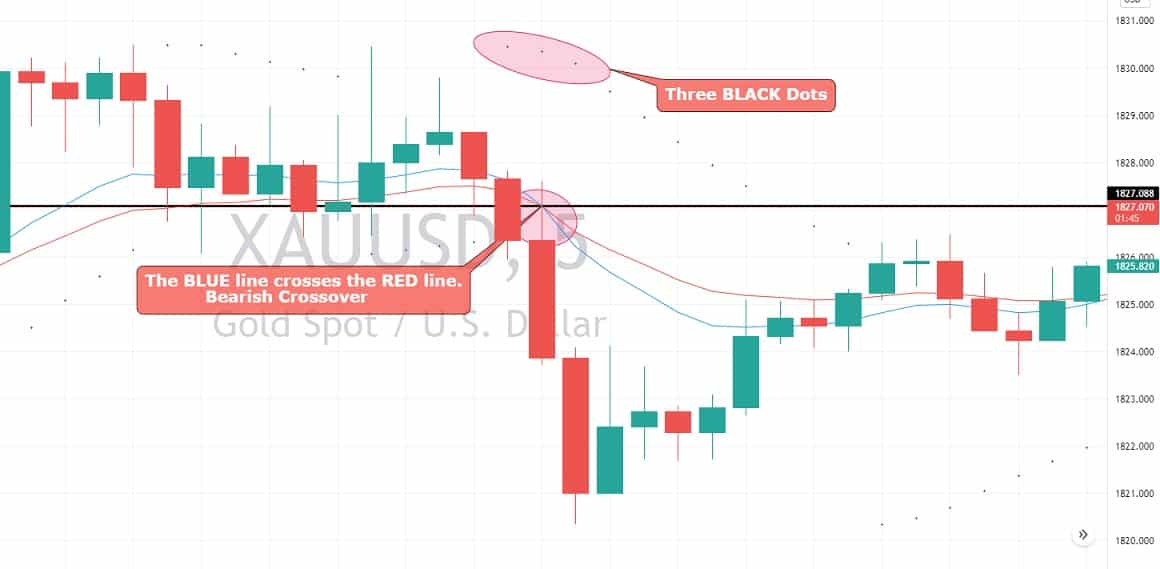
Why does it happen?
Combining the RSI with the Parabolic SAR offers confirmation of a trend reversal. The Parabolic SAR‘s stands for:
S = Stop
A = And
R= Reverse
It means traders shouldn’t open any new trades if the Parabolic SAR forms a first dot above or below the candlesticks. Don’t do anything on the second dot, but you can open a trade on the third dot.
How to avoid the mistake?
You should open trades only if both the EMA and the Parabolic SAR suggest the same price action.
Final thoughts
Being a traditional indicator, hundreds of traders use the EMA today. Day traders use this technical indicator to determine the trend, direction, and strength of a chart. Others use it to figure out where to enter and exit.
In simple words, traders often use it to determine trade entry and exit points based on where price movement appears on their trading charts. If it is low, the trader may consider buying, and if it is high, the trader may consider selling or short-selling.


