Traders have been arguing over which is better, EMA or SMA. While the first one is an exponential type, the second one is a simple type. If you think moving averages are useless as they have given you numerous false signals in the past, reconsider this stance. Many traders, big and small, in various markets use one such tool in their trading.
You can look at any chart and quickly figure out the trend by analyzing price movement from left to right. You can save time doing this analysis by plotting a moving average. At a glance, you can tell if a market is trending and how strong the trend is. That is why even traders who trade pure price action have this tool in their arsenal.
Because of the large number of moving averages, you might be wondering which one is best. You might have the same question for the SMA versus EMA argument. To know which one is better, you need to understand each in more depth.
What is SMA?
SMA refers to the mean price of an asset over a specific number of bars or candles. The qualifier “moving” in the term SMA gives an idea that the value is dynamic. That is why the indicator prints a squiggly line rather than a straight line.
SMA is the most straightforward moving average, and it is the easiest to calculate. To get the SMA of the last 20 bars, add the prices of the last 20 bars and divide by 20. As a lagging indicator, an SMA depicts the current and previous trend, but it cannot predict what will happen in the future.
What is EMA?
EMA is an improved version of the SMA. While SMA is a pure average of prices, an EMA affords recent values more credence. That is why it reacts more quickly to price fluctuations than SMA. Because of this, the EMA gives out a signal of trend reversal sooner than an SMA does. Still, the EMA is a lagging indicator. It shows the current trend by looking at the recent past, but it cannot look into the future.
SMA vs EMA: which is better?
Which one is better then? Be aware that no one moving average is better than another. Each moving average comes into existence to fulfill a certain purpose. An SMA has a different use from the EMA, but there are times when the two averages complement each other. You can learn about this in the next section. For now, let us compare the two moving averages.
| Type | Description | Upside | Downside |
| Simple | Represents the pure average price of a specific number of bars | Filters market noise and gives the accurate market picture | Your entries could be late because the moving average reacts slowly. |
| Exponential | Puts more importance on recent market data | Reacts quickly to price action, allowing you to enter trades sooner than later | The moving average line could get skewed during volatile market conditions, giving you false entries. |
Trade examples
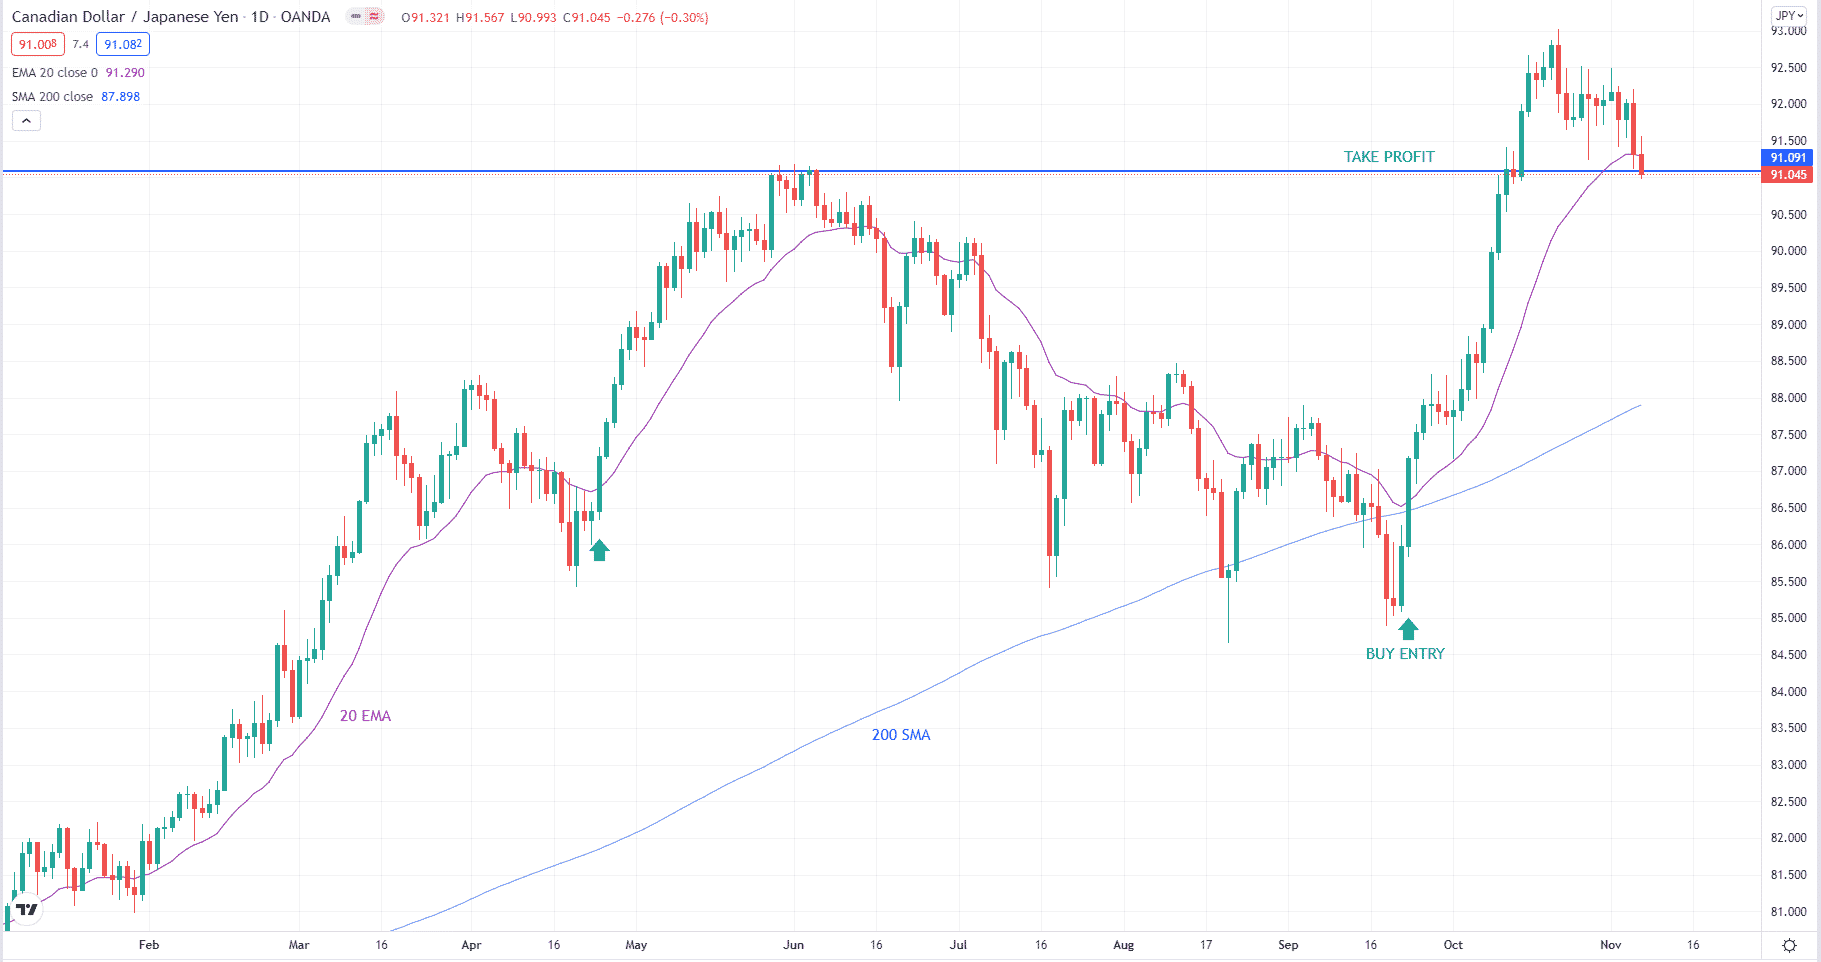
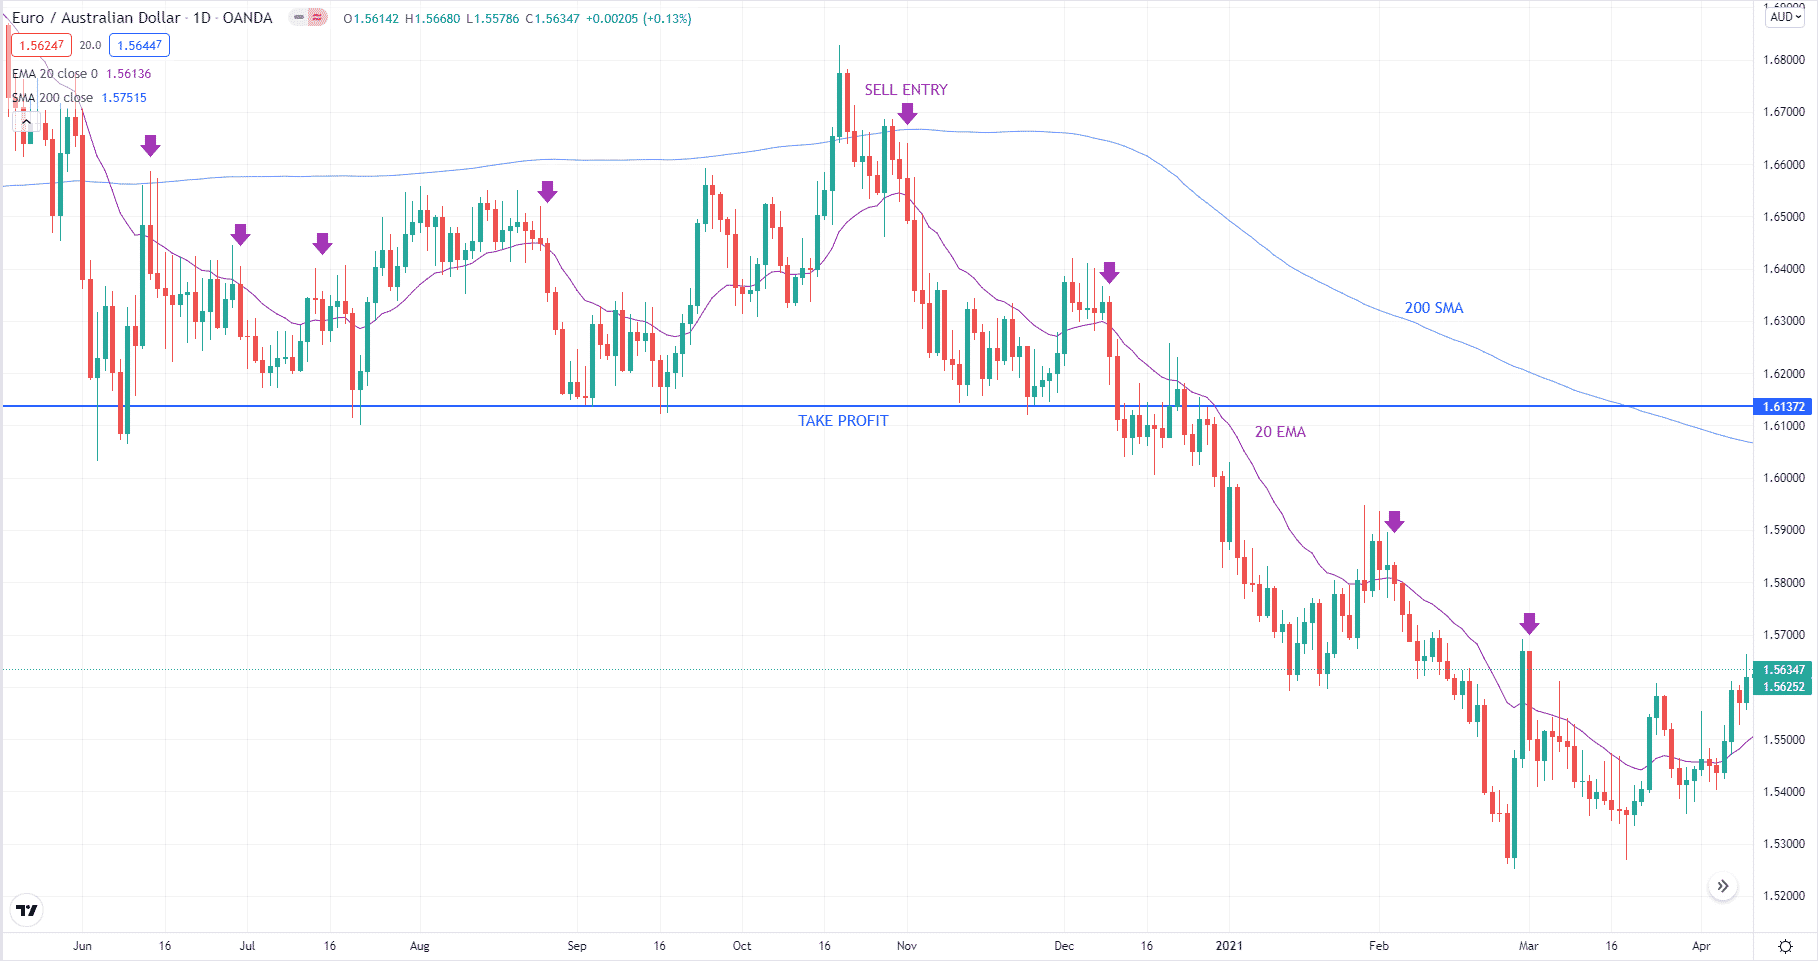
A moving-average combination that traders commonly use in many markets is the 20 EMA and 200 SMA. 200 SMA keeps the trader-oriented with the long-term trend while the 20 EMA gives him plenty of trading opportunities. It is straightforward to trade with this moving-average duo. The idea is to enter when the direction and momentum are aligned.
Bullish trade setup

Let us take the above chart for illustration. The 200 SMA defines the direction, which means the direction is up.
Then the 20 EMA defines the momentum, which is down when a bearish candle crosses the 20 EMA from above and closes below it. We will not take this trade because the direction and momentum are not in sync. The momentum is up when a bullish candle crosses the 20 EMA from below and closes above it. That is our trade entry.
There are two such situations in the chart above. We will consider the second entry. When a bullish candle breaks and closes above the 20 EMA, we can open a buy trade. Then we will target the most recent peak to the left of the entry point. You can put the stop loss on the most recent swing low a few candles back from entry.
Bearish trade setup

Let us use the above chart to illustrate a sell entry. Since the price is moving down and 200 SMA is above it, the direction is down. Therefore, we will wait for the 20 EMA to give downward momentum before taking a sell trade. There are multiple such opportunities indicated on the chart. We will discuss one sell entry as marked above.
When a bearish candle breaks and closes below the 20 EMA, we can open a sell trade. We can put the stop loss at a recent swing high three candles back from our sell entry. Then we can target the most recent valley to the left of our entry. Refer to the blue horizontal line.
How to manage risks?
Trading involves risks that traders must mitigate to become profitable. One such risk is picking the wrong trade direction. Even when moving averages are helpful tools to find entries, you can get plenty of wrong signals. This is the problem with lagging indicators.
Moving averages portray the current and past market conditions, but they cannot predict the future. To protect your account from total erosion, you can do two things. First, put a stop loss in every trade to define the trade risk. Second, aim for a bigger target than the risk.
Final thoughts
Despite the debatable efficacy, moving averages are still widely used by many traders. You need only one such indicator on your chart to judge the trend easily. If you like, you can use the SMA-EMA combo presented above in your trading. Many successful traders are using this duo as their primary tools in finding high-probability trades.


