ENA crypto cross indicator involves using the moving average crossover concept in a unique way to generate potentially profitable trade ideas. Crypto investors usually use this indicator to determine the current trend, trend directions, trend switching points, etc. When you can use this indicator more effectively, it allows you to catch lots of profitable trades.
However, implementing successful trade setups using any trading indicator requires learning the components and effective procedures. This article will introduce you to the ENA crypto cross indicator and the top five tips to understand and verify it.
What is the ENA crypto cross indicator?
It is a unique indicator that uses different MAs of different parameters to obtain the market context. This indicator contains four moving averages; three of them are simple moving averages:
- SMA 21 (green)
- SMA 50 (maroon)
- SMA 200 (orange)
Meanwhile, it uses another type of MA, EMA 144 (aqua), and three crossovers:
- Golden cross
- Death cross
- Silver cross
Silver cross
SMA 21 crosses above the SMA 50 occurs when the price initiates a bullish momentum.
SMA 50 crosses above the SMA 200, occurs when the price is already on an uptrend.
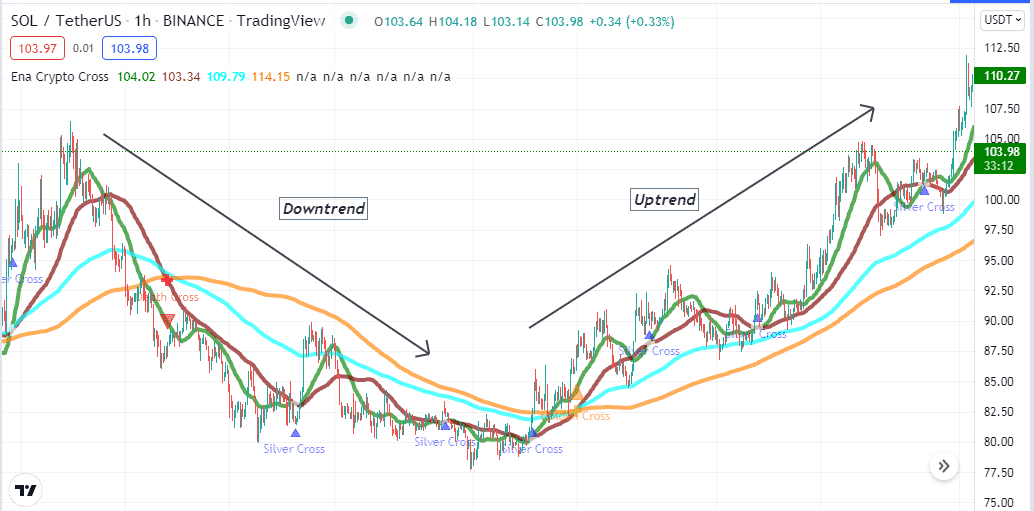
When the opposite of the silver cross occurs, the price may enter a downtrend. Meanwhile, the death cross declares the price already remains in a declining phase.
Top five tips to understand and verify ENA crypto cross indicator
When using the ENA crypto cross indicator, it is mandatory to follow some specific guidelines to generate efficient results.
Tip 1. When entering a buy trade
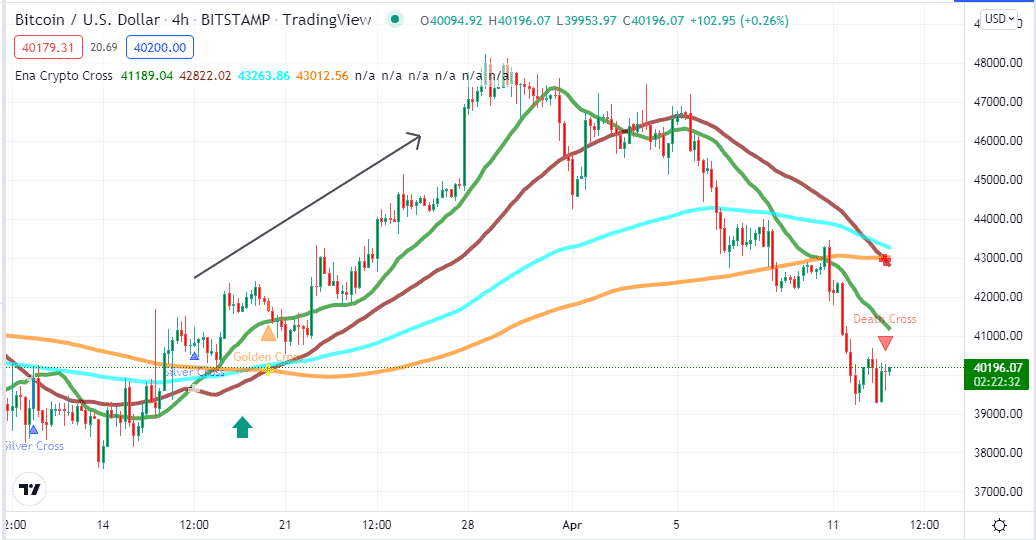
While entering a buy trade, investors have to check two crossovers.
- First, when the price faces bullish pressure, the ENA crypto cross indicator creates a silver cross.
- Then the Golden cross confirms that the price is facing sufficient buy pressure and that the current bullish trend will continue for a particular period.
Why does it happen?
It happens for the MA crossover concept. The silver crossover involves a crossover between the SMA 21 and SMA 50 lines. When the shorter period SMA crosses above any SMA of the more extended period, it declares buyers domination.
How to avoid mistakes?
Check the readings carefully and better enter the buy trade when the price reaches above the EMA 144 (aqua) line. Moreover, checking on upper time frame charts to confirm the trend direction is common among financial investors who use the ENA crypto cross indicator.
Tip 2. When entering a sell trade
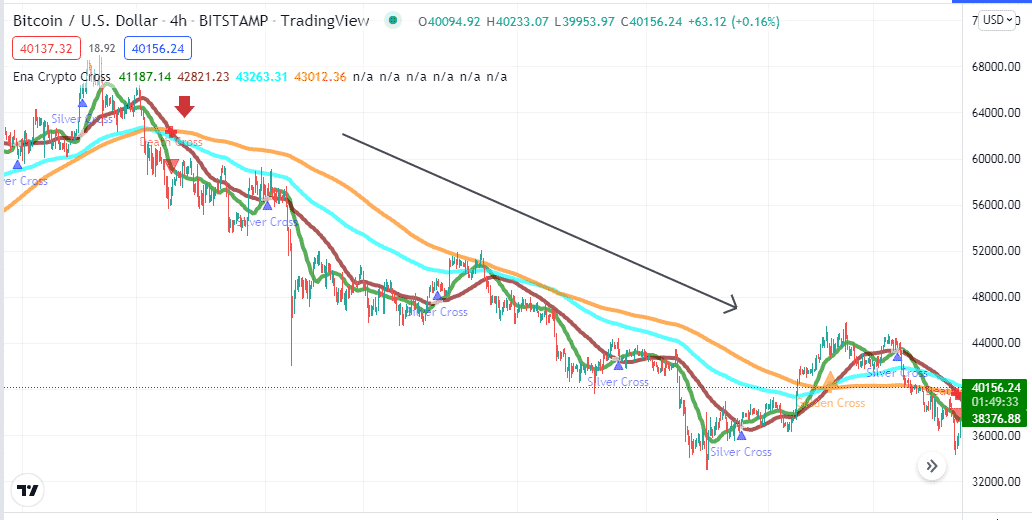
The ENA crypto cross indicator also generates fine sell trade ideas. When entering sell trade using this indicator, you may seek the exact opposite scenario as the bullish setup. The green SMA reaching below the maroon SMA line declares initiation of bearish momentum. When the maroon SMA gets below the orange (a death cross), it indicates the price is facing sufficient declining pressure. The current bearish trend may continue further until the sellers keep dominating the market.
How does it happen?
It happens as the popular MA crossover concept suggests. During the shorter periods, MA crosses below the MA of the more extended period declaring bearish pressure on the asset price.
How to avoid mistakes?
Check the readings carefully, conduct multi-time frame analysis, and better enter when the price reaches below the aqua EMA line.
Tip 3. Determining sideways
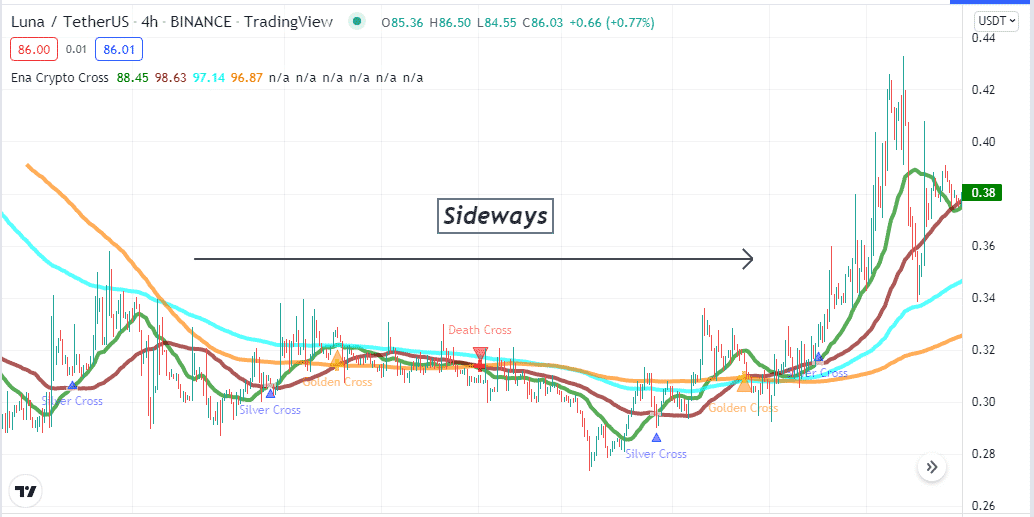
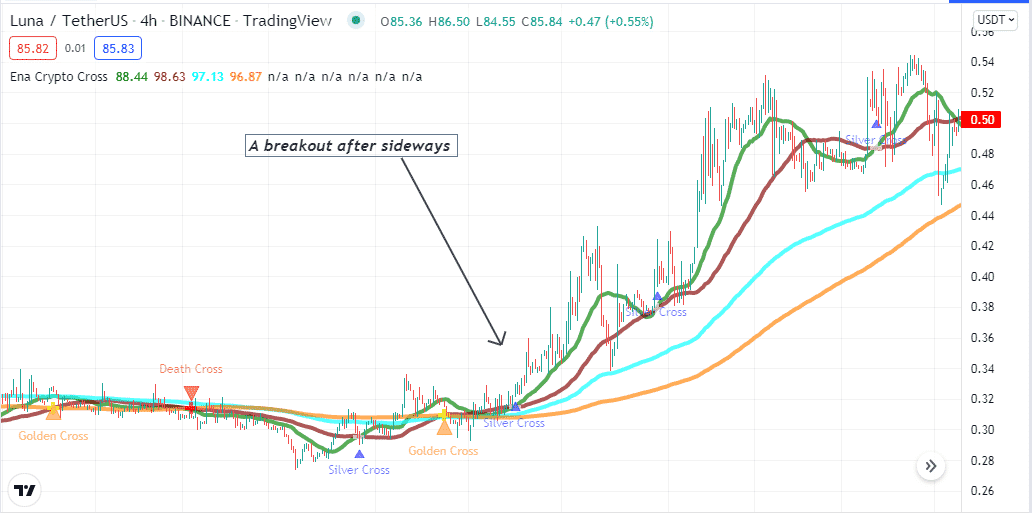
This technical indicator is an effective tool to determine sideways. When the dynamic signal lines of the ENA crypto cross indicator remain closer, the price is consolidating or sideways. In this phase, the crossovers will frequently confuse the future price movement.
How does it occur?
The price continues sideways so that the crossovers will frequently occur, declaring indecisions or confusion among investors. It usually occurs due to less volatility as participants are out or not interested in entering trades at the current moment.
How to avoid mistakes?
It is better not to enter trades using the ENA crypto cross indicator in sideways market movement as it only reflects the confusion and doesn’t allow making significant profits.
Tip 4. Identifying breakouts
Swing traders always seek breakouts to participate in trades with more potentiality and lesser risks. The ENA crypto cross indicator helps identify breakouts and enter most potential swing trades. Enter swing trade by marking at least three crossovers. For example, two silver crosses and a golden cross declare bullish momentum and a possible breakout above.
Why does it happen?
A breakout usually occurs after sideways, as participants make decisions during that period. For example, a breakout is typical on fiat currencies or forex pairs during major fundamental news releases, such as interest rate decisions, GDP, etc. Before these news releases, usually, the volume decreases, and the price movements get slower.
How to avoid mistakes?
Check the readings carefully, and it is worth checking fundamental info. Moreover, use proper money and trade management concepts when trading breakouts or participating in swing trades.
Tip 5. Use RSI as a supportive indicator
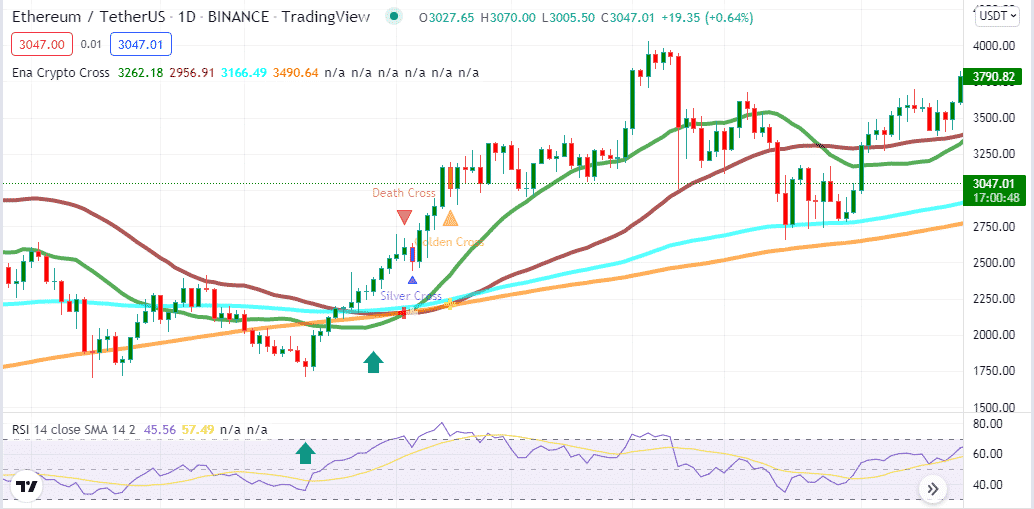
Using the ENA crypto cross indicator, you can use RSI as a supportive indicator when making trade decisions. When the ENA indicator suggests any bullish/bearish momentum, match the info with the RSI indicator before entering any trade. For example, the silver and golden cross occur, declaring a bullish momentum, then checking the RSi dynamic line is above the central line and heading on the upside and vice versa for bearish momentum.
How does it work?
The RSI is a popular momentum indicator; combining readings from both technical indicators enables executions of more potent trades.
How to avoid mistakes?
Match both indicators readings before any trade execution and conduct a multi-timeframe analysis to confirm the current and predict the future direction.
Final thought
Finally, these tips above let you catch the most potent trades using the ENA crypto cross indicator. We suggest following proper trade and money management concepts while using this technical indicator for trade decisions. Following these concepts, you can trade many financial assets, including forex, commodities, stocks, cryptocurrencies, etc.


