It is a prevalent practice among financial traders to make decisions by looking at candlestick patterns. Identifying patterns enables options to make more accurate trading positions and increase profitability.
The engulfing pattern is famous for many traders. It requires some specific skills and learning the logic behind candle formation to master any pattern. In this article, we will introduce all essential info about this multi candle pattern. Moreover, we describe both buying and selling methods using chart examples.
What is the engulfing pattern?
It is a multi candle pattern that requires a minimum of two candles to form. One is a small candle, and the next candle will be bigger than the previous one, exceeding the last range candle.
Firstly the next candle will comprehensively cover the previous candle. You can ignore the wicks, but the prior fact is the body of both candles. You can group it into a reversal type pattern. It has enormous use for financial traders to determine the trend-changing environment or simply reversal points of the financial asset price. You can often find both buy and sell engulfing patterns in financial assets price charts.
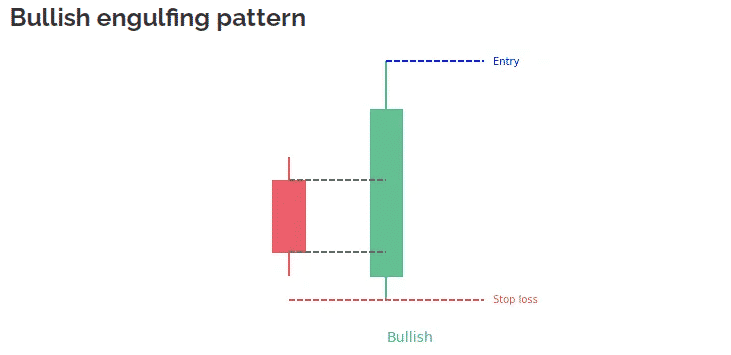
Bullish pattern
This version is the buyer domination pattern that confirms an upper pressure on the asset price. It enables complete potentiality when it forms at the end of a bearish trend. A red candle at the end of the declining movement, then a bullish candlestick starts and closes above the range of the last candle by covering the whole body.

In this candle group, the red candle or bearish candle represents a downside pressure in the price. Then the subsequent day, buyers come up and start to push the price more upside, and the closing price of the next candle is above the previous candle, meaning a buyer’s domination on the asset price.
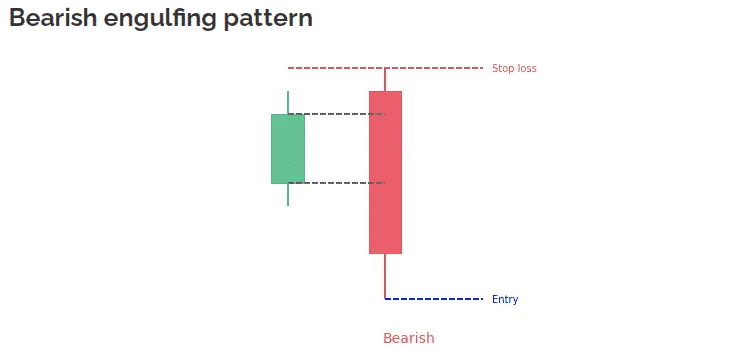
Bearish pattern
It is a seller domination pattern that confirms declining pressure on the asset price. This pattern enables complete potentiality when it forms at the finishing of an uptrend. Think of a bullish candle that does not have a large body within an uptrend. The next candle starts to form, covers the last candle’s body, and closes below the range of the previous bullish candle; then, you can mark it as a sell engulf pattern.

It is a multi candle pattern with a small bullish candlestick, then a large red candle. It means buyers stop buying, or the bull pressures decrease at the green candle. The next day, sellers start to dominate the asset price. The price may start to fall for a certain period.
How to trade?
These patterns are not so complicated to identify. It works fine in support-resistance levels (S&R) as a confirmation of reversals. For best trade setups, seek engulfment at support or resistance zones. This combination will give you the best potentially profitable trading suggestions.
If you want to master a multi candle pattern, you have to achieve some skills of price action traders. Without applying any indicators, nacked chart trading is one of the common characteristics of price action traders.
- First, identify the S&R levels. You can mark historic, weekly, and monthly vital levels such as opening, high, low, or closing price.
- Observe the price movement at any of that particular level as you mark, then make trading positions. You can use this trading method any time frame chart you want, but we recommend using daily charts.
- So you can avoid the fake reversals, swing highs, and lows of the lower time frame charts.
Bullish trade setup
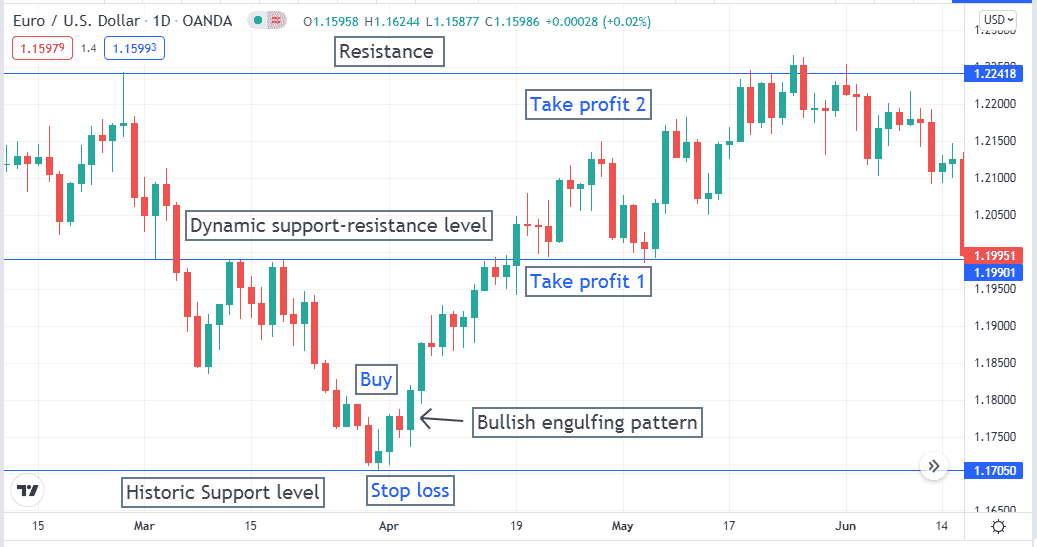
Identify the S&R levels. Be aware when the price comes to any of the support levels that you mark. Observe the price movement at that level and wait until a bullish engulfing pattern forms.

Entry
Enter a buy order after the closing of the current candle; that confirms the bullish engulfing pattern.
Stop loss
It will be below the current support level, where the downtrend ends and the price starts to move upwards.
Take profit
It will be below the next or previous S&R levels. When the price reaches those levels, you can close the trade manually or wait until the price reaches the next resistance level.
Pro tips
If you continue the buy order after the price reaches the first resistance level, we suggest shifting stop loss above or at the breakeven point to reduce risk. You can also collect some profit at those levels and wait for the price to reach the next resistance.
Bearish trade setup
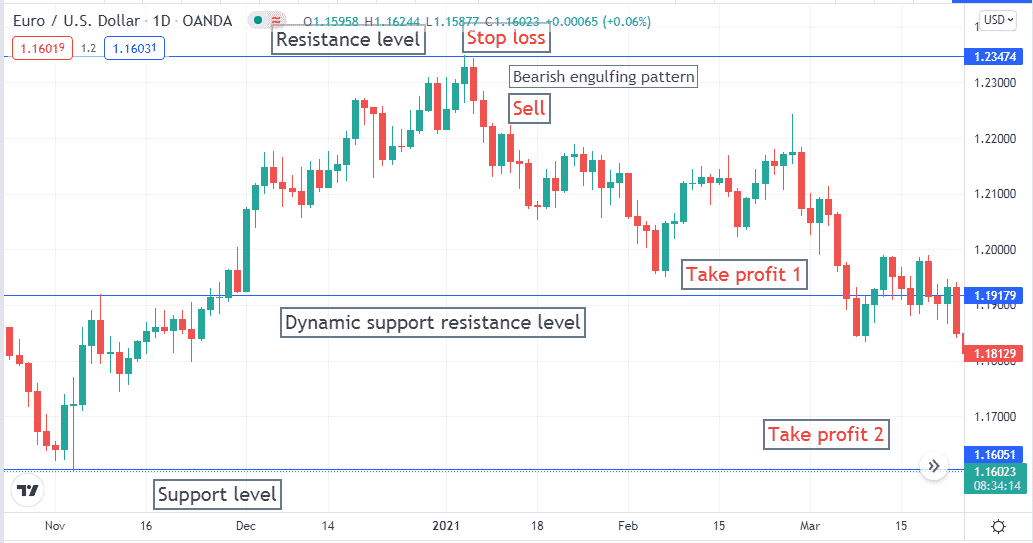
You may already mark the S&R levels in the chart. You will get opportunities to make sell orders by this strategy when the price reaches any vital level that you draw. Observe the price movement at that level and wail until a bearish engulfing pattern appears.

Entry
The bearish candle confirms the engulfing pattern by placing a sell order after the current candle closes.
Stop loss
This level will be above the recent swing low or above the resistance level where the uptrend ends and the price declines.
Take profit
The target will be above the next support level. You can close your order manually when the price reaches that level, or you can also continue your sell order until the next support level.
Pro tips
If you continue your sell order after reaching the closest support level, we suggest shifting the stop loss at or below the breakeven point to reduce risk. Otherwise, you also can collect a portion of your profit at those levels.
Final thought
Now you know all textbook descriptions about the engulfing pattern. You can make thousands of pips from the trading strategy we describe above. Be careful to trade with this strategy during any trend-changing events such as GDP, employment data, inflation-deflation data, interest rate decisions, etc. Don’t make early entries; wait till the formation of the pattern and not continue trading positions for so long, better close with little profit and wait for following better opportunities.


