Technical indicators are programs that use mathematical calculations to convert inputs or, primarily, price data into outputs. The outputs are then graphically drawn on the chart to help the trader make buy and sell decisions.
The number of technical indicators, both paid and free, is virtually limitless. That is why trying to use or test them all would be unwise. They would only cloud your judgment about what matters most in trading. If you want to trade with indicators, the best way to learn what most market participants use. Try them out and see if they add value to your trading. If not, throw them away.
One popular indicator among traders, particularly stock traders, is the VWAP. This indicator is different because it factors the volume of transactions to come up with the real average price.
Is the VWAP an effective trading tool? You will find out in this post. Plus, we will share a trading strategy that you can use in your trading.
What is the VWAP trading strategy?
It is a custom technical indicator that uses volume to determine the real mean price of an asset for a specific time frame. It is in stark contrast with moving averages (MA) that mostly employ closing prices. Because of this, VWAP is more suitable for gauging the existing condition and future outlook of an asset.
Stock traders claim that using the closing price to determine the average price is not the best approach. They say this approach does not paint a clear picture of the asset’s health. Variations in volume and price and the multiple time frame factor should be considered, so they say.
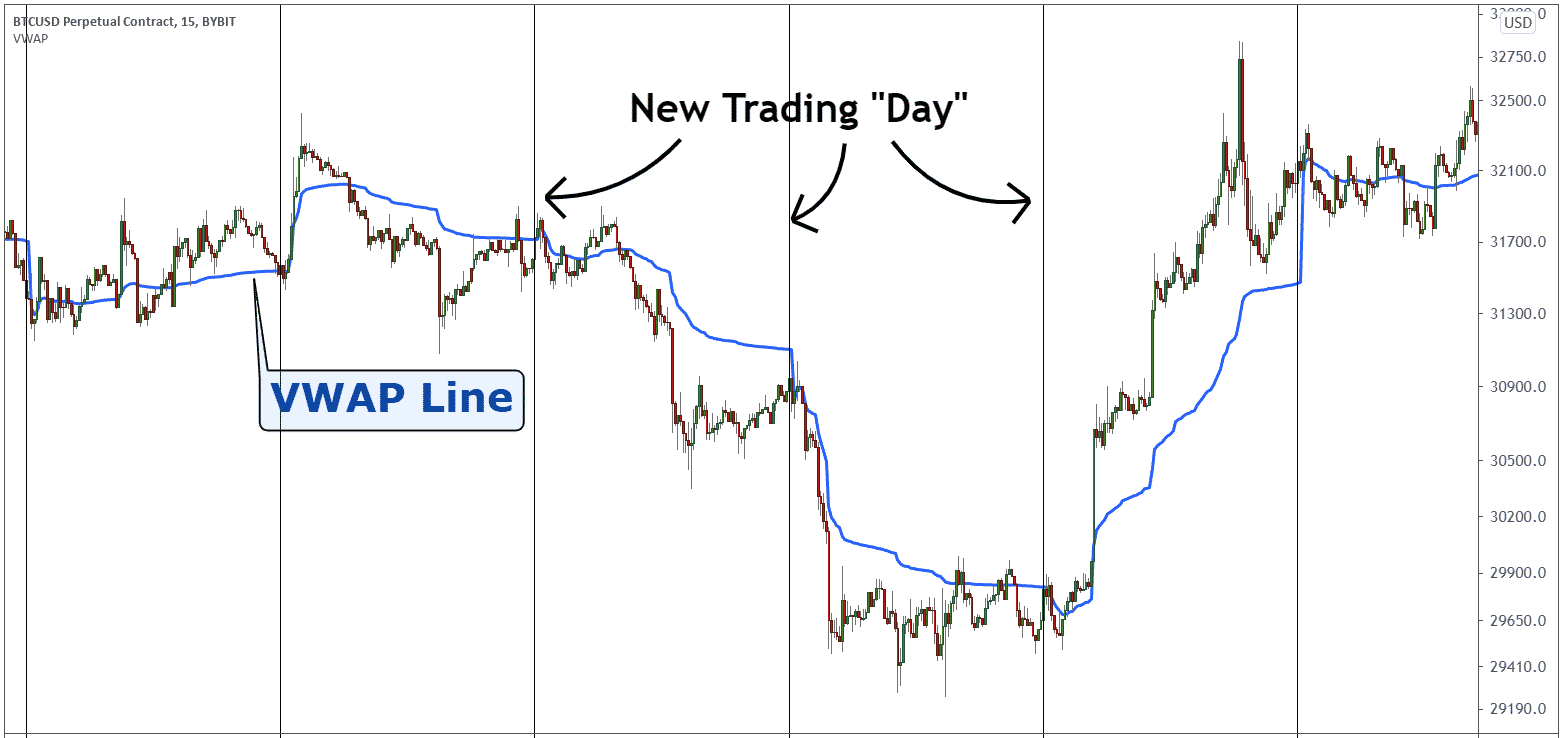
They present VWAP as the solution for the limitation seen in MAs. VWAP responds to changes in price for a certain period and considers volume. That is why you can see the VWAP as a squiggly line that is less smooth than an EMA.

How to trade with VWAP trading strategy?
Unlike a MA, the VWAP line is precarious. As it is based on volume, it fluctuates wildly and stays very close to the price. Your account also continuously fluctuates up and down. In principle, every time a price crosses and closes up or below the VWAP, that is a buy or sell entry. However, in reality, that is not a sound trading approach. You will be trading all day long with this approach.
The best way to trade the VWAP is with the help of a long-term MA. In this example, we will use the 200 EMA. The EMA is your guide to see the trend of the chart you are looking at. Naturally, you will take trades in line with the trend.
The entries are explained below:
- Buy entry
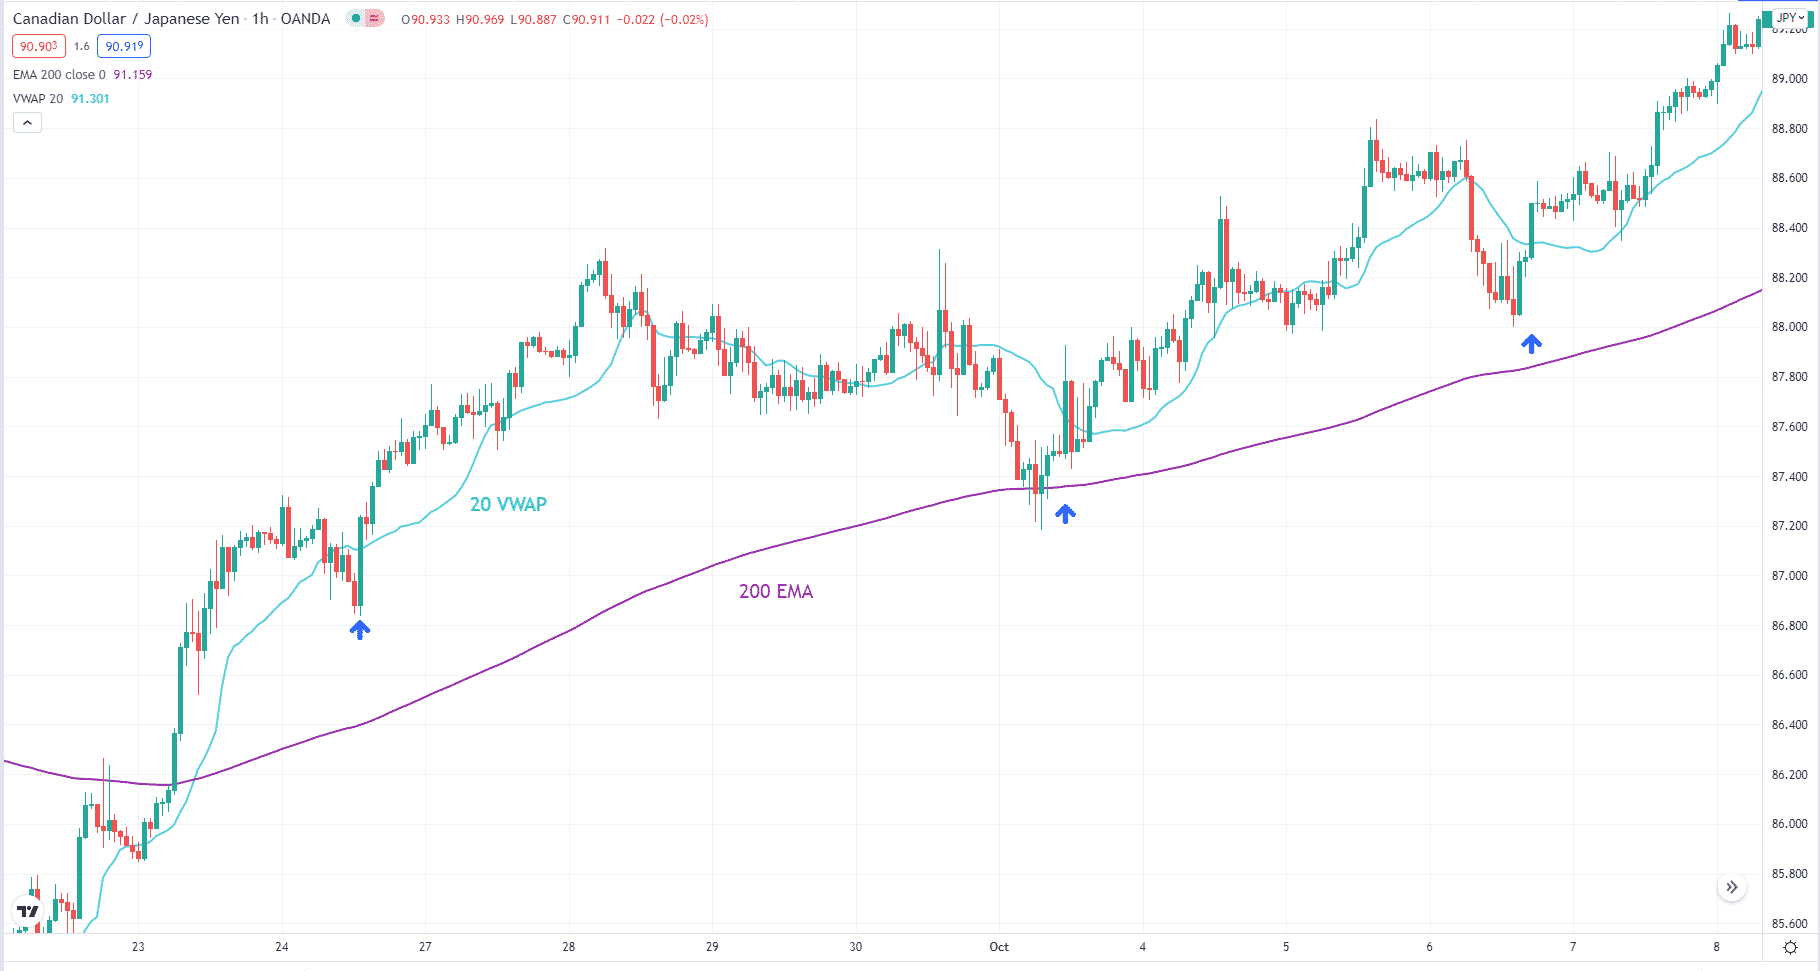
The 200 EMA should be moving upward, and the price should cross and close above the VWAP. The best entry is when a bullish candle penetrates deeply into the VWAP.
- Sell entry
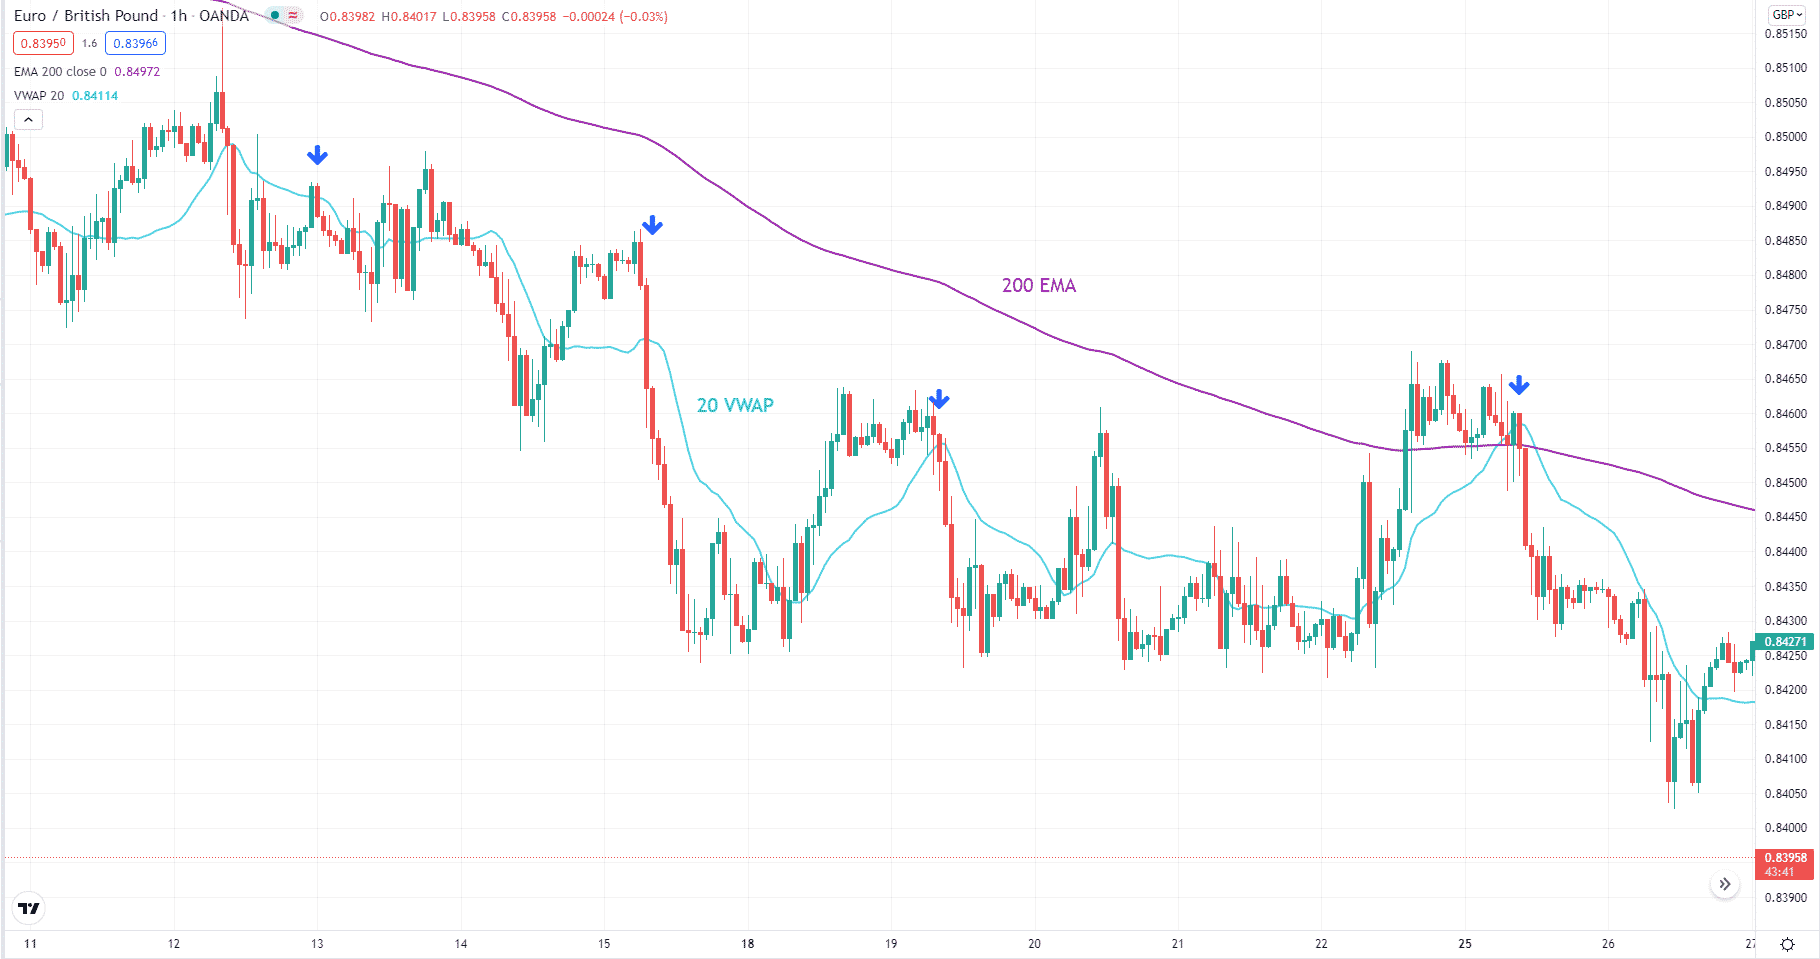
The 200 EMA should be moving down, and the price should cross and close below the VWAP. The ideal entry is when a bearish candle penetrates deeply into the VWAP.
Trade samples
Here we will show two chart examples to demonstrate how to implement the above strategy.
Bullish trade setup

VWAP is a popular day trading tool. It is best used on the lower time frames, such as the hourly chart.
Entry
Refer to the CAD/JPY hourly chart above. Since the price is generally moving above the 200 EMA, we can say the trend is up. Therefore, we will look for long entries only. The entry trigger is a bullish candle that breaks and closes above the VWAP.
Stop-loss
You can see three ideal setups in the above chart. It is easy to set the stop loss in the three trades. Just put it on the recent swing low a few candles back.
Take profit
The take profit is a bit challenging, though. Use the exit strategy that you like. If you want an easy exit method, you can trail your stop using a specific number of pips or points.
Bearish trade setup

Entry
Refer to the hourly chart of EUR/GBP above. Since the price is generally moving below the 200 EMA, the trend is down. Then it would help if you look for sell trades only. This happens when a red candle intersects and closes below the VWAP.
Stop-loss
We marked four ideal instances on the chart above. Here you can use the recent swing high as your stop loss. Then you can trail your stop loss using a set number of pips.
How to manage risks?
When you use technical trading, the best way to manage risk is with a stop loss. To do this correctly, you must decide how much of your account you would like to risk in each trade. A dynamic solution is a percentage risk, and the standard percentage is one or two percent. The same is true for this strategy.
For example, if you have a $1,000 account, you must risk only $20 in each trade and no more.
$1,000 x 0.02
The lot size in each trade will vary based on the distance of your stop loss from entry, but the risk amount remains the same.
Final thoughts
The VWAP indicator is not so popular in forex trading, but it is in stock trading. Because VWAP takes volume into the calculation, it might not be effective in FX. The problem is that forex has no central exchange. The volume you see on your platform is the number of transactions executed by all traders for a given broker. The volume in a trading platform then might vary from one broker to another.
Meanwhile, you can expect the volume of transactions for a given stock to be correct as the stock exchange provides it. Looking at the charts above, you might conclude that a MA can take the place of the VWAP. That is a good judgment. That short-term moving average could be better.


