Technical indicators may be used to forecast price movement over the short term. For example, Bitcoin’s value may be predicted using “signals” or mathematical computations based on market data.
Historical price/volume data, rather than fundamental indications like profit, revenue, or turnover, are used by traders to anticipate the price movement.
A lack of understanding of the indications used by traders is usually a surprise to me. Because many traders don’t take the time to learn about their indicators, they often misuse them. Traders might benefit from using a Stoch indicator. I’ll describe what it does and how to use it here.
What exactly is a Stochastic indicator?
It indicates if the current trend is very strong or rapidly changing. With the help of the indicator, we can see how fast and effectively the price changes.
The Stochastic signals
The tool’s indications and techniques include, for example, those listed below:
- Breakout trading
After a considerable acceleration in one direction, the Stochastic’s two bands broaden, indicating a new direction of travel. In addition, breakouts from the sideways range are considerably simpler to see.
- Trend following
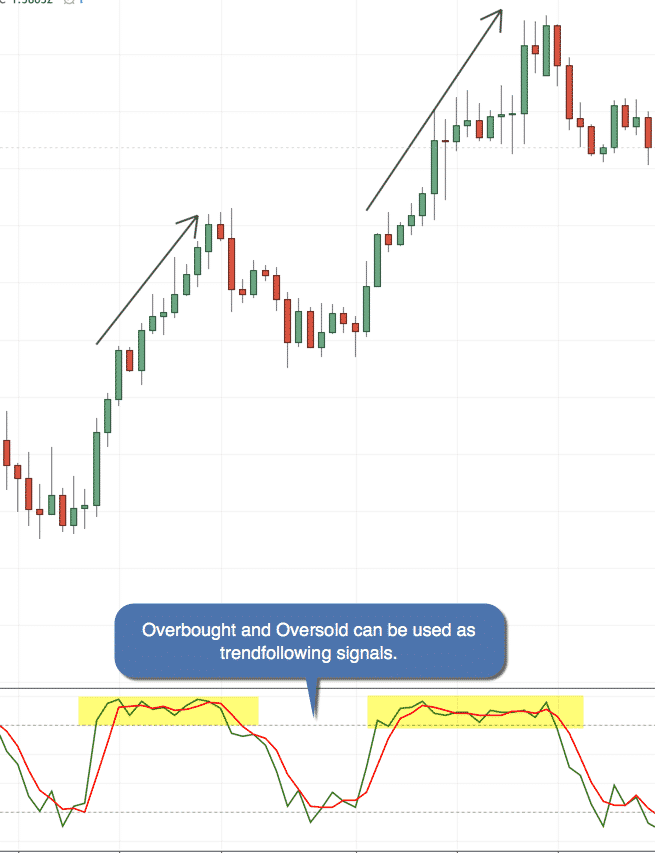
The trend exists if the Stoch does not cross in a given direction.
- Strong trends
Trading in Stoch indicators’ oversold/overbought region requires a disciplined approach.
- Reversal of the trend
Indicating a reversal, the Stochastic may have broken out of the overbought and oversold regions. Using Stochastics with moving averages or trendlines is also possible, as we’ll see later.
The Stochastic green line must rise above the red one to detect a positive (Bullish) reversal.
- Divergences
It is essential to look for divergences since they may suggest a likely reversal or even the end of a long-term trend.
Using Stochastics with other indicators together
It’s possible to utilize this indicator to find value regions on your chart and trigger an entry.
The first step is to combine the indicator with an MA.
- Using an MA, the trend may be seen.
- Use the Stoch to identify the trend’s value range.
- Use candlestick patterns as a signal for entries after that.
An alternative is to:
- An MA may be used as a filter for trends.
- As a source of strength, consider the role of support and resistance.
- Use the indicator as your entry signal.
Stochastic is employed as an entrance trigger in this example. If the Stochastic crosses below 70, which indicates that the market is declining, it is feasible for the Stochastic indicator to sell at resistance.
Trading stocks and futures contracts using Stochastics indicator
Oversold and overbought readings aren’t usually indicative of a positive or negative outlook, respectively. Strong uptrends may lead to protracted periods of overbought readings. Security may be oversold for a lengthy period amid a strong downtrend and remain oversold. If you use a conventional indication, the overbought/oversold numbers are 80 and 20.
A major chunk of stock losses occurs when a stock’s oversold levels in a downtrend are achieved. When using stochastic indicators, the whole trend should be taken into account. You should ignore many overbought signals in a big rally and try to buy at the rare oversold reading when the market is rallying strongly. Watch for uncommon overbought readings and ignore frequent oversold readings if the market is in a strong slump.
Stoch indicators alone are not sufficient to determine trading entry points. In late May, when SPY had gone from 144 to 137, you can see that it had entered an oversold state for the first time (see the chart below). A further 13.3% saw the ETF drop to 119.
This chart plainly shows that the SPY is in an uptrend. Since August 2009, when 50 crossed 200, the 50-day and 200-day EMAs have shown a rising trend. Trade long on an oversold stochastic reading if the market is headed in the right direction. To corroborate the first two criteria, a successful test of the 50-day EMA would have been an indicator. The 200d passed its third-circle test with flying colors. Since March to April 2010 was an uptrend, overbought figures may be disregarded.
Mistakes traders make using Stochastic
Using the Stoch indicator may be tricky, and we’ll show you how to avoid some of the most potential mistakes.
If you can avoid these mistakes, you’ll save thousands of dollars in the long run.
- It’s an awful idea to go long when the market seems to be oversold.
- Foreseeing an upturn because of a divergence you’ve seen in the market.
You may take a long position when the market is oversold
The indicator may be used to gauge market momentum. It’s an excellent sign of the market’s present situation since it suggests strong bullish momentum. You don’t want to “blindly” trade short because Stochastic is overbought.
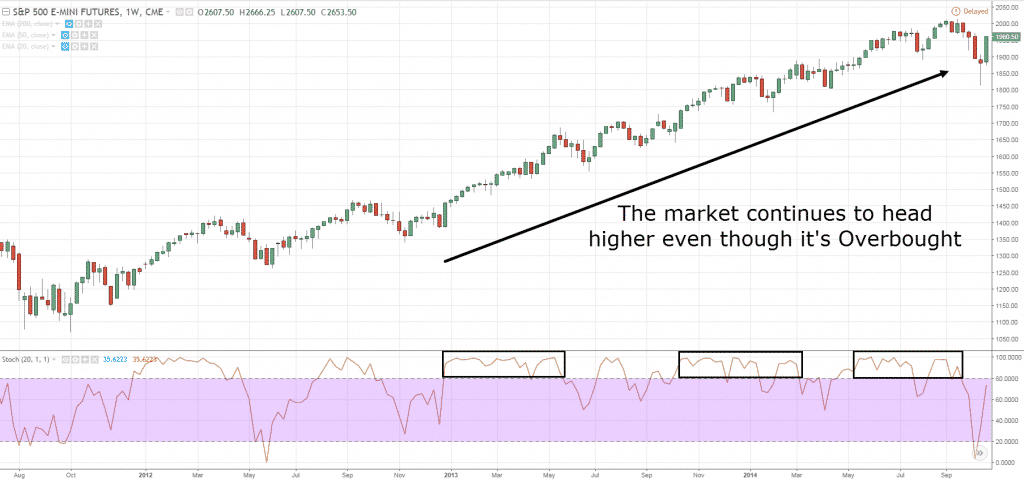
It’s for a good cause, however. Due to the market’s overbought situation, shorting the stock today would have been a horrible decision. Unfortunately, your account will be unable to resist an overbought or oversold market for an extended length of time.
Due to a divergence you’ve seen
These two signals’ conflicts and divergence show this. In the world of trading, a divergence is considered an indication of an imminent reversal.
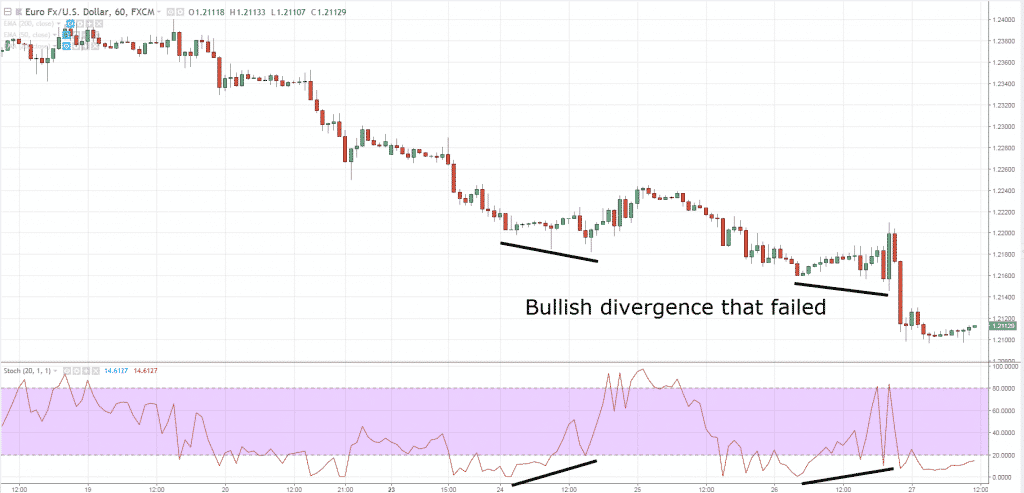
In addition to the fact that this is wildly inaccurate. Even if there was a divergence, the market didn’t turn around. A long time ago, it started going lower.
You now know how to avoid the two most common blunders traders make while utilizing Stochastic.
Bullish setup
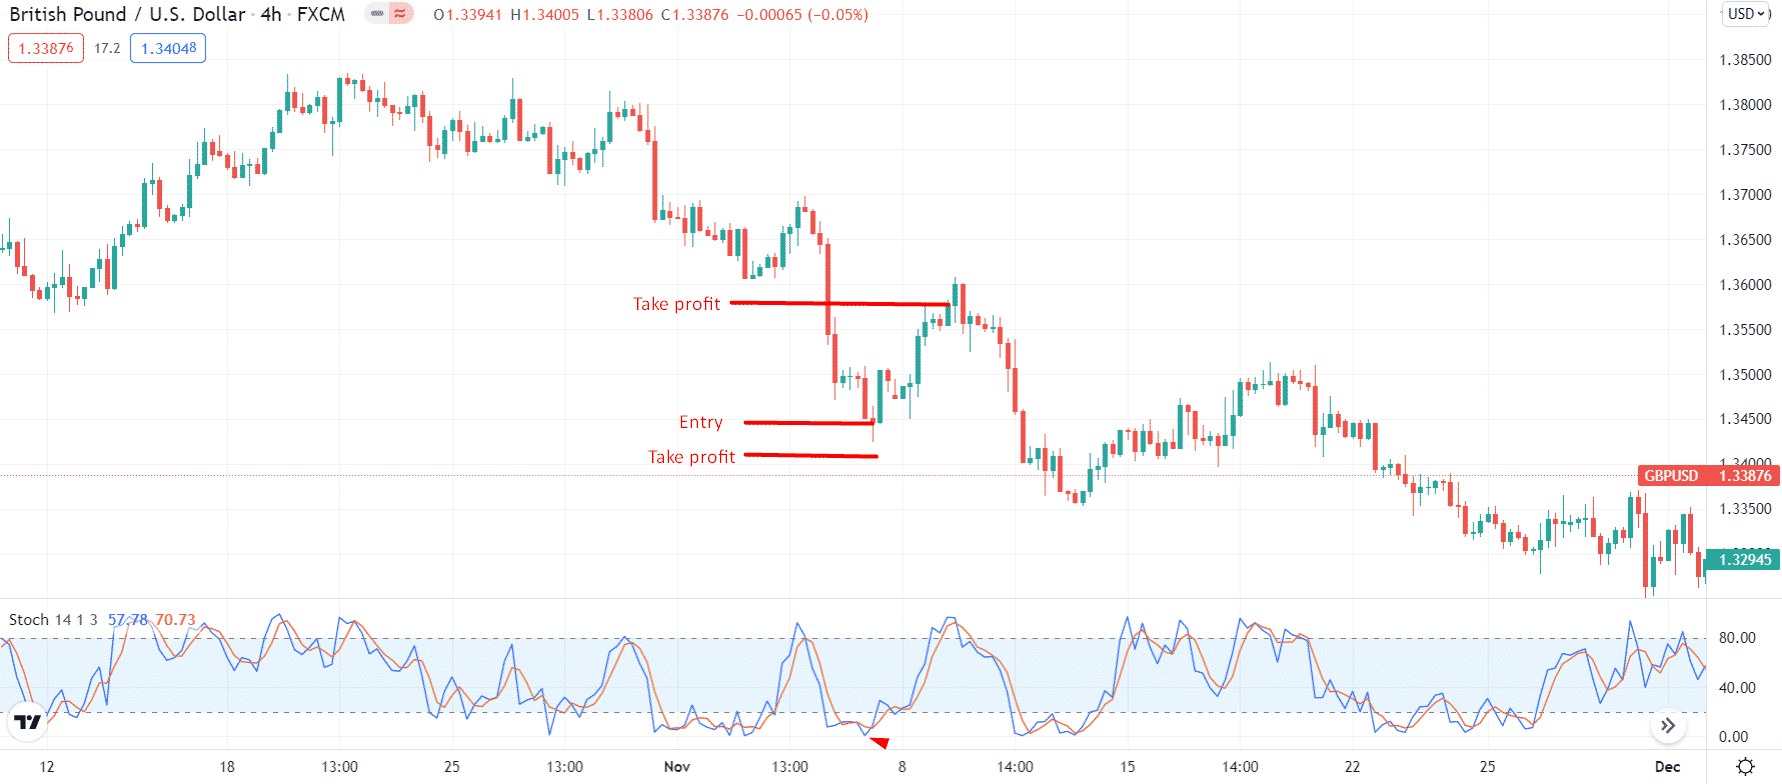
Let’s take dive into a stochastic bullish trade setup.
Best time frame to trade
Due to noise in the indicator, using a 4-hour or daily time frame is recommended.
Entry
You can enter the long position once the indicator touches or exceeds 20 (oversold region). First, however, wait for the current candle to close.
Stop loss
The stop-loss can be placed below the local low.
Take profit
To keep the reward twice the risk, your take profit level should be doubled than stop-loss.
Bearish setup
Now, the time is to look for a bearish setup.
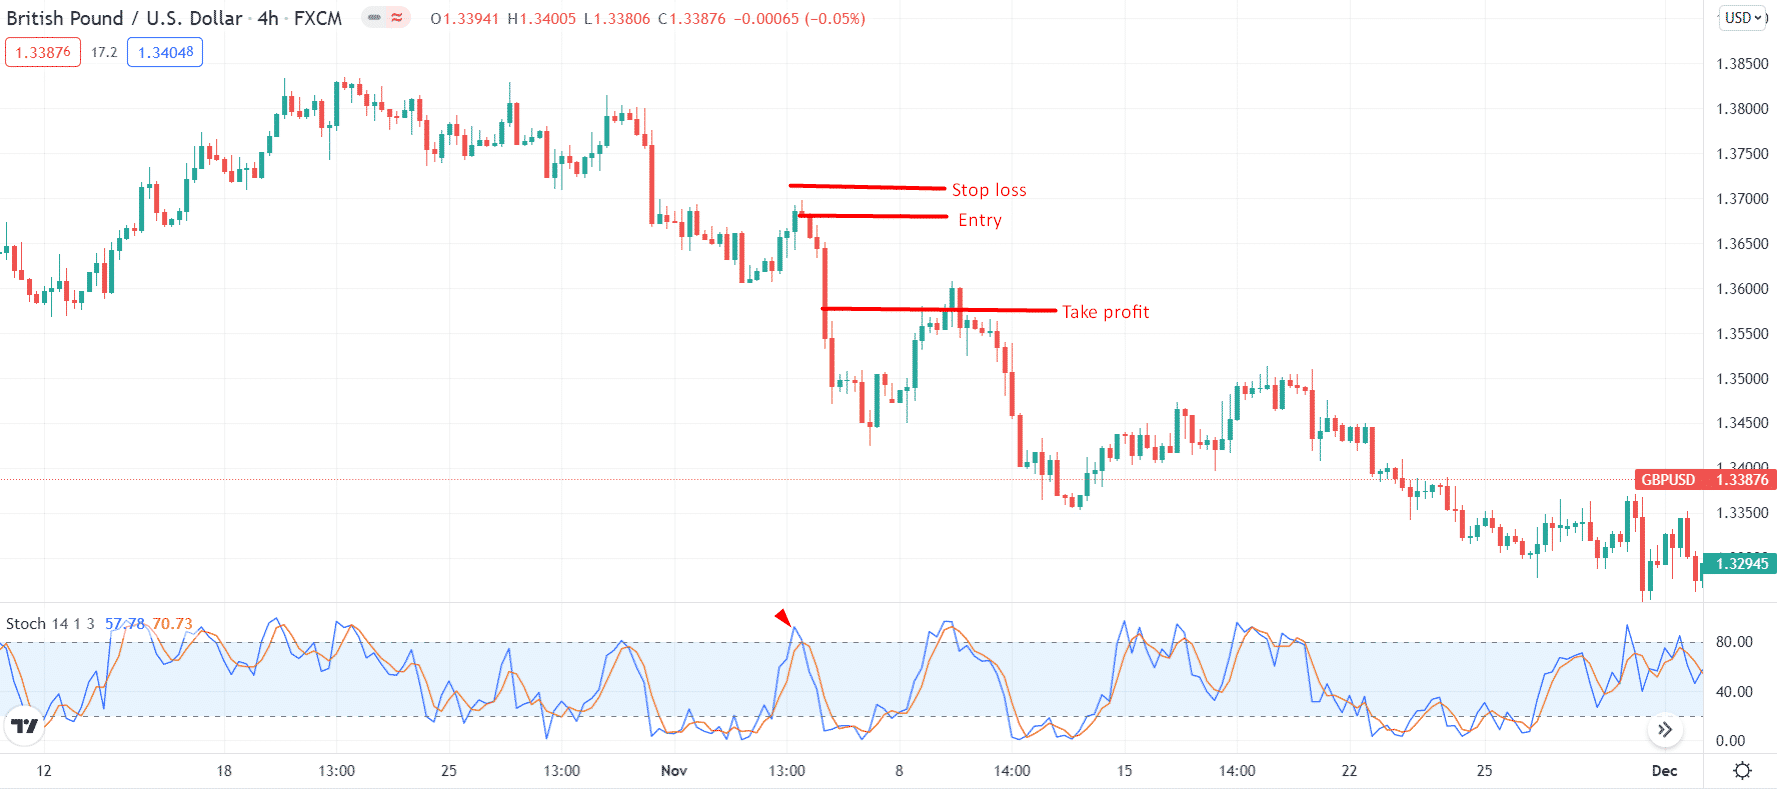
Best time frame to trade
Due to noise in the indicator, using a 4-hour or daily time frame is recommended.
Entry
You can enter the short position once the indicator touches or exceeds 80 (overbought region). First, however, wait for the current candle to close.
Stop loss
The stop-loss can be placed below the local high.
Take profit
To keep the reward twice the risk, your take profit level should be doubled than stop-loss.
How to manage risk using a stochastic indicator?
You should beware of the risk associated with any trading method. For example, in a Stoch indicator, you may face plenty of noise or false signals that you are bound to filter to improve your performance. You may do this with the help of candlesticks. Combine the candle patterns like pin bar, engulfing, or stars for the purpose. Also, never take an unlimited risk with any setup. So, it’s prudent to limit your risk to 2% per position.
Final thoughts
If you can understand the momentum of your charts only by looking at the candles, you may not need the Stochastic indicator. But, on the other hand, this indicator has no negative impact on your charts if you use it.
You may not know as much as you think you do about trading tools, and that’s the point of this blog article. Even though they are widely used, indicators like the Stochastic oscillator are frequently misunderstood by even the vast majority of traders. So take control of your trade knowledge instead of relying on the advice of others.
