Investors who use technical indicators can easily buy and sell cryptocurrencies in an unstable and risky market. In addition, these indicators can help crypto traders make better trading decisions because they give an unbiased view of the currency they are based on.
The best way to use indicators to figure out how the market is changing is to keep things as simple as possible. For example, the commodities channel index indicator is a good way to keep track of price changes. You can use this indicator to see how strong the current trend is and where prices might turn around.
Traders who want to use the CCI indicator to make trades need to know how it works and how to trade. This article will show you how to make money in the cryptocurrency market using the CCI oscillator.
What is the commodity channel index (CCI) indicator?
The CCI indicator is a tool for checking out the market if a crypto trading trend is oversold or overbought. In addition, investors may use this indicator to figure out how strong a trend is when they’re looking for good buying and selling chances.
Donald Lambert, a technical analyst, came up with the CCI indicator in 1980. He made it to determine the average price over a certain amount of time. Lambert thought about applying this indicator to the commodities market. However, cryptocurrency trading currently can still benefit from this.
The value of the CCI indicator goes up if the price is above the average for a certain period. Thus, we can expect a bigger market trend. Conversely, a lower CCI means a bullish trend if the price is below its average level.
Top five tips for trading with commodity channel index (CCI)
Here are the top five tips for trading with the help of CCI.
Tip 1. CCI trend based trades
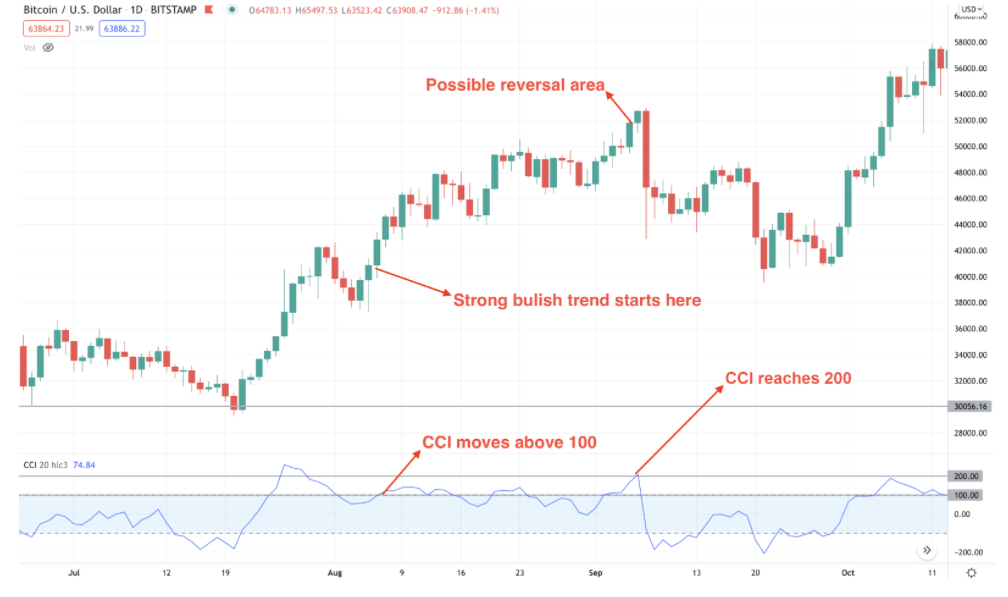
A too high market should have a better chance of dropping in price. If the market is oversold, prices are almost certain to go up. Traders can make long trades when the CCI indicator is 100, so long trades are possible.
When the CCI gets to 200, which is excellent, they might close their previous buying future trades.
Why does it happen?
As the CCI indicator crosses 100, the bullish trends become more noticeable on the daily BTC/USD chart below, which shows how. By the time the CCI reaches its extreme of 200, the bullish trend will have lasted for more than a month and turn the other way.
How to avoid mistakes?
Traders who want to trade cryptocurrencies should always go with the flow of a trend. CCI is one of the best choices to grasp the ongoing trend or trend reversal points.
Tip 2. Follow CCI range trading
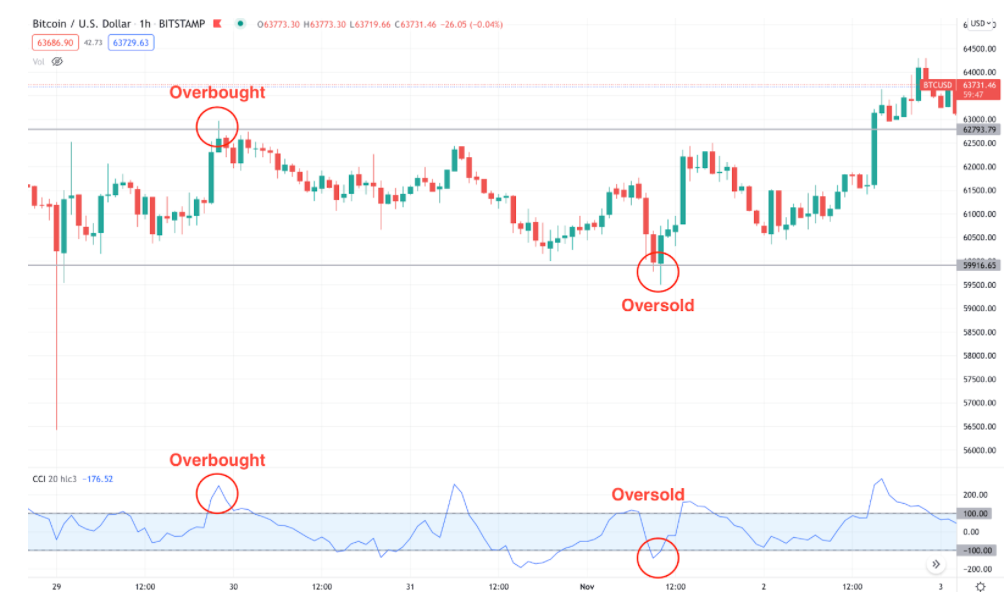
When a market is overbought or oversold, the level of the CCI indicator shows how long the market has been in a range of 100. Find CCI levels at the top and bottom of a range to trade the bounce back from the boundaries.
Why does it happen?
CCI levels can help traders take advantage of the main market trend. Unlike other technical indicators, you can find opportunities in the ranging markets. Meanwhile, most of the technical tools tell you about trend reversal.
How to avoid mistakes?
First, you need to learn about the cryptocurrency market and research. Every crypto asset maintains a certain broad or narrow range. It would help if you marked the range with horizontal lines. Then, use the CCI indicator to determine the oversold and overbought levels to enjoy a high probability of winning trades.
Tip 3. Follow CCI divergence trading
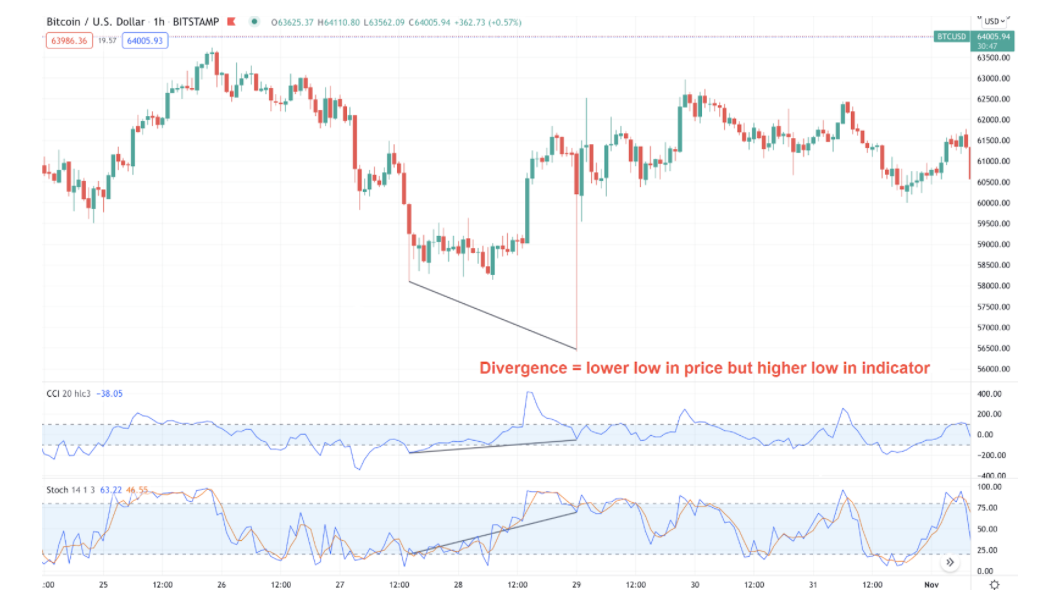
Swing highs and swing lows are formed when the price of a coin changes in a zig-zag pattern, so they are called swing points. If the price and the momentum indicator are not moving in the same direction, traders may see the price move in one direction while the momentum indicator moves in another.
Why does it happen?
It’s a good sign when the CCI is different from the price movement. Investors can use this to open buy or sell futures or spot trading positions.
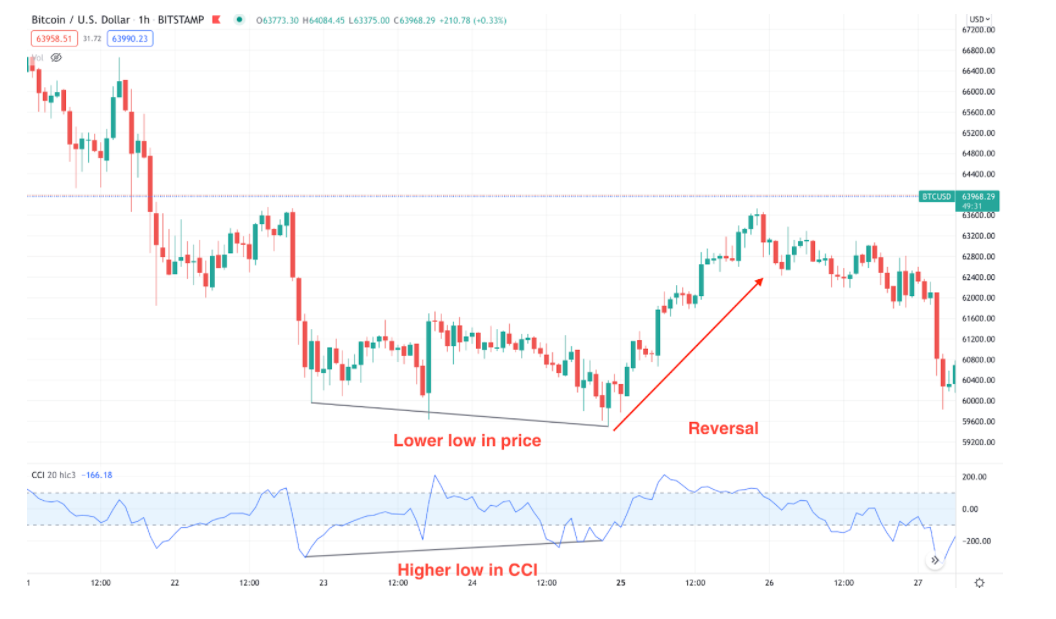
Bitcoin made a lower bottom on the chart above, which shows that the market is going down. Instead, the CCI indicator doesn’t make a new bottom but makes it higher than before. Because of this, the price rises, which means there has been a change in the market’s direction.
How to avoid mistakes?
You can avoid the bullish or bearish traps by simply snapping the price wave compared to the CCI movement. The discrepancy between both shows the change in trend. So always trade in the direction of the CCI indicator.
Tip 4. Use CCI and stochastic oscillator together
Another momentum indicator, the stochastic oscillator, compares a certain closing price of a trading asset over a certain amount of time to see how it has changed. It’s a 0-to-100 range-bound sign. If the reading is below 20, it’s oversold, and if it’s above 80, it’s too high.
To signal a change in direction, stochastic oscillators can make a difference with the price. Therefore, it is important to know about this indicator because it can give false reversal signals when the trend is strong.
Why does it happen?
The CCI indicator may have noise, or it may generate false signals. Therefore, it is not a great idea to use it as a standalone indicator.
How to avoid mistakes?
The CCI indicator and the stochastic oscillator can show bullish and bearish trends. In addition, the CCI is more price-sensitive than the stochastic oscillator. Therefore, the CCI indicator may be more reliable for traders using two or more trading confirmations.
Tip 5. Use higher time frames
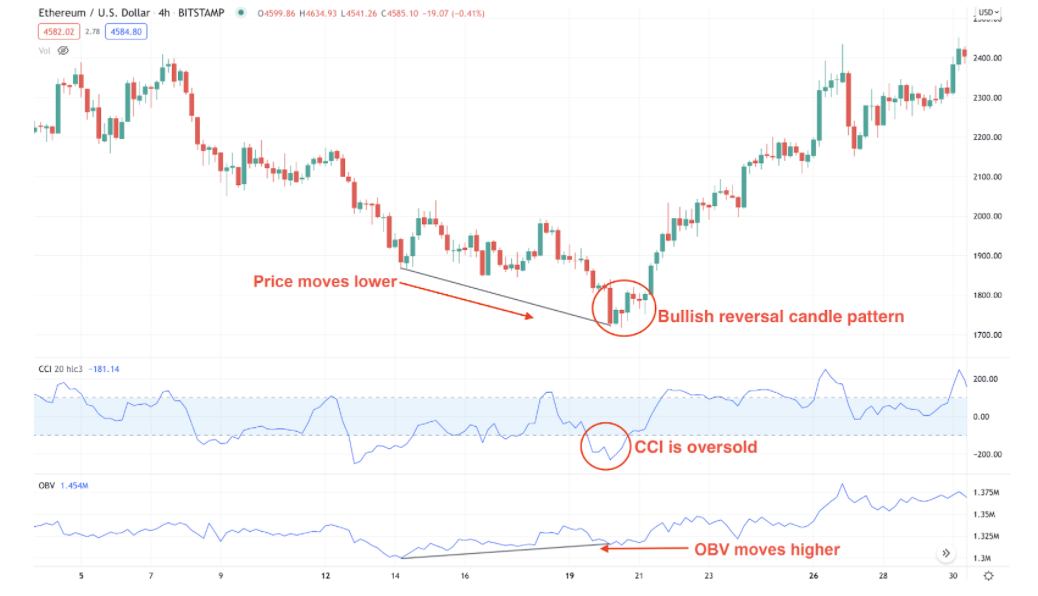
Using lower time frames makes you handicapped of more significant opportunities in trading. The reason is lower time frames have plenty of noise and a lower amount of pip movement in a trend.
Why does it happen?
If you keep using smaller time frames with the CCI indicator, you may fall prey to stop-loss hunting. The CCI indicator may generate fewer signals on higher time frames, but the accuracy will be better.
How to avoid mistakes?
It would help if you used at least a 4-hour time frame or higher. This will reduce the noise and add more profitability with fewer trades.
Final thoughts
Financial markets analysts use technical terms to talk about market knowledge better, as the CCI. The tool uses a price average to figure out the current price over a long time. Its value moves around zero. So, when the price is above its average, the CCI line moves up. When it is below, the line moves down.
If there are overbought and undersold crosses or divergences, the CCI is most likely triggered by its current value. For example, a price has fallen below its average in the oversold zone and is expected to rise again. Conversely, when the CCI crosses the overbought zone, it sends a sell signal. It is an excellent time to buy.
