Many traders apply support and resistance levels in their trading strategies. As the price peaks and troughs, traders can anticipate the market movement. In other words, the price follows the adage of “What goes up must come down.”
But amidst up and down moves, the price can return to average levels, thereby creating a mean. The whole concept of mean trading is that after the price goes up returns to its previous level and creates a typical pattern.
This guide will explain everything you need to know about the Mean Reversion indicator and present you with the top five tips for crypto trading.
What is the Mean Reversion indicator?
It comes from the group of channel indicators. It means that it draws channels inside which the price moves and tries to forecast its behavior on the chart.
The indicator comprises five lines, each representing support and resistance levels. The upper two marks are R1 and R2, while the lower two represent S1 and S2.
- The upper two lines also signify an overbought condition.
- Conversely, the lower two lives highlight oversold conditions.
- The upper and lower lines are calculated as standard deviations.
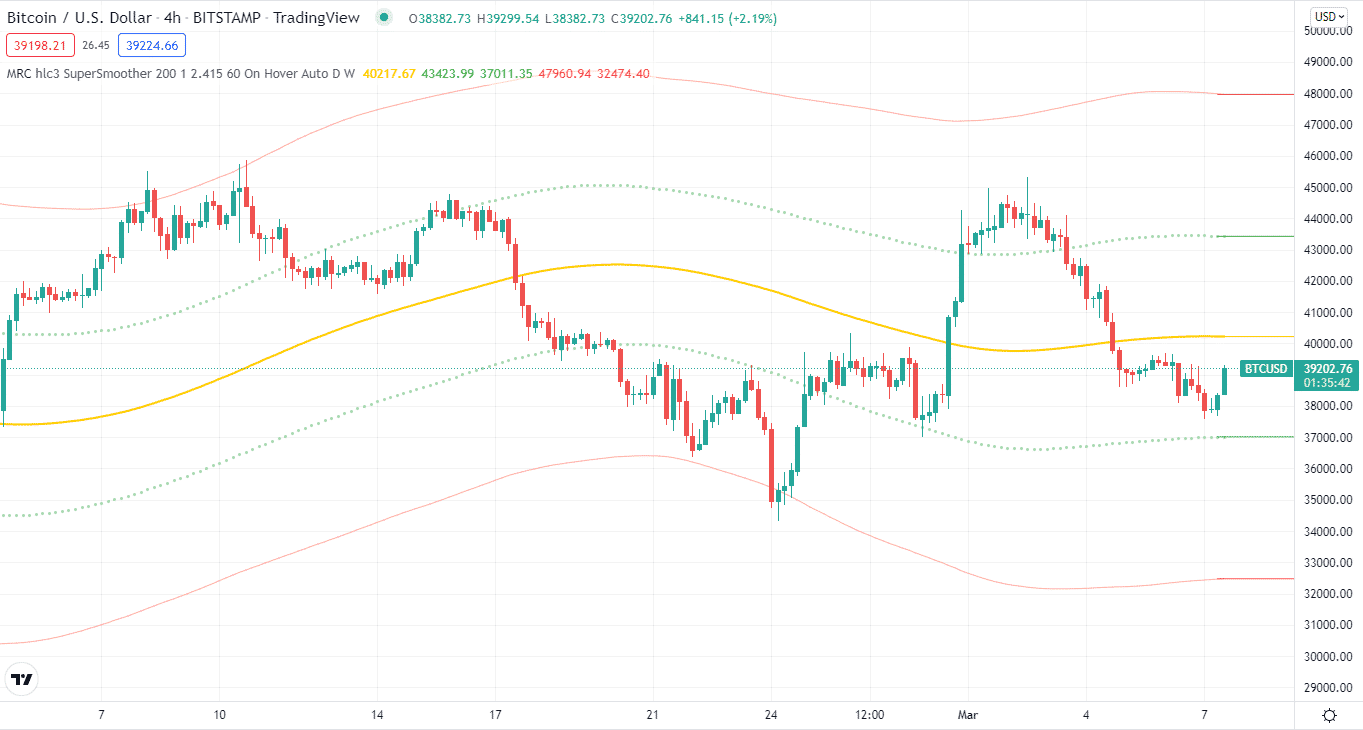
The central line is called the mainline, and its calculation is based on polynomial regression. The central line forms a channel along with the upper and lower lines.
Top five tips for trading with Mean Reversion indicator
Now that you know, what Mean Reversion Indicator is, let’s move to the top five tips for crypto trading with the indicator. If you are looking to trade with the indicator, these tips may come in handy.
Tip 1. False breakout of support level
The trader looks for a breakaway or a bounce off the vital support and resistance levels on the chart. It might be challenging to detect. In this instance, the Mean Reversion indicator may serve as a filter, displaying the entire market sentiment.
Why does it happen?
Below we have a BTC/USD chart illustrating the false breakout of a support level.
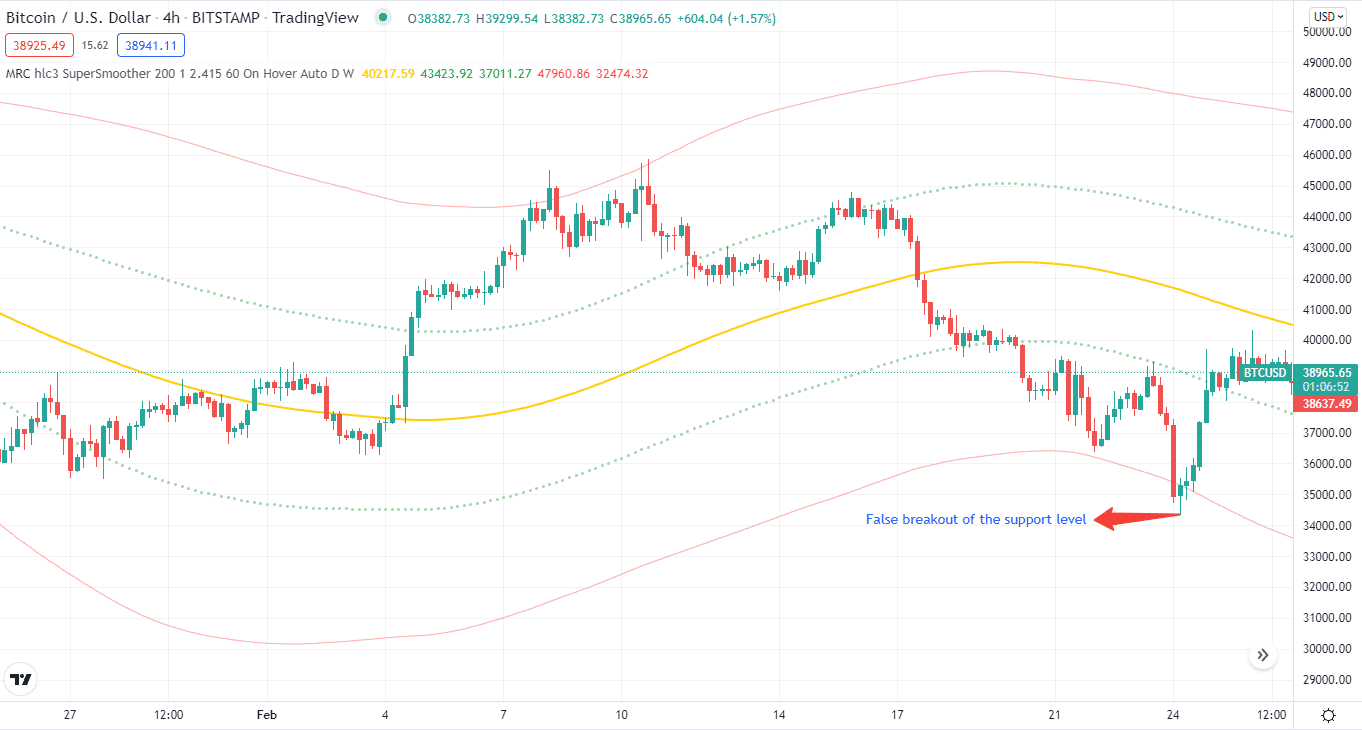
The price approach serves as major support and stops level for us. Then one of two things can happen: it can either break away from the level or continue to decline, or bounce off the level and begin to expand. You could make an educated guess, but a Mean Reversion indicator is a better option.
How avoid the mistake?
Our situation indicated that the BTC/USD pair was oversold. This meant that sellers’ dominance was eroding, and the moment of the buyers was approaching.
The chart shows that the price broke the support and returned to the indication borders. We can deduce that the separation was a ploy, and the downturn is unlikely to continue. You might want to consider going long here.
Tip 2. False breakout of resistance level
The price can also make false breakouts at resistance levels, similar to the support levels. However, it continues with the trend or pullbacks, so a Mean Reversion indicator can help predict price continuation and reversal at resistance levels.
Why does it happen?
The price approaches and stops beneath the resistance level in the chart below. Is it going to be a breakaway or a bounce? Take a look at the indicator.
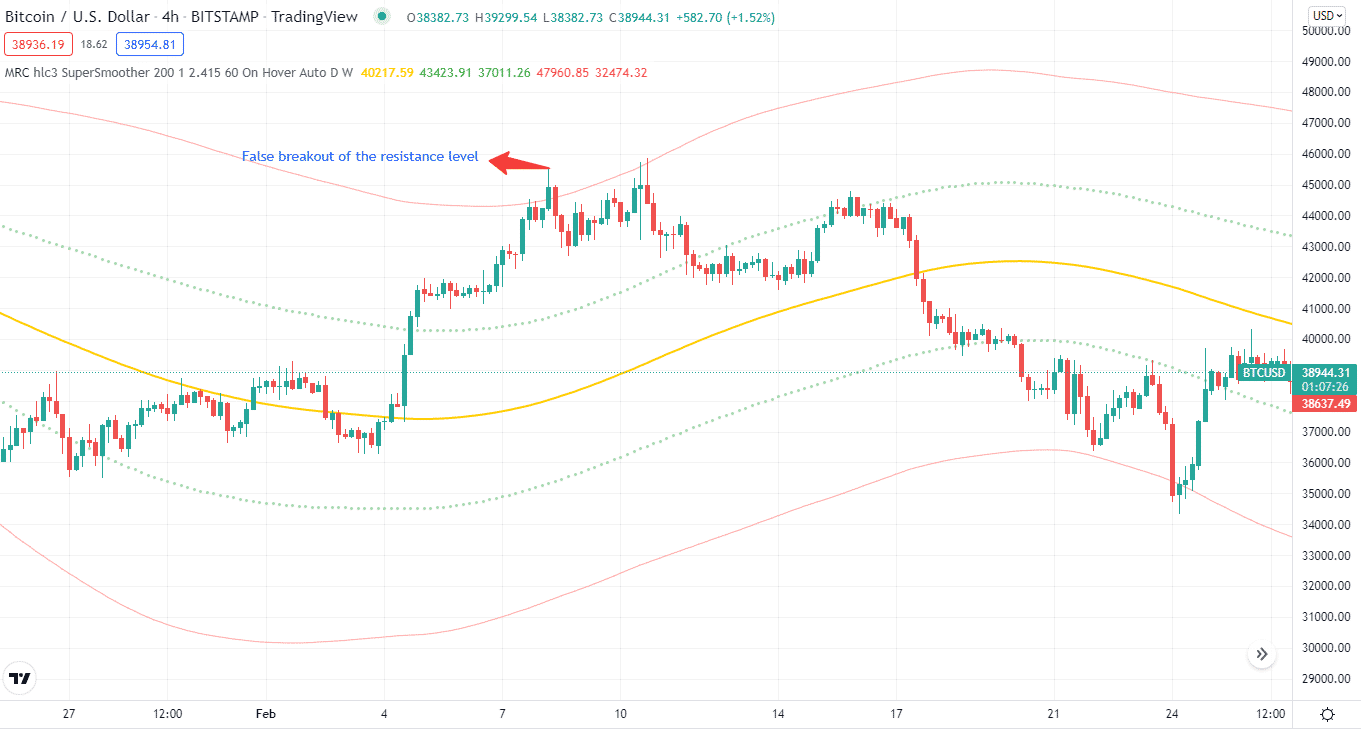
The price is in an overbought condition, which indicates that the sellers’ strength may be waning, and the price may bounce off the level.
How avoid the mistake?
When the price breaks through the resistance levels, it’s time to sell. The stop-loss can be placed below the nearest high. The price bounced off the resistance level and declined, as shown in the chart above. When the price enters the oversold level, you must close the bet with a profit.
Tip 3. Trading with linear regression
The optimum line between the starting and finishing endpoints is a linear regression line.
Consider it like a trendline, without diving into the arithmetic. It’s the path a cryptocurrency takes from point A to point B.
Why does it happen?
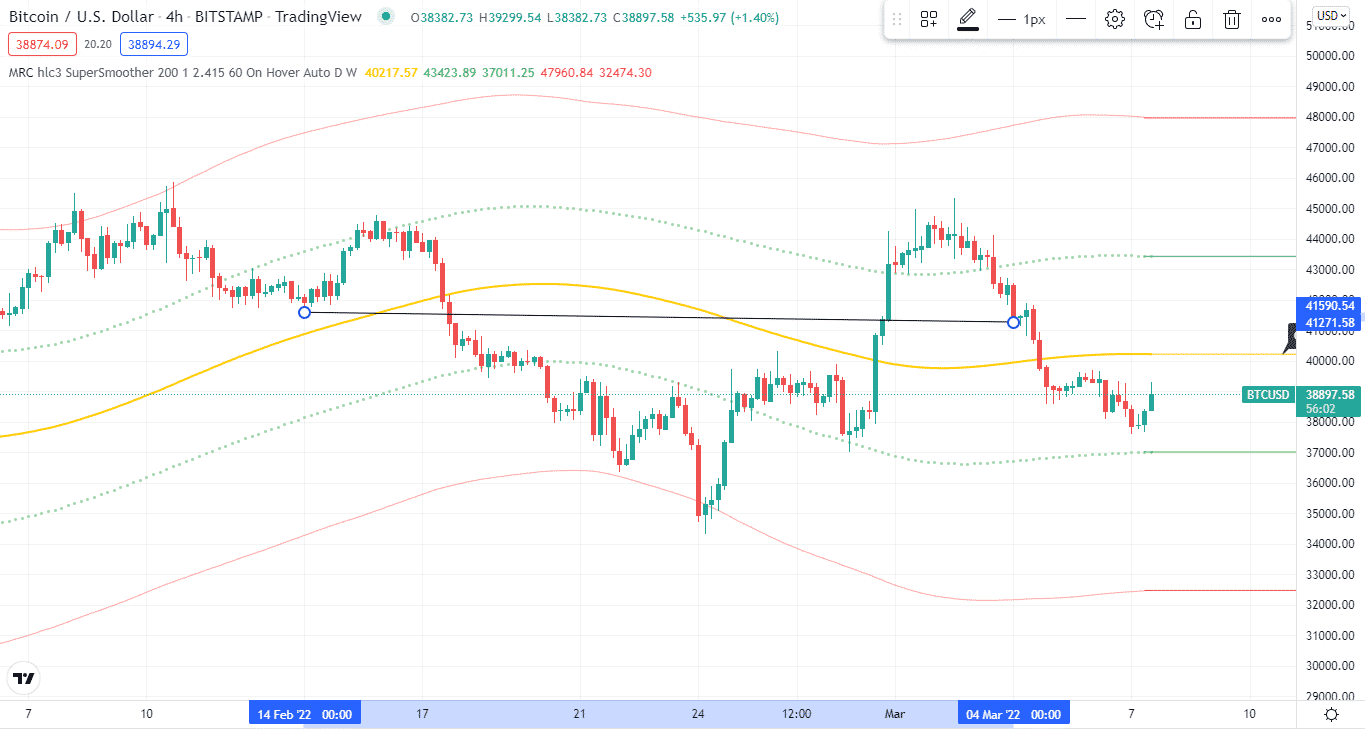
A linear regression line from February 14th to March 4th is shown above. The line depicts the best match between points A and B, essentially a sideways line. This simply indicates that BTC/USD has been range-bound for the past 18 trading days.
How avoid the mistake?
A common mean reversion trading strategy is plotting standard deviations around the linear regression line. When the BTC/USD is towards the upper range, it is called overbought, and when it is near the lower level, it is considered oversold.
Tip 4. Trading with the trend
Let’s move on to trend trading and entering the market during pullbacks. First, the price must be in a strong trend if you buy at pullbacks.
Why does it happen?
After growth, the price corrects to the broken levels in the image below.
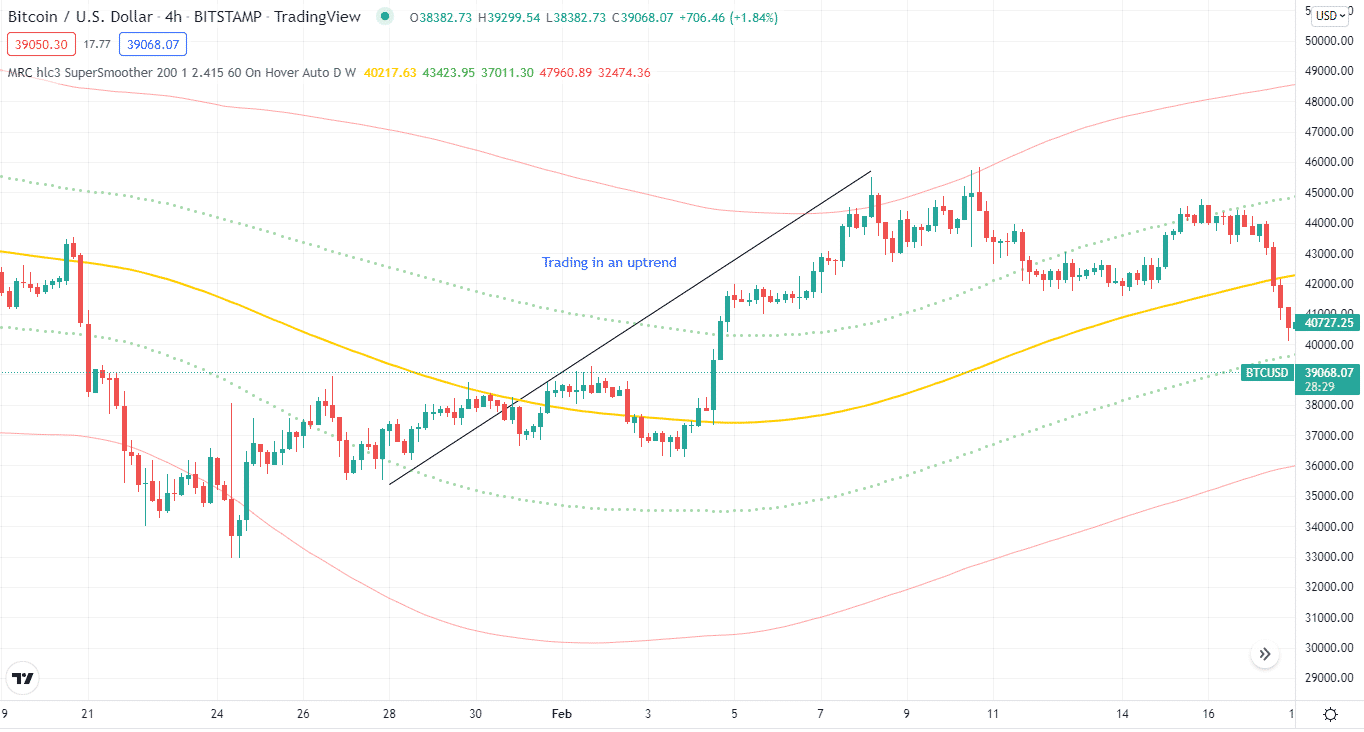
It’s an opportunity for us to enter a trade at a pullback. We can either buy into an existing trade or start one from scratch.
Sell trades are carried out in the same manner as to buy trades. After falling, the price pulled back to the resistance level, concurrently entering the oversold area, another hint of a likely bounce off the level.
How avoid the mistake?
When the price comes back to the broken level in an uptrend, it enters the oversold zone, another sign that sellers are losing power and new buyers are stepping in.
In a downtrend, on the other hand, when the price rebounds to the broken level, it enters the overbought territory.
Tip 5. Trading overbought and oversold levels
Using a Mean Reversion indicator to determine the dominating trend on a higher time frame is one of the most common strategies to trade overbought/oversold levels. Then, using the indicator, find trade entry points in the direction of the trend on a lower period.
Why does it happen?
The chart below BTC/USD is in an uptrend on the daily chart. The 60-minute chart below shows many purchase entry points when the price is below the bottom line.
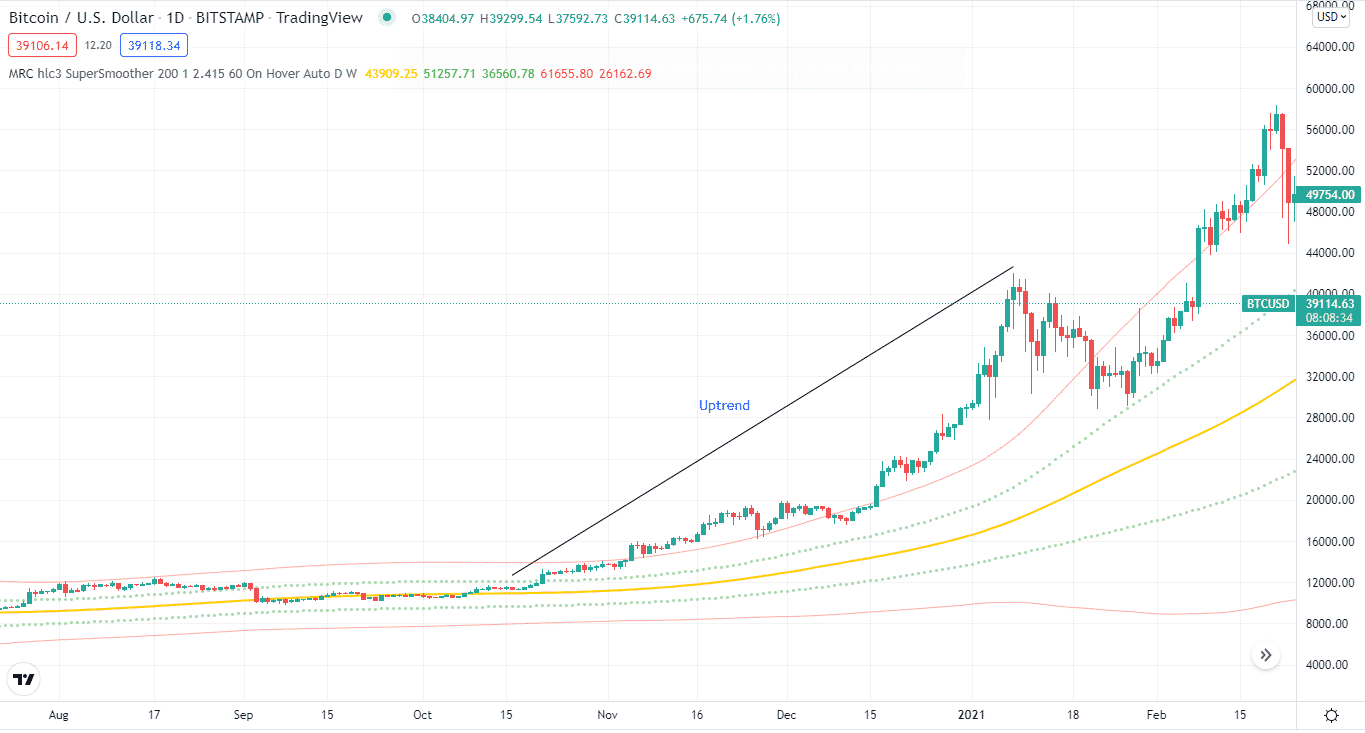
It’s worth noting that, even though the price is frequently above the upper line, it’s usually better to follow the trend and wait for another buying possibility below the lower line.
How avoid the mistake?
When the price is overbought or oversold on the lower period, you can take advantage of both aspects by trading in the direction of the dominating trend.
Final thought
Mean Reversion indicator is hard to master, but it’ll make life a lot easier for you once you do. As the tool forms a channel, you can combine it with other momentum indicators like the RSI or MAs.


