The ROC is a popular momentum oscillator, measuring the price change within a defined period. The indicator calculates the percentage change between two prices; one is the recent price and the other the previous price.
Like many other momentum indicators, the ROC has a single line suggesting trading signals. This guide will dig deeper into ROC and the top five tips for crypto trading with the indicator.
What is the rate of change (ROC) in crypto trading?
The indicator is used to figure out how much the price has changed between now and a certain number of periods ago.
The ROC is compared to a zero line distinguishing between positive and negative numbers.
- Negative numbers below zero indicate selloff or downward momentum.
- Positive values above zero indicate upward buying pressure or momentum.
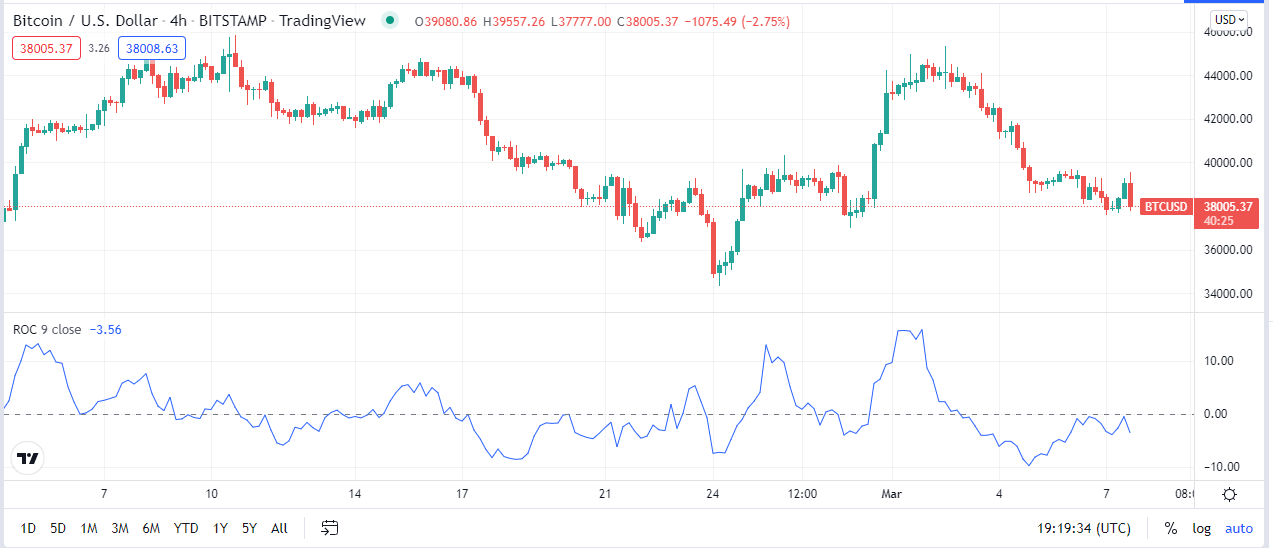
ROC contains overbought and oversold zones, just like other momentum indicators, which can be changed depending on market conditions. The current price is compared to the price “n” times ago in the ROC calculation. As the rate-of-change swings from positive to negative, the plot produces an oscillator above and below the zero line.
Top five tips for trading with ROC
Here are the top five tips for trading with the indicator to make a good profit and avoid mistakes while trading in crypto.
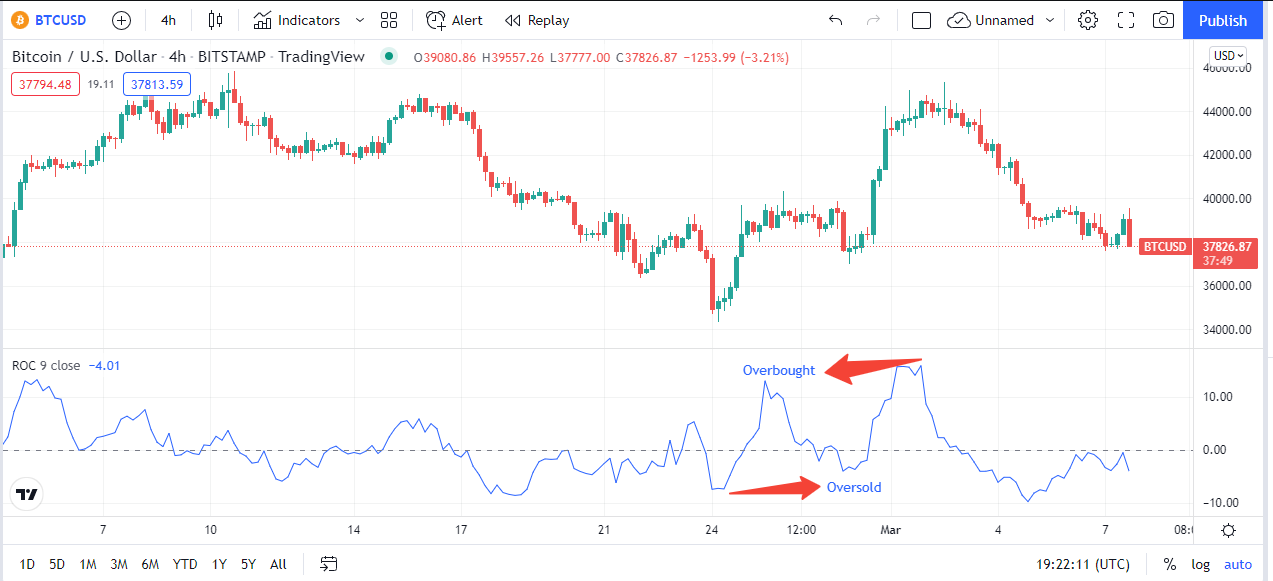
Tip 1. Determining overbought/oversold levels
Momentum indicators help the trader figure out when the market will change direction. This is because momentum is usually a sign that a trend will continue.
When a market trend starts to fade, it’s a good idea to go against the flow and buy the opposite. Peaks and troughs might happen when a certain percentage change has been made. This way, you can figure out if you’re in overbought or oversold situations.
Why does it happen?
Price changes fall into three main groups: upward, downward, and sideways. It’s best to use momentum oscillators when the market moves in a straight line with many small changes.
Extremes and turning points will be easier to find because of ROC in crypto. It is possible that prices also change when the market goes up and down. Pullbacks happen many times, and they happen based on how long it has been since the start of the coin or how much it has changed.
How to avoid mistakes?
An increase in the ROC signifies a significant price increase. Conversely, a steep price fall is indicated by a downward drop.
Percentage change, time, or both can be used to determine when the peak times will be. It’s possible to use the ROC to look for times when the percentage change is close to a level that has previously signaled a change in a price change.
Tip 2. Look for potential breakouts
A breakout will happen when the market has a lot of momentum, and ROC is the sign to look for. If there is a significant rise or fall in the price, the breakout trend will continue, and market direction will allow you to buy or sell.
Why does it happen?
Breakouts happen when the price has been stuck at a certain level for a long time. As a result, many traders use the resistance or support level as a boundary when setting entry points or stop loss points.
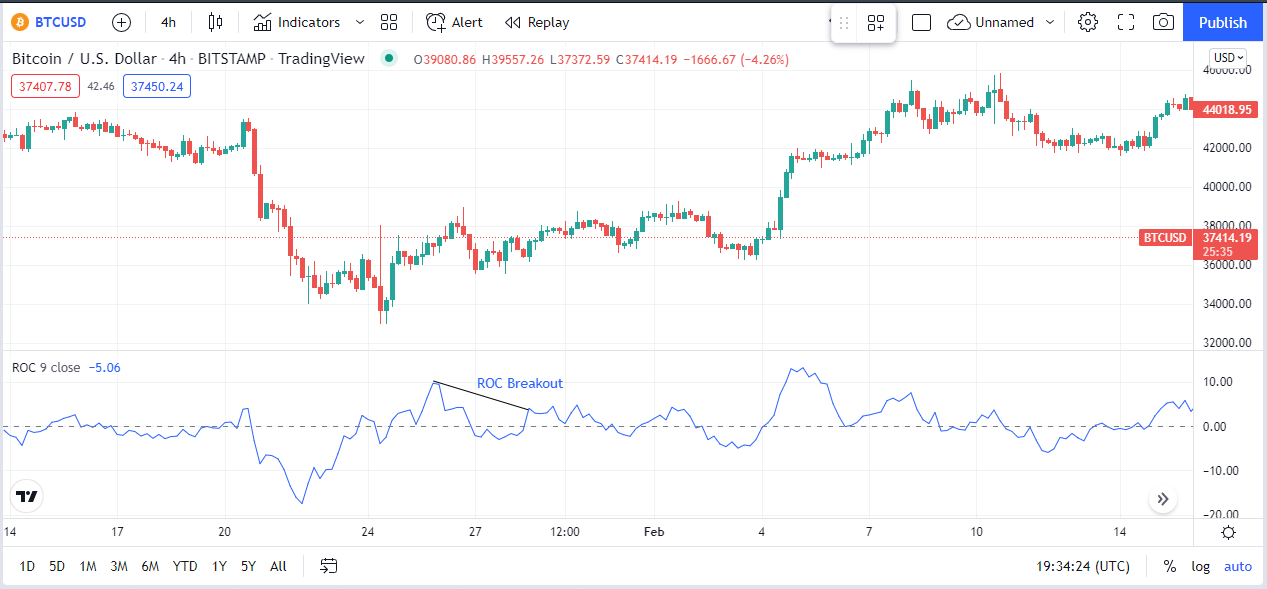
A valid trend line should connect two or more trend-defining support points.
When we see a trend line break, we have two options:
- Based on the breakout, we might enter the trade.
- We might wait for the previous rate-of-change trend line to function as resistance or support.
How to avoid mistakes?
This strategy will not be successful if you start plotting trendlines on lower time frames. There’s too much noise, and you’re more likely to get whipsawed.
You must also establish a major trend to improve your chances. Therefore, breakouts of trend lines in the direction of the main trend are what I prefer.
Tip 3. Zero line crosses
Zero-line crossovers can signal trend changes. These signals may appear early in a trend reversal or late in a trend change (big n value) depending on the n value employed.
Why does it happen?
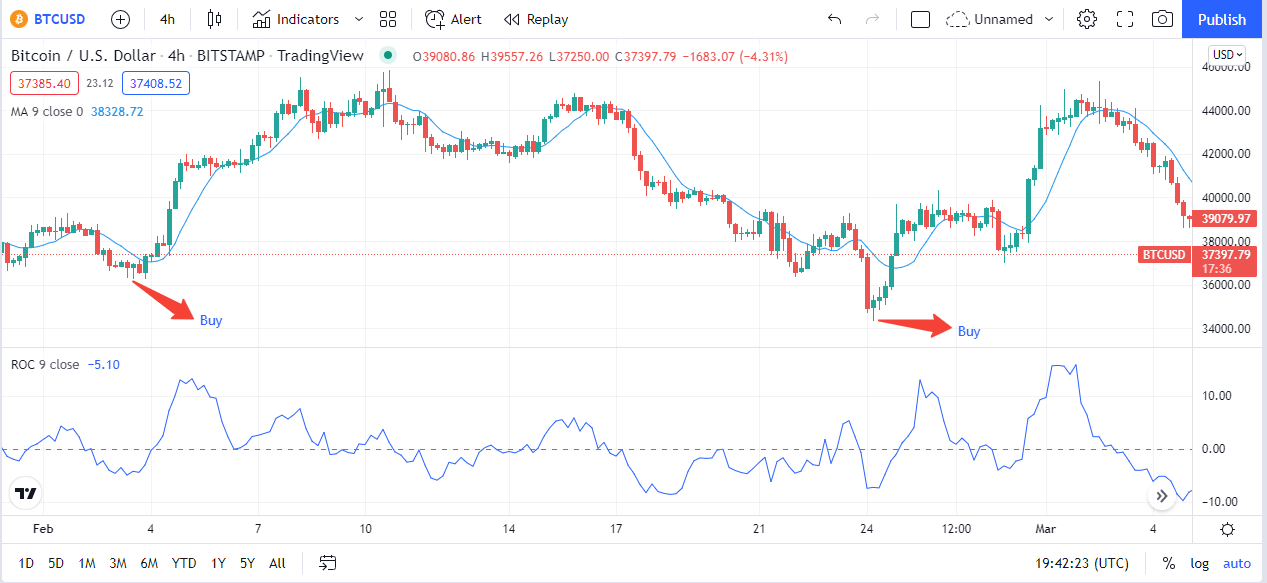
A breakout in either direction shows that momentum is building or waning. When used with other trend indicators, the ROC can help you find some great market opportunities.
When combined with a moving average, the ROC offers two great market entrances when the line passes below the zero-line, as shown in the BTC/USD chart below. The rate of change, like other oscillators, performs best in a trending situation.
How to avoid mistakes?
Whipsaws are common on the ROC, especially near the zero line. As a result, this signal is typically not utilized for trading but rather to notify traders of the possibility of a trend change.
Tip 4. Trading with divergences
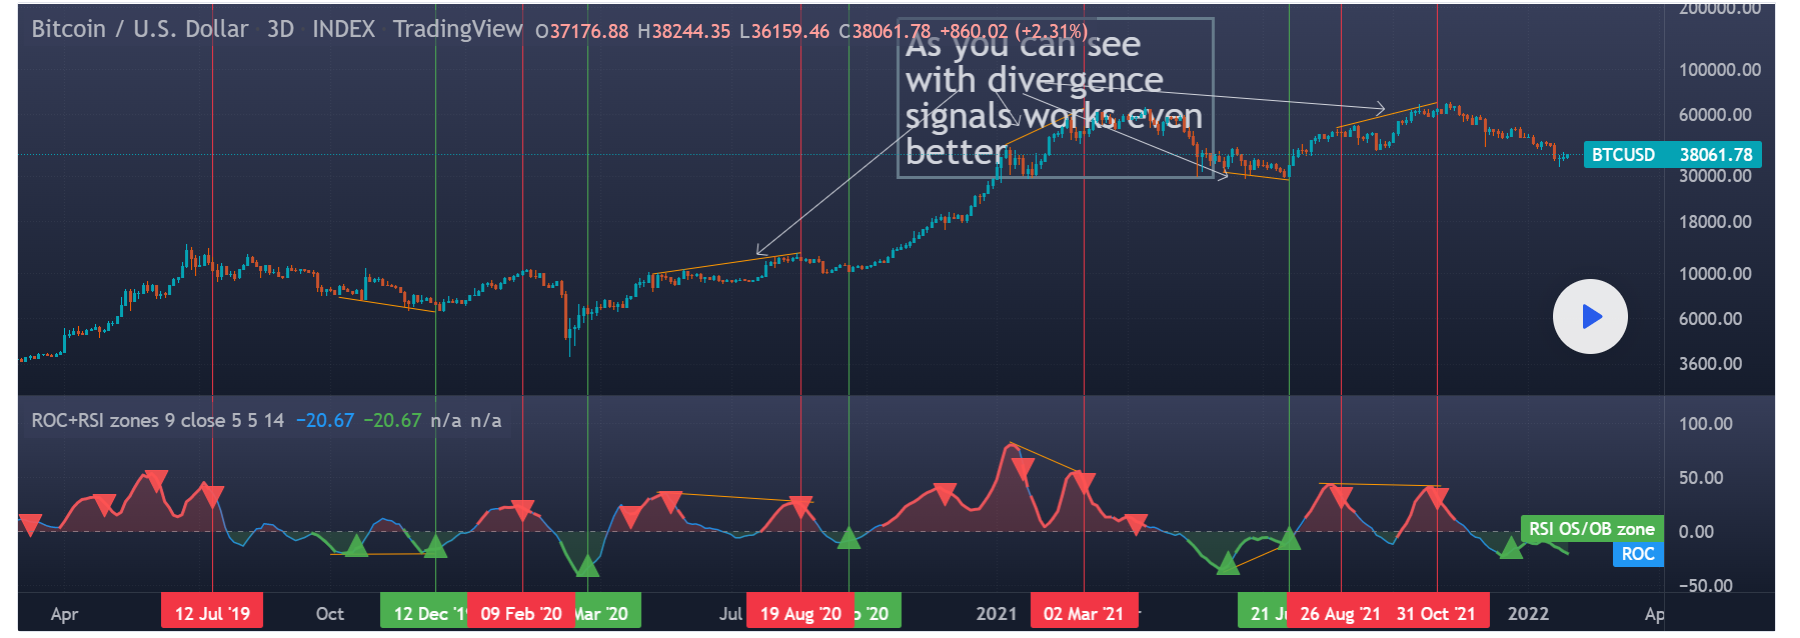
ROC indicator can show signs of divergence, which traders use to find market turning points. Traders who favor the bulls see a bullish divergence when the price makes a lower trend.
The market is in a bearish divergence when the ROC indicator shows that the price increases. But the ROC shows that it is going down. Therefore, a lack of strength in the rising trend will show that the market is about to go down.
Why does it happen?
It can indicate a possible divergence and signify a correction when the oscillator produces a new low, but the price does not or sets a new high, but the oscillator does not.
Traders can use this information to apply the price rate of change and search for price divergence.
How to avoid mistakes?
Divergence is a famously bad timing indicator because it can linger for a long period and doesn’t necessarily lead to a price reversal.
A trader can apply the indicator with other indicators like the moving averages. Or they can wait for the price correction to be completed and then enter long into the trend.
Tip 5. Trend trading
This is one of the simplest tips you can apply for crypto trading. As the ROC creates overbought/oversold levels, you just trade with the direction of the trend.
Why does it happen?
The recent trend and its strength can be confirmed by the slope of the ROC and its actual readings.
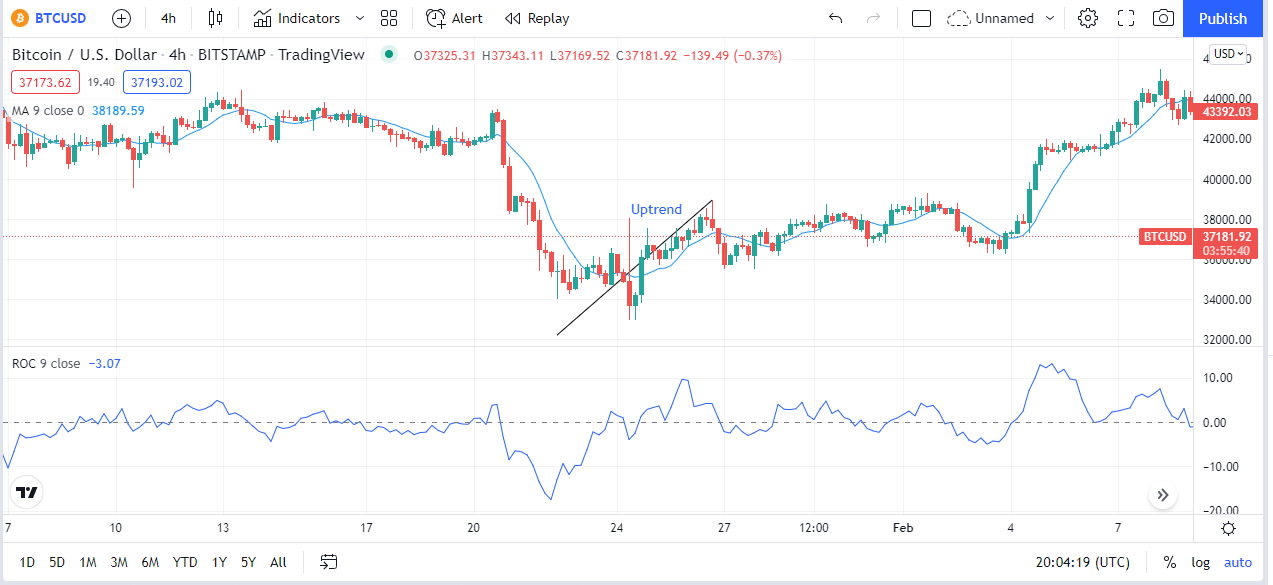
High buying or selling pressure is indicated by a steep slope of the ROC, which may not be consistent. This does not rule out a reversal, but it does suggest that a price retracement is possible. Traders could wait to buy or sell at a lower or higher price level in this situation.
How to avoid mistakes?
When the rate of change is going down but is still below the zero line, the downward trend is picking up speed. So, closely look at market fluctuations before making a trade to avoid mistakes.
Final thoughts
ROC is one of the essential momentum indicators out there. It helps to detect overbought/oversold levels and divergences. The indicator works best when combined with other indicators like the moving averages.
