Moving averages (MA) are technical tools used by every trader. Because of the average price movements, MAs can show the actual trend in a given time frame.
The family of moving averages is significant and is continually growing. The types or versions could count from hundreds to even thousands. The number is increasing because technical traders are continuously searching for the perfect calculation that achieves the best balance between smoothness and response.
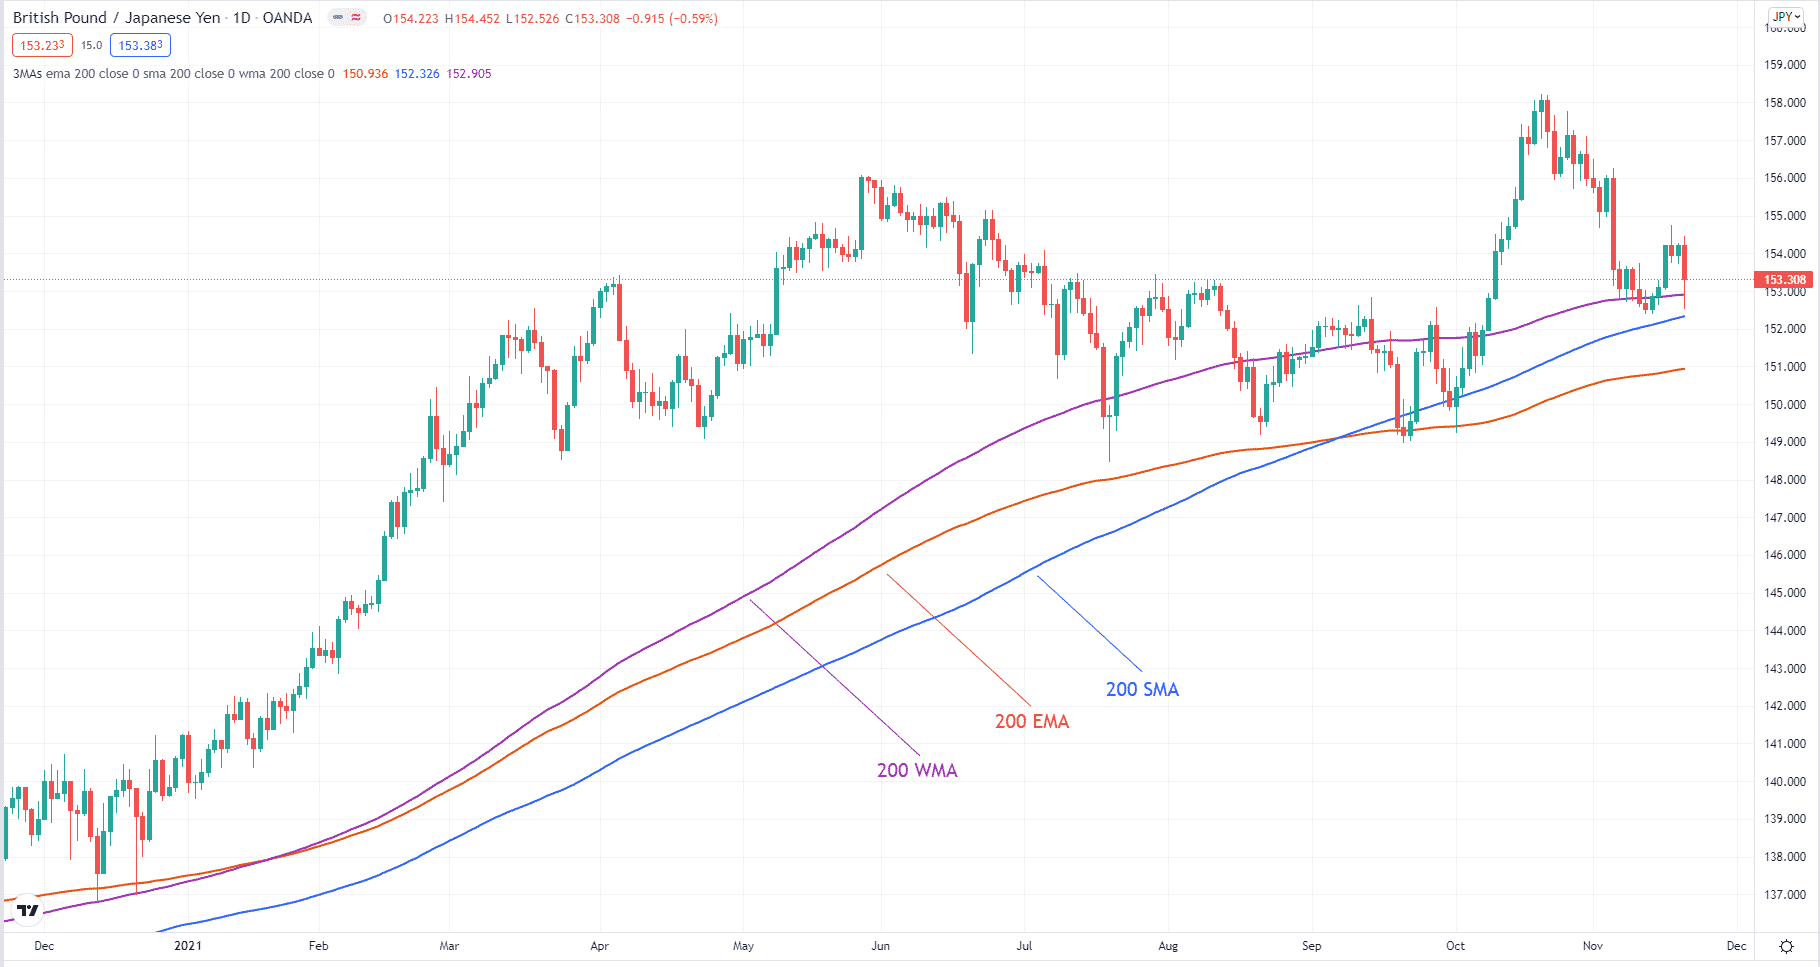
Among the common types is the weighted moving average. While WMA has a similar concept as EMA, the calculations are different. If you apply same-period WMA and EMA on the same chart, you will see that WMA is a bit smoother than EMA and stays closer to price. Whether you use WMA, EMA, or any other type, the decision often depends on personal preference.
Why would anyone care using WMA then? Apart from personal choice, take note that WMA is smoother than EMA. If you play around with the periodicity, you might find something interesting that no one has ever found. Let us examine WMA in more depth in this article and learn how to trade with this indicator.
What is WMA?
WMA differs in calculation from its siblings EMA, SMA, and others. In WMA, calculation emphasizes recent data than past data. For instance, when computing 50 WMA, the indicator gives more importance to recent prices and continually less importance to older prices as computation moves to the left of the chart.
As a member of the moving average family, WMA works differently from the other members. Because of its unique calculation, WMA reacts quickly to price changes. Such sensitivity could be good or bad, depending on the situation. The upside is that WMA can tell you more rapidly that a trend exists or is changing than an SMA does. The downside is that it could give you more false signals than an SMA.

How to trade with WMA?
One way to trade WMA is to use it as a trend-following tool. The game plan is to open a trade in line with the trend and keep it open until the trend reverses. This strategy is straightforward, but you must take a process approach to ensure consistency. Implementing this strategy follows these steps:
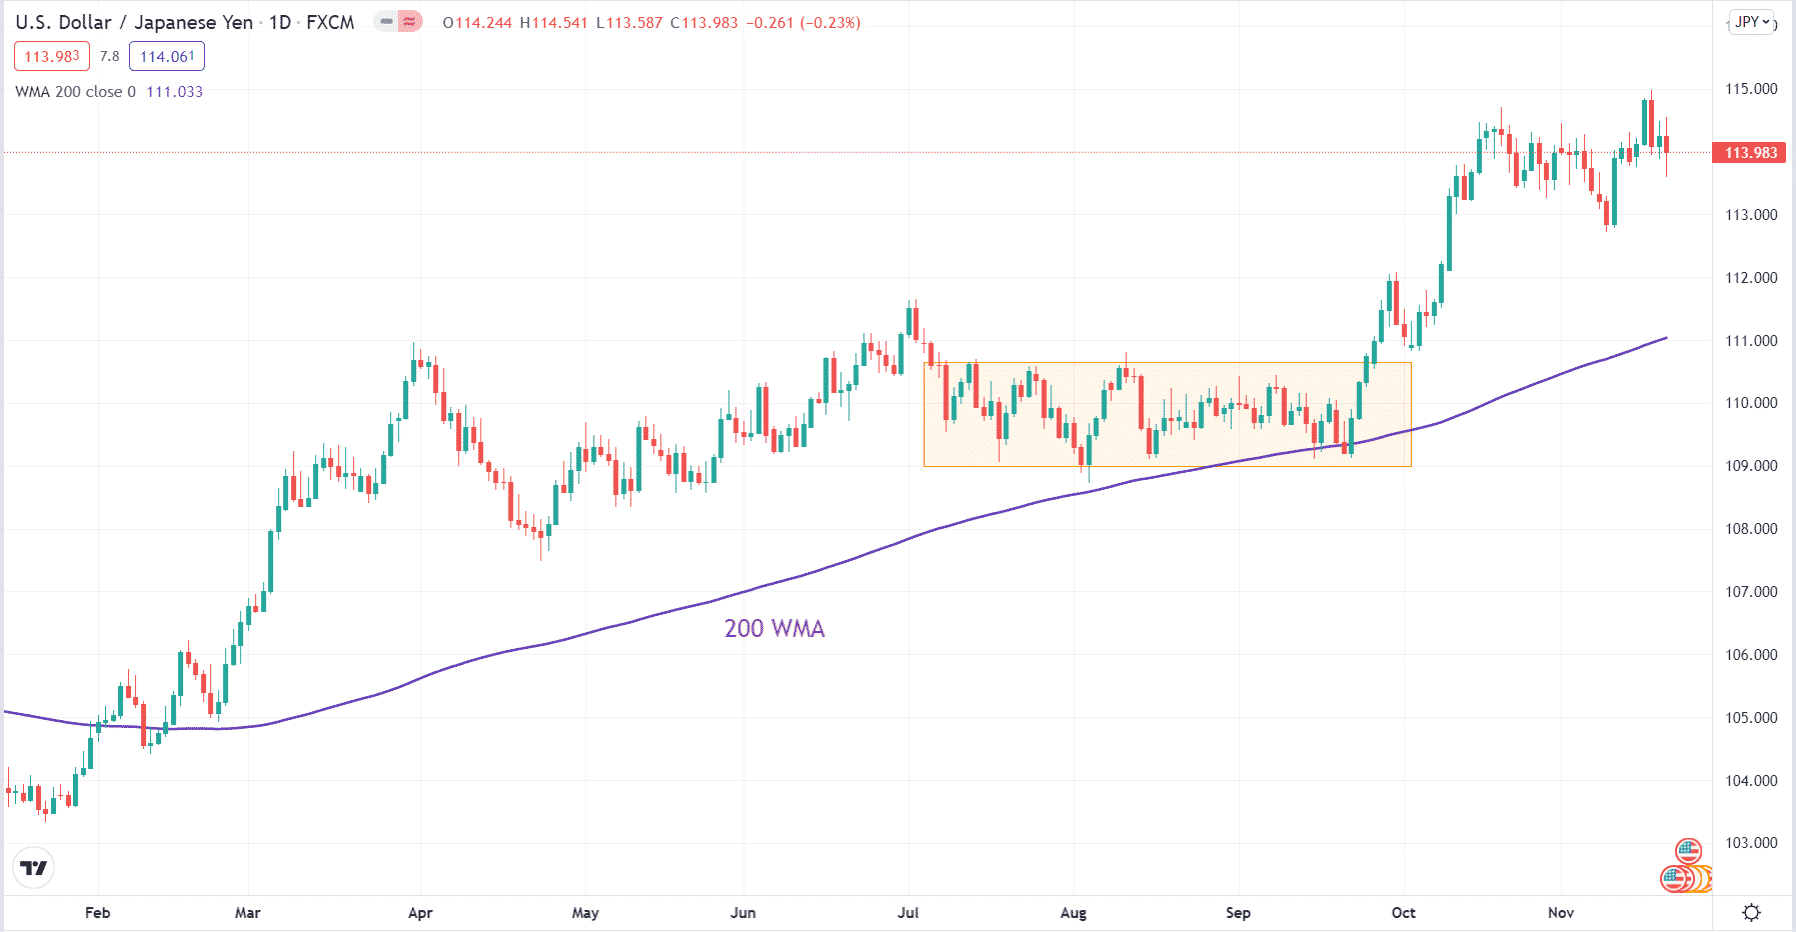
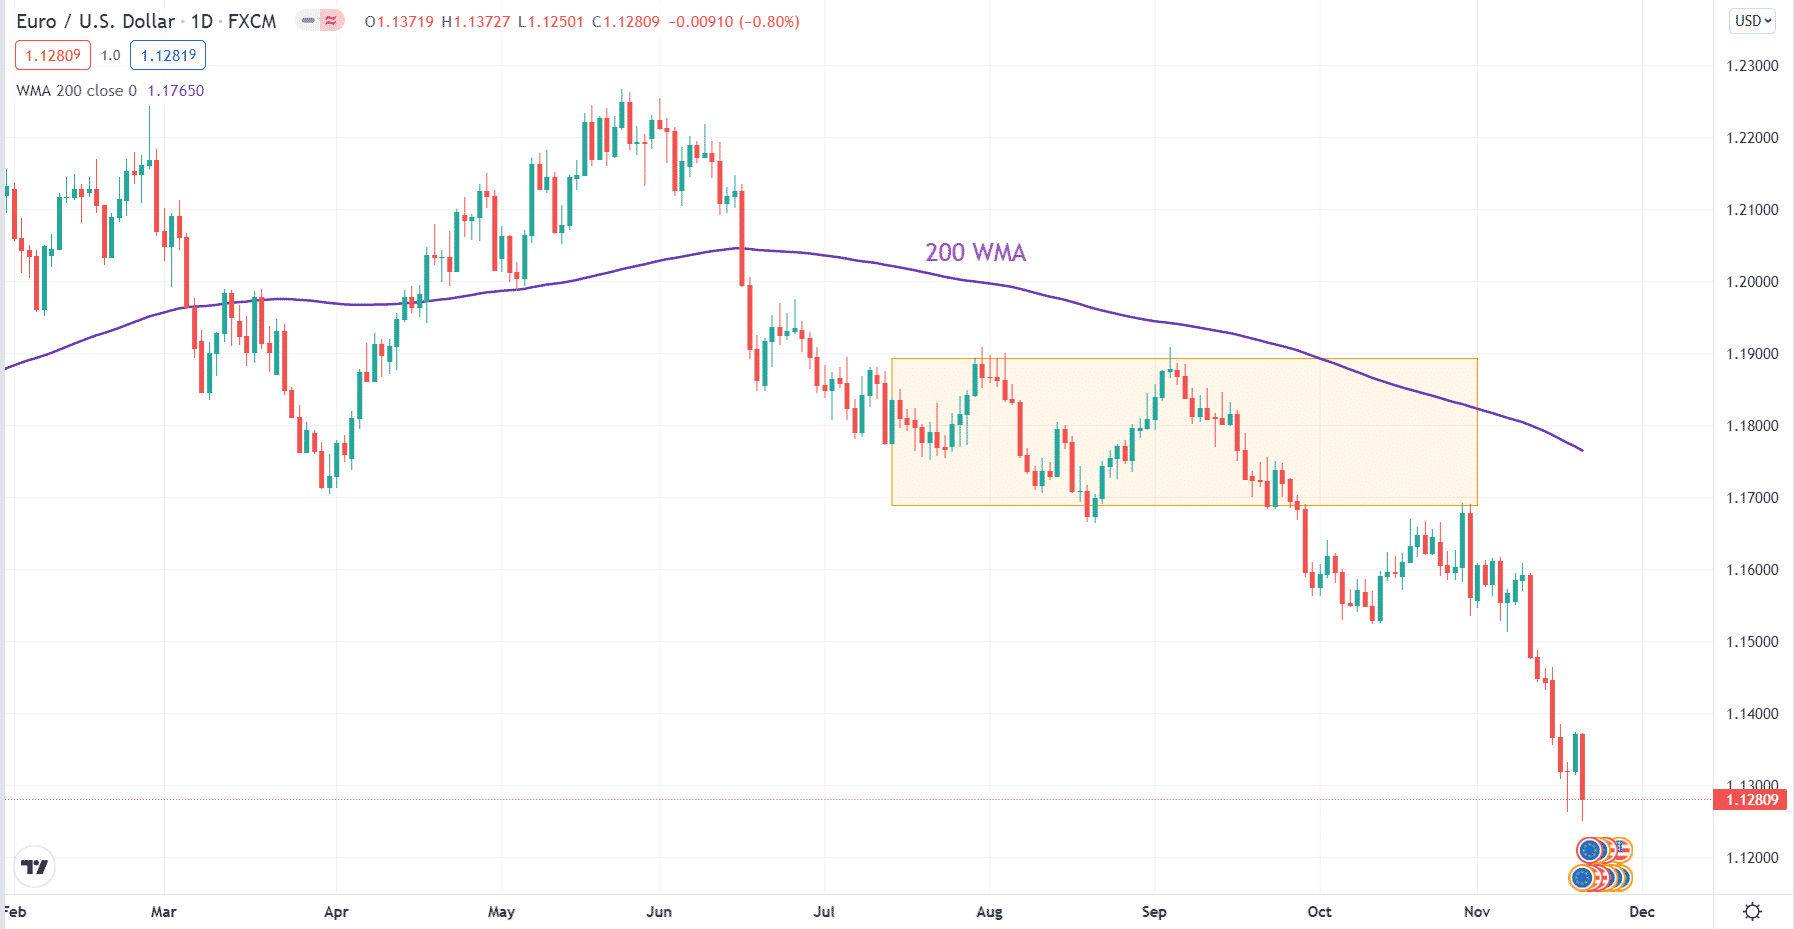
- Check if a pair is trending. You can use the 200 WMA for this purpose. A pair is trending up if the price is above the 200 WMA and trending down if it is below the 200 WMA. The trend does not exist if the price moves up and down the 200 WMA.
- Wait for the price to enter a range. You can say that a market ranges if it has at least two touches at the bottom and the top. Use a rectangle to draw the range.
- Wait for a breakout of the range. Preferably, you want the price to break out in the direction of the trend. If not, it is better to pass on the trade.
This trading methodology tries to accomplish a few things for the trader. The goal is to enter high-quality trades. We want to avoid trading on a whim, so the entry must be clearly defined. We also want to prevent losses due to opening trades at the end of the trend. We want to enter when the trend has just started and is likely to continue.
Bullish trade setup

The above graphic shows the daily chart of USD/JPY. The trend is generally up in this window since the price stays above 200 WMA after it crosses on the chart’s left side. After some time, price forms a trading range. Eventually, it breaks above the upper range. Right after, you can enter a buy trade, put the stop loss on the lower range, and trail your stop. You can use a fixed take profit, but a trailing stop is dynamic and can be set to run on autopilot.
Bearish trade setup

The above picture shows the daily chart of EUR/USD. This is the current condition of this pair at the time of this writing. In this view, you can see that the trend is down from the middle portion of the chart to the right. After a while, the price enters a range. Eventually, it breaks below the lower boundary of this range. Immediately after, you can initiate a sell trade, put the stop loss on the upper range, and trail the stop. You can use a fixed target, but a trailing stop is better if you want a dynamic exit strategy.
How to manage risks?
The easiest way to manage risk is a stop loss. This is applicable regardless of your trading experience. For beginners, trading with a stop loss can help preserve your account from sudden burnout. For experienced traders, a stop loss can keep their long-term profitability even in a losing episode.
The lot size of the trade is the most critical part. However, the lot amount depends on the distance of your entry to your stop loss. One important decision you must make is the percentage of your account you will risk in every trade. This percentage will serve as a basis in determining the risk amount. When you have all these figures, you can compute the optimal lot size to keep the trade risk low.
Final thoughts
There are many ways to trade forex. Often, trading strategies involve using one or more moving averages. Depending on the system, WMA may or may not be part of those tools. You can use WMA instead of the more common SMA or EMA if you want a unique system. Besides, you can obtain a WMA that looks very much like an EMA or SMA. The trick is playing around with different periods.


