Ichimoku is a popular technical tool for price analysis and forecasting. Like candlesticks, Ichimoku’s origin is also from Japan. However, unlike other specialized tools, traders believe that Ichimoku is one of the best indicators with too high precision and is not lagging.
What is Ichimoku Cloud?
In any technical analysis, the upside or downside of price is forecasted through potential reversal levels. Therefore, they are the necessities for the traders because their primary trading decisions depend on these levels.
Ichimoku Cloud is another way of drawing support and resistance zones on the price chart. However, it is dissimilar to other tools as it informs traders about the movement and the direction. The cloud construction includes several averages intrigued on the chart applied to foresee the future projection of price.
Goichi Hosoda, who created the Ichimoku Cloud, was a Japanese journalist. He introduced the statistical tool to the realm of trading in 1960. It is a further advanced tool than the traditional candlesticks because of numerous data points. Although it looks complex at the start, a newbie may not be accessible at interpreting the tool.
How to calculate Ichimoku?
You can place Ichimoku Cloud on your chart through any charting package. No manual calculation is required to do this. First, however, you ought to know the logic of the tool.
Here are phases to do so:
⦁ Compute the Kijun Line and Tenkan-Sen.
⦁ Based on previous computation, determine Senkou Span A (26 periods) ahead into the future.
⦁ Similarly, compute the Senkou Span B (26 periods) forward into the future.
⦁ Now compute the Chikou span (26 periods) back into the historical data.
⦁ The variance concerning Chikou and Senkou spans generates a cloud. The cloud changes its color when one span exceeds the other in either direction.
The above points form a single data point while restarting the process will generate many data points, and connecting those references will result in the appearance of a cloud.
Analyzing the clouds
The Ichimoku Cloud provides you with all the details in a single glimpse:
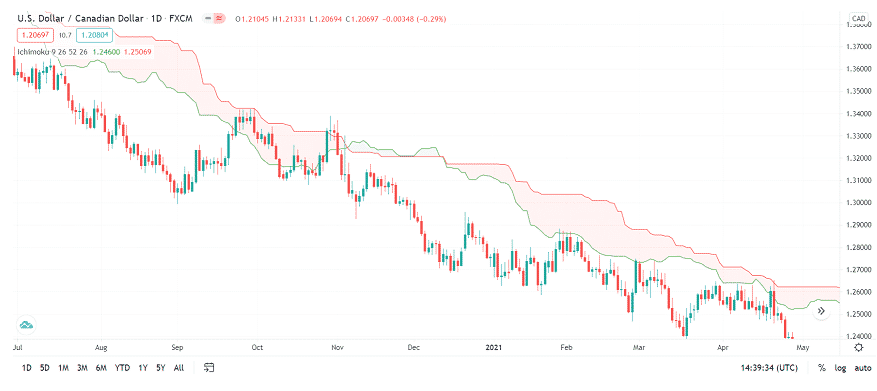
- If the value of a trading instrument is above the cloud, it reflects an uptrend.
- If the value of a trading instrument lies under the cloud, it is a sign of a continued downtrend.
- Moreover, the price is considered choppy and consolidating if it is wobbling within the cloud.
You can get the confirmation of a bullish trend if you see a Senkou Span A moving upside beyond the Senkou Span B. Contrarily, you may ratify the bearish trend if the Senkou Span A declines under the Senkou Span B. Thus, the Ichimoku Cloud functions as a potential zone for support/resistance. However, it is subject to the comparative value of the trading instrument.
You can also apply crossovers to analyze the recent trading bias. For example, you may see a crossover of the Kijun Line with the Tenkan-Sen at any instance. This reflects a sign of potential trend reversal.
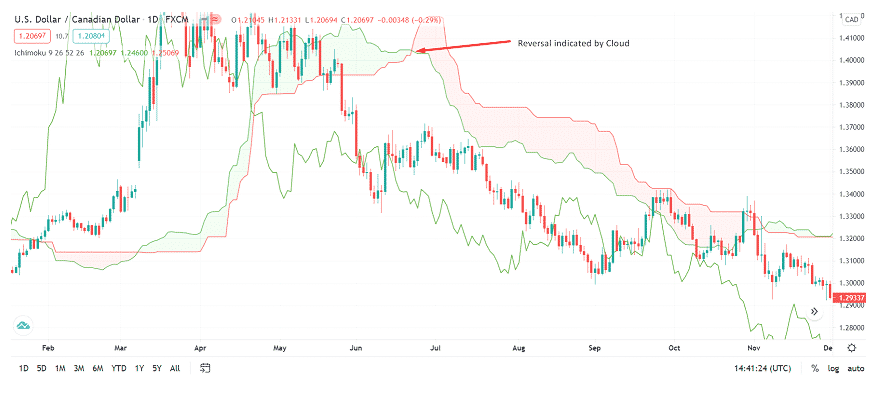
How to trade with the Ichimoku cloud?
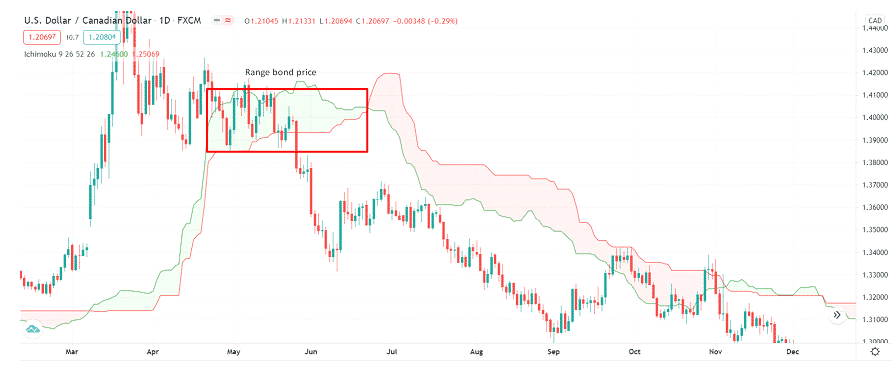
Let’s consider the chart of USD/CAD. It shows a squeezed cloud with horizontal movement. The reason is range-bound price behavior.
For aggressive traders
The Ichimoku Cloud functioned as a dynamic zone that provided resistance throughout the downtrend.
- Finally, the price broke the cloud and went beneath the red line.
- It indicated the confirmation of a fresh downtrend.
- Whenever the cloud is pierced, it allows the buyers/sellers to look for a long or short trade entry.
For low-risk traders
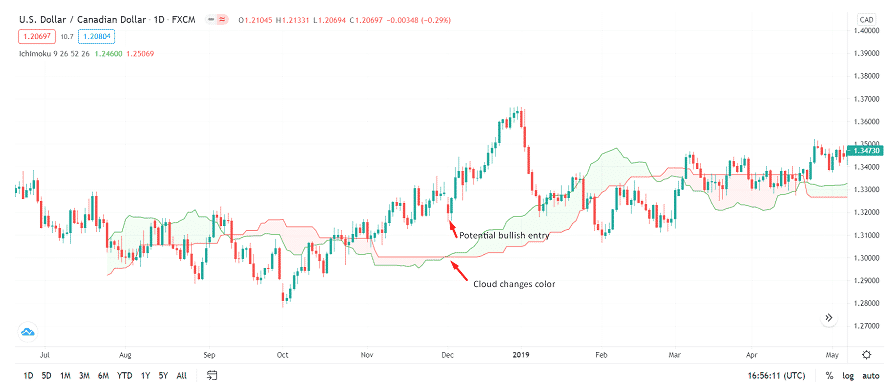
As you already know, the green-colored cloud shows a bull run while the red-colored cloud reveals a bear run. Therefore, a low-risk trader will prefer to enter long or short as soon as the cloud changes its color.
Have you seen the USD/CAD chart?
The cloud changed its color to green and indicated a trend reversal. Thus, it was an excellent long trade entry. However, you could enjoy an earlier entry when the bearish cloud (red-colored) pierced the upside. But the risk of drawdown also remains high in such setups.
It is recommended not to use Ichimoku Cloud alone. Instead, you should apply it in combination with other lines of the tools because these lines help you forecast a trend reversal way earlier than the cloud. In addition, these lines can make a crossover and indicate a bullish or bearish trade opportunity, while clouds can help to scale up your trading further.
Limitations of Ichimoku Cloud
The indicator may create a fuss on your charts. Many newbie traders would not like it. However, the solution is available in charting packages. You can disable the lines that you don’t need. However, you may struggle to channelize your Ichimoku-based trading strategy.
Critics of the indicator claim that it only plots the averages on the chart. The nature of the indicator is not predictive. Even though the data points are intriguing into the future, they still don’t help in forecasting.
Another drawback is that the cloud may lose its relevance on broader timeframes as the price stays too far in either direction. In such instances, the Kijun Line and Tenkan-Sen become more critical.
