The Ichimoku Cloud, aka the Ichimoku Kinko Hyo, is a critical technical indicator that first appeared in the 1930s. Goichi Hosoda developed it.
However, it found its spotlight in the 1960s, and since then, it has been one fon the key technical indicators of the financial markets. The indicator is still quite popular in Japan, and there is a belief that it performs best when used on Japanese yen currency pairs.
This guide will dig deeper into the indicator and the best tips for crypto trading with this tool.
What is Ichimoku Cloud’s strategy?
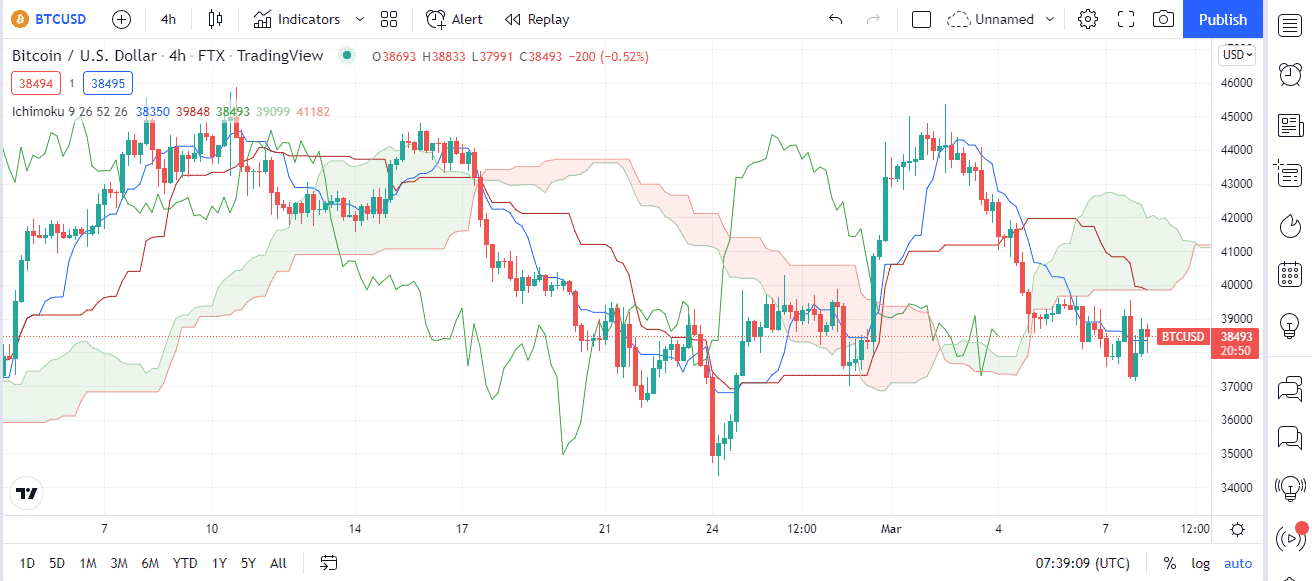
It comprises three moving average (MA) lines, which creates a cloud, which forms basically between the two lines. These are known as Leading Span A and B. These lines are also referred to as Senkou Span lines. The cloud edges act as support/resistance. As prices move, the cloud alters its size and form.
- The market trend is bullish when they move above the cloud.
- The trend is bearish when prices fall below.
- If the price travels between the clouds, it is a neutral trend.
Top five tips for trading with the indicator
Here are the top five tips for dealing.
Tip 1. Identifying breakouts
There is a wide range of approaches to do this. However, breaking above or below the indicator means that there has been a significant change in market sentiment.
Why does it happen?
We will stay in the trade when the price moves in our favor until the blue Kijun Sen is broken oppositely. The following is how this trading method works.
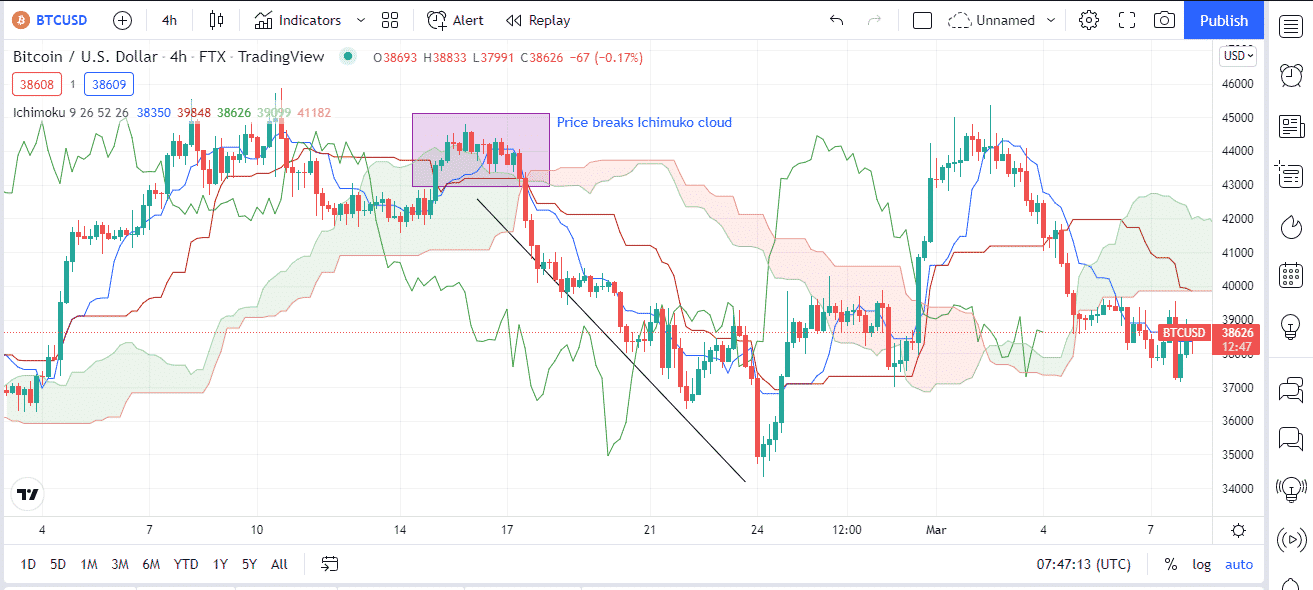
The illustration shows that this pattern setup can trade a traditional downturn. The price activity on the chart starts below the orange cloud. On the chart, this indicates a sell signal, and an Ichimoku trader would attempt to short the BTC/USD.
How to avoid mistakes?
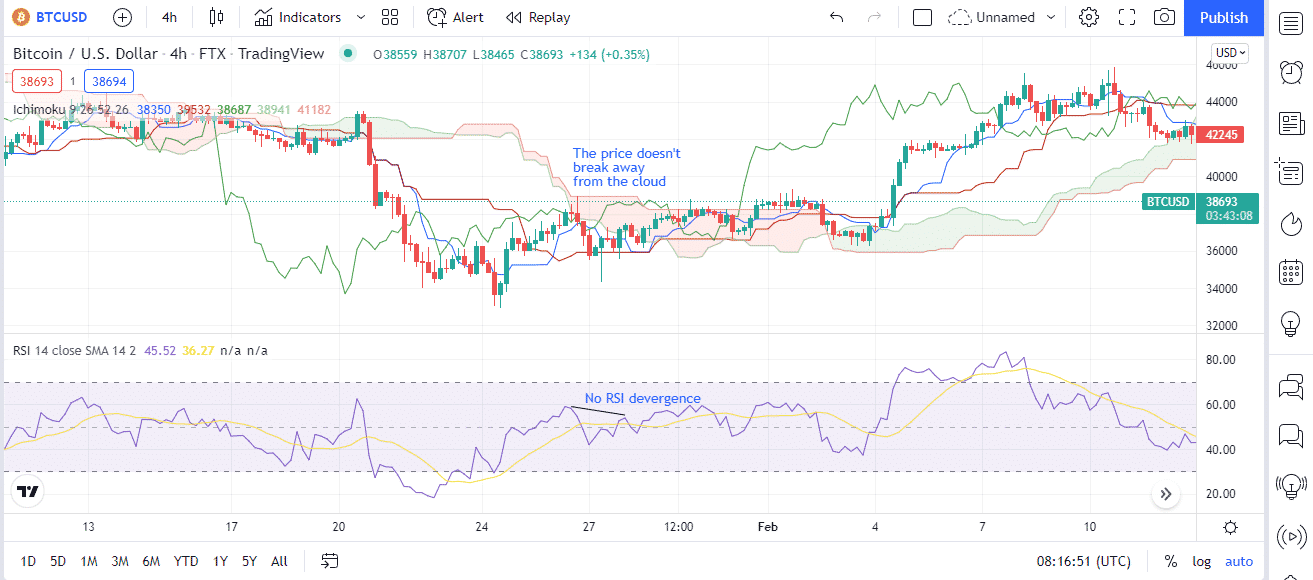
Whenever the price is within the cloud range, it is prone to market noise. It happens so that sometimes the price doesn’t go in a downtrend or uptrend. Even if the price breaks through the cloud.
Here traders should confirm signals with the help of additional indicators like the RSI.
Tip 2. Highlighting key crossovers
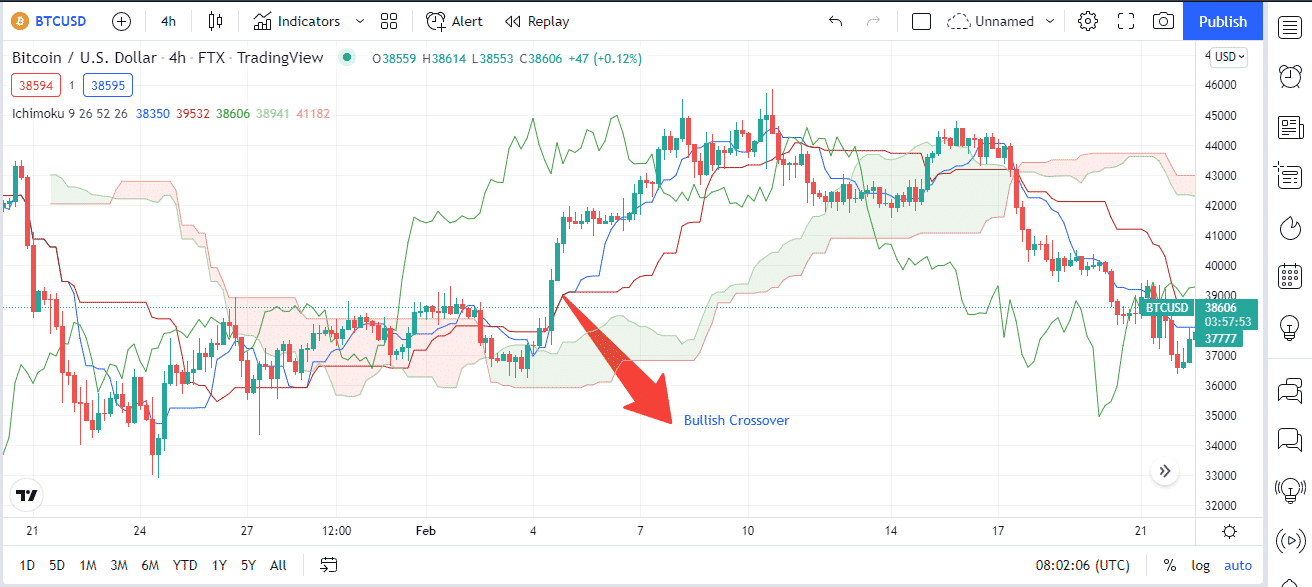
Crossovers work best with the Ichimoku. If you highlight key crossovers, the indicator presents good buy/sell opportunities. What you need to do is find coercion and baselines. The crossover occurs when the conversion lines go above/below the baseline.
Why does it happen?
When the two lines cross in the direction of upward movement, it may indicate that the price will enter a new bullish trend. Similarly, a crossover between the two when the market is heading lower could signal a new bearish trend.
Below is a great example. We got a crossover when the blue conversion line goes above the base one, giving us a bullish crossover.
How to avoid mistakes?
It is easy to apply crossovers with the cloud. The price of BTC/USD must be going in either an upward or declining direction to apply this approach. It can’t be utilized during a consolidation period.
Turn off most of the Ichimoku Kinko Hyo save for the baseline and conversion to get the most out of it.
Tip 3. Finding the bullish and bearish twist
Here’s something you can grasp easily with the Ichimoku. Long-term trading with a bullish and bearish twist works incredibly well.
Why does it happen?
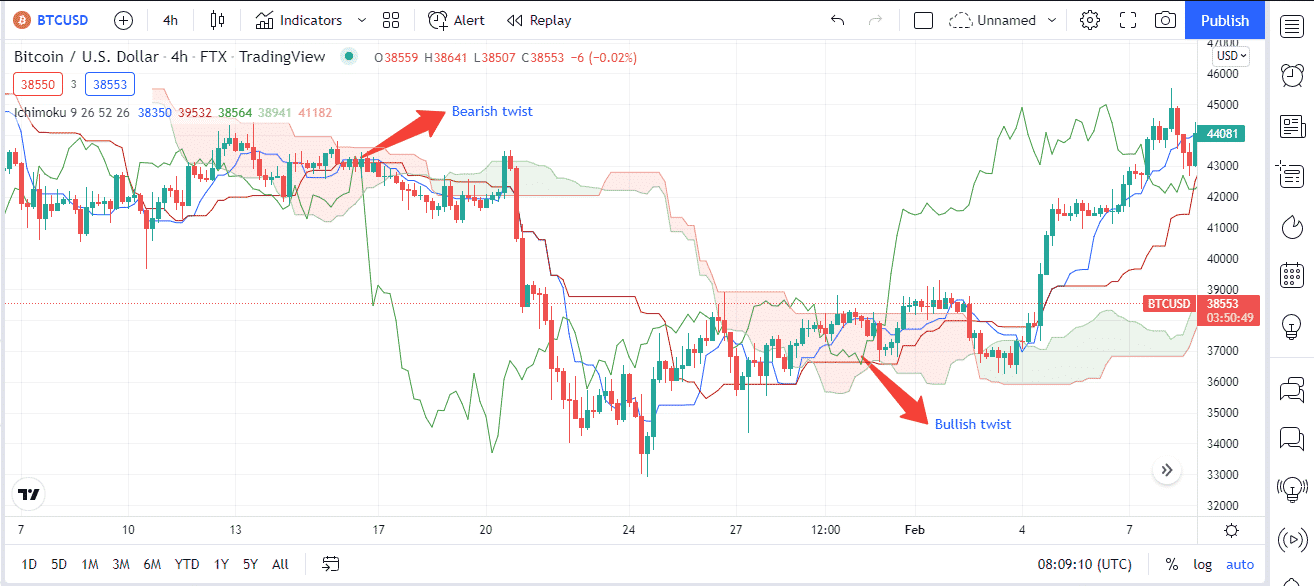
The Kumo twist develops when Leading Span A and B cross.
- Leading Span A goes above B’s a bullish reversal signal.
- On the flip side, when Leading Span A passes below B, it’s a bearish reversal signal.
How to avoid mistakes?
It’s important to note that the cloud will change colors from green to red when the Kumo twist occurs and vice versa.
Tip 4. Creating a confluence
Confluence involves mixing many trading tools and concepts to build a more reliable trading strategy. The RSI is our favored indicator, and it nicely complements the Ichimoku.
Why does it happen?
As seen in the chart below, it is feasible to discover high likelihood reversals by combining the RSI and looking for RSI divergences. For example, suppose the price crosses the conversion/baselines after an RSI divergence. In that case, a reversal is extremely likely, and it could even predict a lengthier trend reversal in the other direction.
How to avoid mistakes?
When riding trends with the indicator, it’s critical to know when the trend is gone and when a probable reversal signals a trade exit.
Tip 5. The simple support/resistance identifier
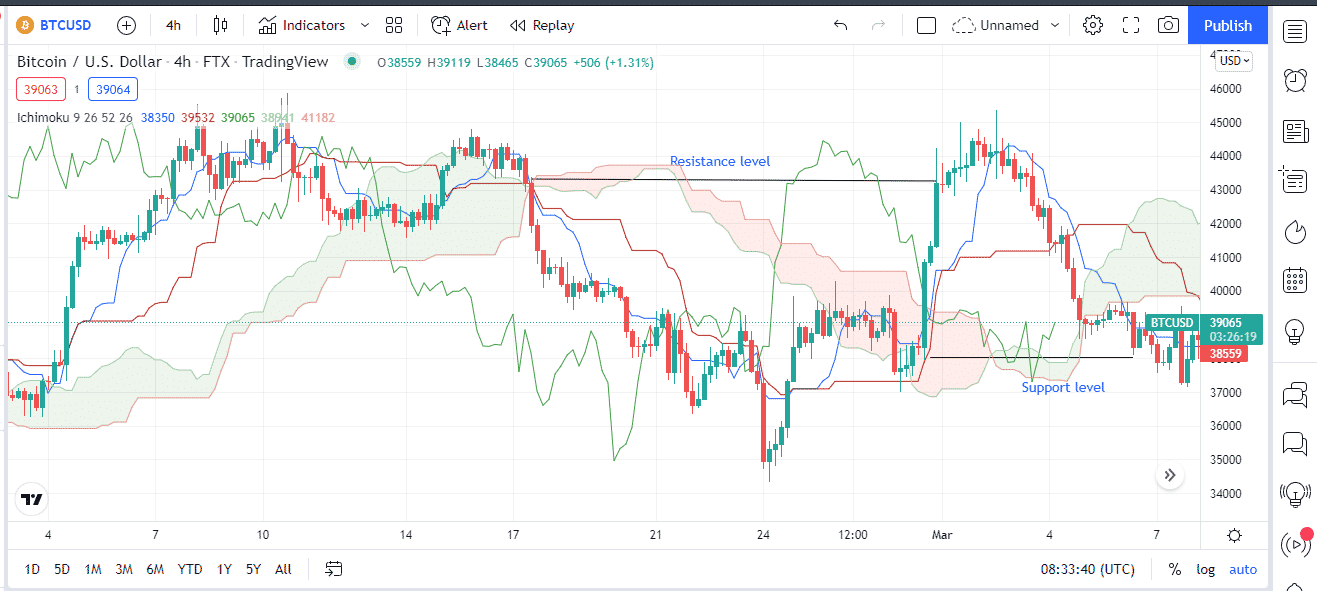
The cloud results from the range-bound scenario serve as major support and resistance barrier for a specific timeframe. Now that we’ve established it, we turn our attention to the Tenkan and Kijun Sen, which serve as the support and resistance identifier.
Why does it happen?
The Tenkan signifying a short-term MA and the Kijun serving as the baseline, the two lines work as a MA crossover. As a result, the Tenkan falls below the Kijun, indicating a downward trend, acting as a support level. Conversely, when the Tenken goes above the Kijun, it indicates an uptrend, thus signifying resistance levels.
How to avoid mistakes?
Because the crossover occurs within the cloud, the signal stays hazy, and an entry cannot be considered until the cloud has passed.
Final thoughts
Generally, the indicator is a great all-in-one tool that gives you a lot of data at once. It would help if you first mastered some jargon. However, the entry and exit points are evident once you’ve done so.


