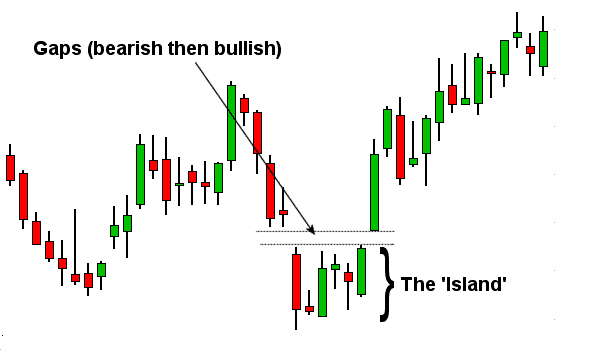
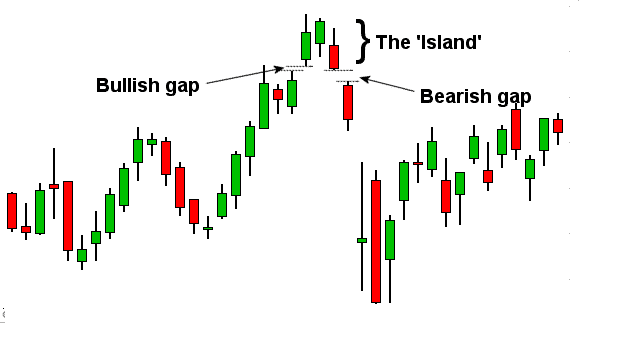
The Island chart pattern combines candlesticks that appear in the financial chart and provide an early trend direction. It usually appears before and after the market hour or during any critical news release. Here, the candle combination looks like an Island that encourages it to call an Island pattern.
Making profits from the Island pattern needs close attention to the price action and market momentum. It would be hard for traders to profit from this pattern without proper knowledge. The following section will see the complete trading guide on the Island pattern, including the exact buying and selling method. After completing this article, you will know everything a trader should follow in the Island pattern strategy.
What is the Island reversal pattern strategy?
The figure does not frequently appear in the FX trading chart, but traders cannot ignore its potentiality. It is a reliable method to anticipate the price movement from a reliable price swing. It is a combination of some candlesticks where the future movement is set based on the price gap and the combination of bars. The significant fact of the Island pattern is that it combines the price action and gap that shows the unexpected change in the market trend.
As a result, the Island pattern can generate bullish and bearish signals where the current price may show a reversal regardless of the existing market trend. Moreover, the position of the gap formation is important to find. You cannot open trades based on price gaps from a random place. Furthermore, the price action in this price pattern becomes usable once they appear at the top or bottom of a trend. It is a sign that bulls/bears have become confused about the existing market trend where the gap represents an immediate change in the market trend.
How to trade with the island pattern strategy?
Finding the Island pattern is significant as it consists of price gaps. It is available in bullish and bearish charts and both buy and sell signals. However, it is crucial to define whether it is a buy signal or not.
Identifying the bullish Island reversal pattern

The bullish pattern comes after the bearish market, and it is easy to spot in the naked eye. The primary condition of a bullish indication is that it should appear after a strong bearish movement. In this pattern, the gap works as a horizontal resistance level, and the broader market context is bullish if the price moves above the Island gap.
Identifying the bearish Island reversal pattern

It is easy to anticipate the selling indication in this pattern as it appears at the top of a bullish trend. Within a bullish trend, if any bearish market event happens with a quick movement in the price, it is likely to move down immediately with a gap, forming an Island pattern reversal pattern.
Bullish trade setup
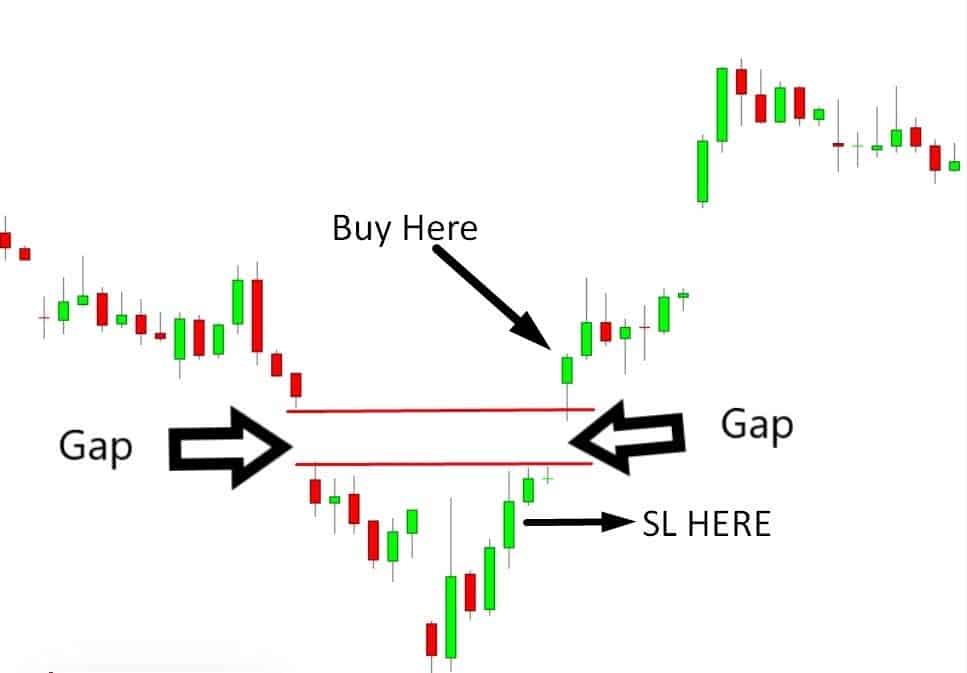
The Island pattern should appear at the bottom of a downtrend in the buy trade and show a buying interest by taking the price above a gap. In this method, it is essential to consider the gap’s presence. The buying entry will be valid once the price moves above the Island gap.
Make sure that the Island pattern is a part of trade only. You cannot open positions blindly with this. Further confirmations from price action or indicators are important to increase the trading accuracy of this strategy.

The above image shows how the bullish trade setup appears in the Island strategy. The buying entry is valid once the price shows a bullish rejection from the Island gap. You can consider the upcoming momentum essentially bullish until the price falls below the gap. Therefore, the stop loss should be below the Island gap, and take profit is based on the near-term horizontal resistance level.
Bearish trade setup
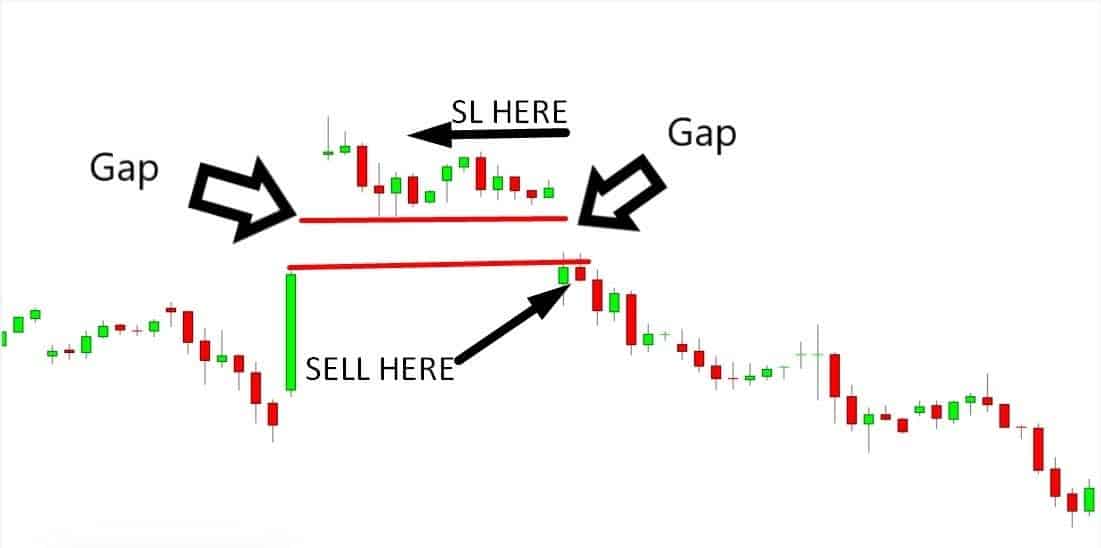
The bearish trade signal is the opposite option of the bullish method. In this method, the Island pattern should appear at the top of an uptrend and show bears’ interest by taking the price below a gap. Like the bullish setup, make sure to use other indicators and price action tools to complete the method.

The above image shows how to open a sell trade from the Island strategy. It is visible that the bearish opportunity is available once the price moves below the Island gap with a bearish price action tool. Make sure to wait for a bearish rejection candle to indicate a possible bearish opportunity in the price trend. In that case, the stop loss is above the gap with some buffer, and take profit is based on near-term support levels.
How to manage risks?
Indeed, you cannot blindly rely on the Island pattern in the chart. You have to see what other technical indicators increase the trade’s accuracy. On the other hand, there are some market conditions where any technical strategy might not work. For example, due to the news release or economic uncertainty, the global forex market may become volatile where making profit is more complicated than the usual market.
Therefore, investors should be prepared for the uncertain market condition where the only way to save capital is by managing risk per trade. However, it is not recommended to use more than 1% risk per trade, and the ultimate success of a trading strategy comes from a set of trades, not an individual trade.
Final thoughts
The Island pattern is a reversal trading method where the price gap indicates that the opposite party came into the market and is ready to change the price direction. On the other hand, the accuracy of this trading method is high, although its appearance depends on the unusual price behavior. Therefore, this method is perfect for keeping on the watchlist as it is easy to combine with any other trading technique.


