As long as there are financial markets, so is the moving average or MA. There is no other indicator as applicable and straightforward as this, besides the lots of other trending instruments based on it. MA is a widespread technical indicator. Its core objective is to smooth out the fluctuation in prices. Traders can detect noise or market bias of any trading instrument.
In this article, you will find everything you need to know about moving averages, from their types to the system and how to use them effectively.
Understanding moving averages
The indicator’s name suggests that it calculates the average closing price of an asset for specific periods. For example, look at the chart below.
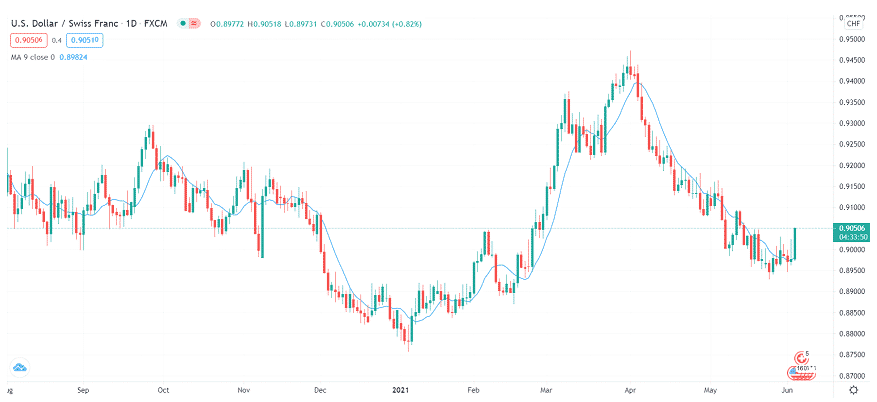
You can see the MA is a line overlaid on the candlesticks. Such a type of indicator is also called chart overlay. Like any other indicator, it helps to project forthcoming price change.
But why not just watch the price alone to forecast the upcoming movement?
The reason to apply the MAs on the chart is that the price movement creates too much noise. The zig-zag movement of price is leveled out by moving the average to find the market’s primary trend. You can find the trend bias by watching the slope of the indicator.
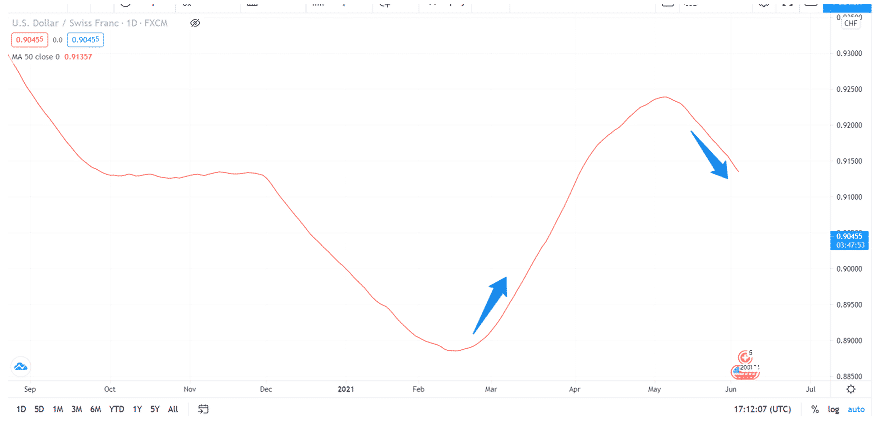
- The slope is facing downwards, so the trend is bearish
- The slope is facing upwards, so the trend is bullish
- The indicator line is straight, so no trend or choppiness in the market
Types of moving averages
As discussed above, MA reduces the noise in price, there are two main variations, and each has its peculiar way to smooth out.
Generally, a smoother MA responds slowly to the price change. If it is to and fro, it will more likely react swiftly to the price movement. If you want a smoother MA, you should set a more extended period. There are two main variations that we are going to discuss now.
Simple MA
As the name suggests, it is the simplest among all. You can compute it by summing up the closing price of the last X time units and then dividing the sum by X.
Do you feel confused?
Let’s clarify it further with a case. If you intrigue a 20-period SMA on a 30-minute chart, you would sum up the closing price of the previous 20 candles on the chart and then divide the sum by 20.
This is the average price for the last twenty candles or the previous ten hours. Combine these average prices to form a Moving Average on the chart. Most trading applications do this automatically for you.
Exponential Moving Averages
It considers current periods more critical. If you place EMA with a 9-period on the hourly chart, the indicator will give more weight to the 9th hour, followed by the 8th hour, and so on.
It means that the volatility on the second hour will be valued less as the influence on EMA wouldn’t be great as in SMA.
EMA vs. SMA
Now, let’s compare both types by applying them to the chart. First, look at the USD/CHF chart (D1 time frame) to observe how both MA’s look together on the chart.
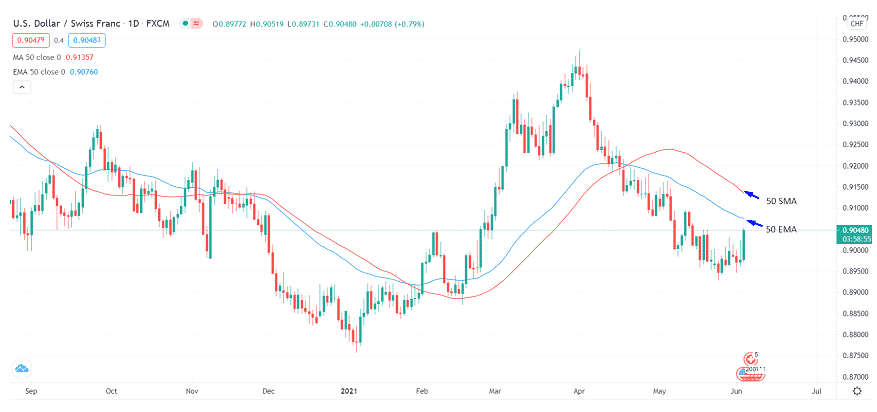
Which one of them remains closer to the price? Of course, the 50 SMA stays closer to the price.
This is because the EMA provides more relative weightage to what happens later. Therefore, it is essential to find what market participants are doing now rather than a month earlier. That’s why EMA is considered more accurate than SMA.
Movement of moving averages
The movement of MAs is classified into two phases:
- Sideways movement
- Trend movement
The straight-line movement of the indicator depicts the sideways phase. It occurs when the price stays in a tight range consolidating within the recent lows and highs, as shown in the chart below.
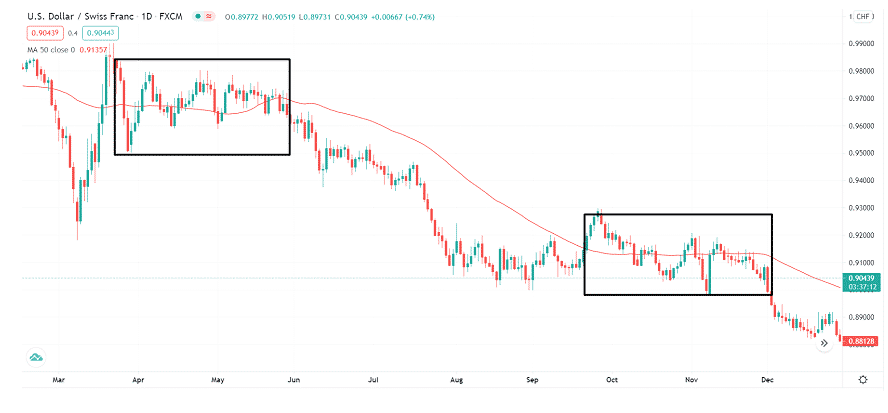
A slope demonstrates the trend bias of a trading instrument. The steepness of the slope reveals whether a trend is strong or weak. If a slope is steeper, it shows a robust directional bias in the market.
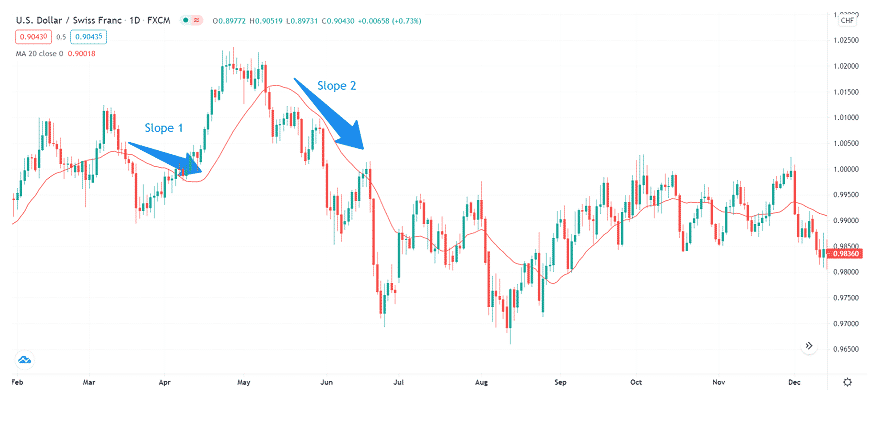
Both Slope 1 and Slope 2 on the chart represent a downward trend, but Slope 2 shows a solid bearish trend as the slope is steep. Conversely, look at Slope 1. Steepness is significantly less, which indicates a weak downtrend.
MA trading strategy
You can see various trading strategies based on the indicator, but we will share the most popular.
Moving average crossover
- Plot two MA’s on the chart with periods 20 and 50.
- Choose the time frame. We recommend 4-hour or above to keep the noise minimum.
- Look for a crossover of 20 and 50 MAs.
- Enter a long position if the 20-SMA crosses above the 50-SMA.
- Enter a short position if the 20-SMA crosses below the 50-SMA.
- Place stop-loss near the local lows or highs.
- Close the deal when the 20-SMA changes the direction.
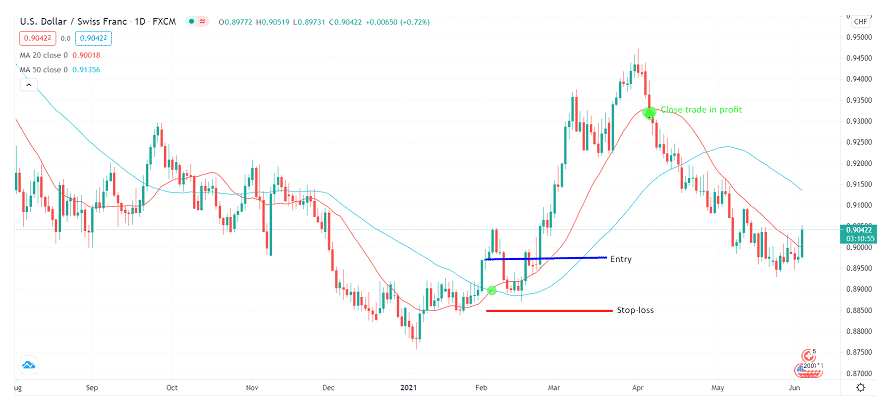
Moving average directional change
- Use 20-SMA on a 4-hour chart or above.
- If the price closes above the 20-SMA, enter the long positions.
- If the price closes below the 20-SMA, enter the short position.
- Place top-loss near the local low or high.
- Close the position in profit near the next supply or demand zones or when the SMA changes the course.
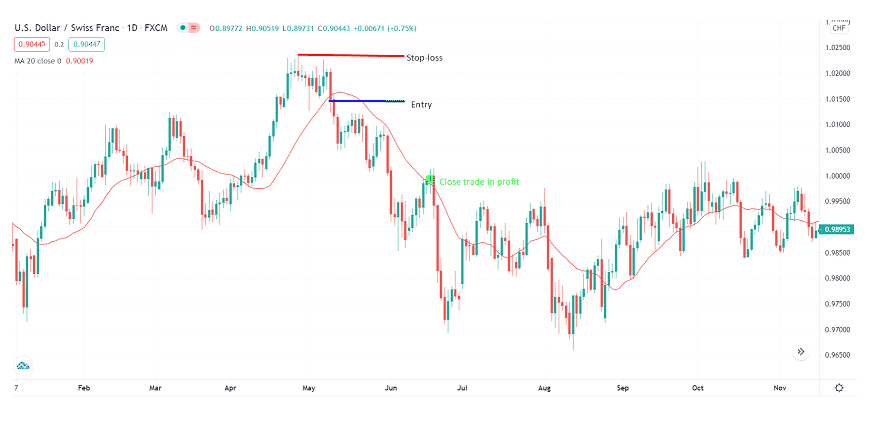
When they don’t work
MA may also have certain drawbacks like its peer tools. Some traders argue that this is yet another meaningless tool that cannot forecast market behavior. Moreover, trading instruments often show cyclic behavior. They react to the price and move too randomly.
Any breakout does not necessarily mean a trend reversal. It could just be a retracement. Since the indicator responds to the price built on the periods, there can be many instances when it reacts too late that the market has already made the significant move. Therefore, whenever you apply the indicator in your live trading, use your confirmatory tools to add a higher probability of success in your trading.


