Stephen Klinger created this oscillator in 1977. He also wanted to forecast long-term patterns in the market while looking at short-term fluctuations.
This oscillator tells you about key price reversals by using volume. In this guide, we’ll dig deeper into the tool and the top five tips you can use with it.
What is the Klinger volume oscillator?
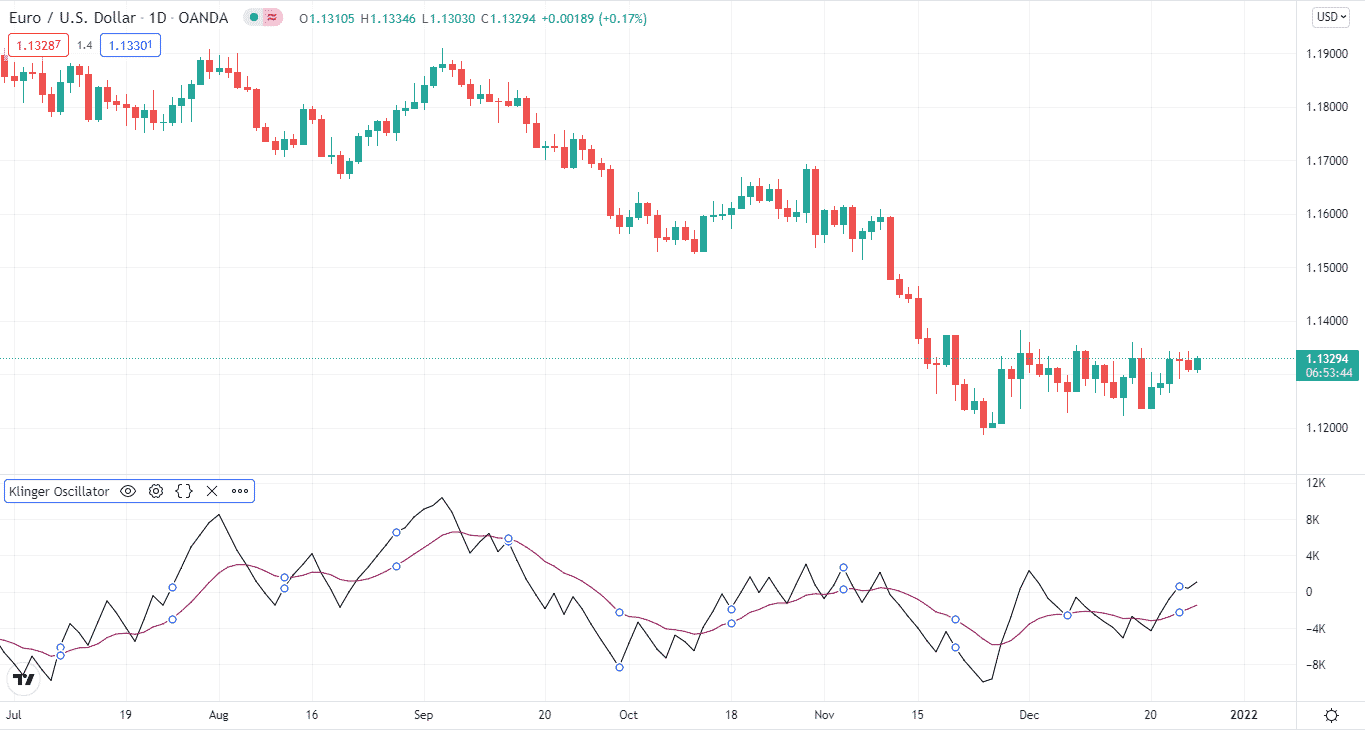
This tool depicts price movement on the chart using high/low/close and volume. The indicator calculates price moves and then turns the volume of the asset to present us the overall picture.
This oscillator displays the difference between two exponential moving averages (EMA). When trading with this tool, divergences on the oscillator is an excellent approach to detect future price reversals.

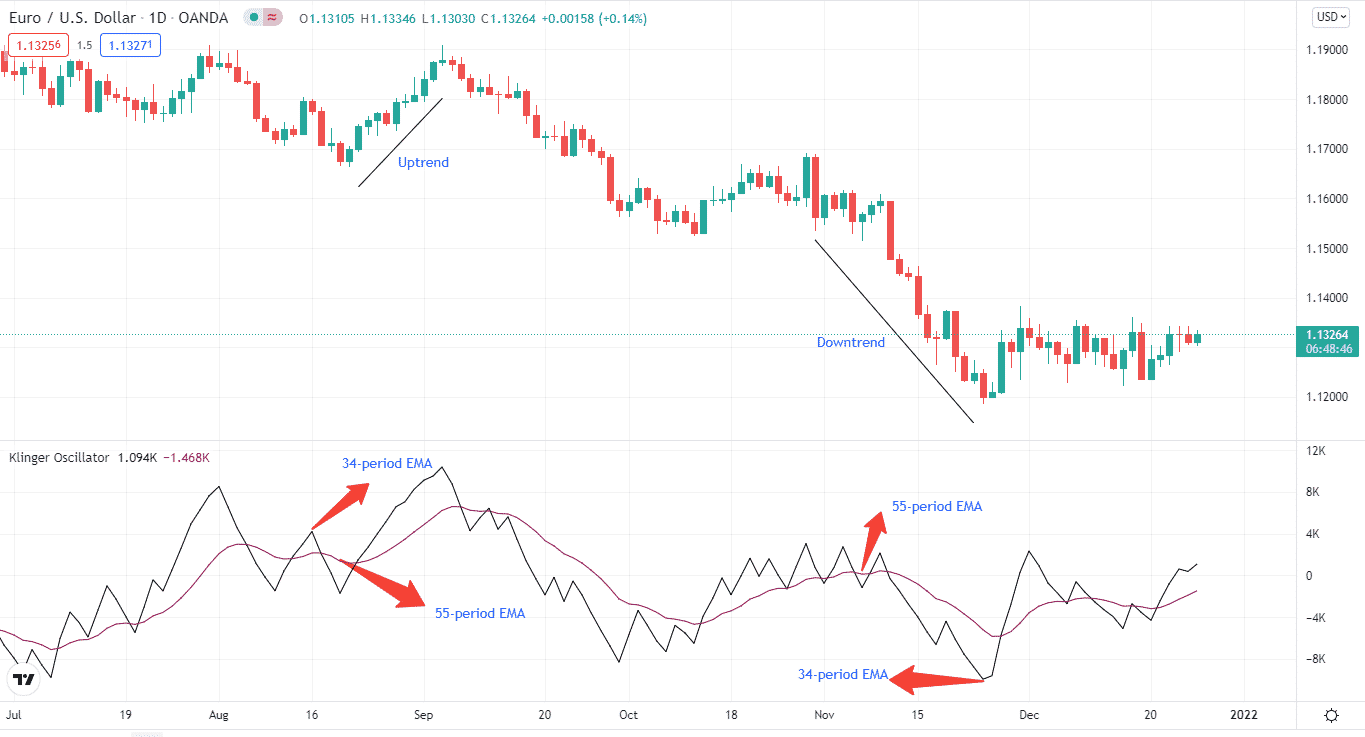
The Klinger oscillator’s default settings include a 34-period or a shorter EMA and a 55-period or a longer EMA. The 13-period MA is utilized as a signal line to initiate buy or sell orders. This method is similar to signals generated by other indicators like the MACD.
Top five tips for trading
Now that you know the Klinger volume oscillator, it’s time to move to the top five tips for trading with the indicator.
Tip 1. Going long
To trade during the uptrends, you need to identify a straightforward thing. When the Klinger oscillator is more significant than zero, the shorter EMA is more excellent than, the longer one.
When the 34-period EMA goes above the longer 55-period EMA, the market is an uptrend, and you can go long.
Why does it happen?
As the Klinger volume depends on EMAs, the price moves like MA crossovers. If the shorter EMA goes above the longer one, it’s a buy signal.
How to avoid the mistake?
It’s important to pinpoint the EMAs crossovers. If you get that wrong, then your whole position will get affected.
Tip 2. Going short
To trade when the market is falling, you have to look for a crossover of longer EMA going above the shorter one.
When the 55-period EMA goes above the shorter 34-period EMA, the Klinger indicates a downtrend, and you can take short positions.

Why does it happen?
As mentioned earlier, Klinger uses EMAs, so crossovers are fundamental factors in determining downtrends. If the longer EMA goes above, the shorter one, it’s a sell signal.
How to avoid the mistake?
Crossovers can provide false signals. So, it’s best to use the Klinger with other indicators.
Tip 3. Trading with bullish and bearish divergences
Bullish/bearish divergences are a regular occurrence on the chart. In the case of Klinger, divergences identify the lack of confirmation between price and volume in a move.
When the asset price continues to decline while the indicator value rises, this is regarded as a positive trend.
On the flip side, when the price increases but the value of the Klinger oscillator lowers, it is a bearish signal.
Why does it happen?
Bullish and bearish divergences are part and parcel of any oscillator. They tell when to enter and exit the trade.
When prices rise, but momentum falls, a top is likely near, and it’s a bullish divergence. This is what you need to look for when taking long positions.
A bearish divergence has occurred if prices hit a new high reach a lower top, which is a strong sell signal.
How to avoid the mistake?
Divergences may occur too early. You can miss a trend if you don’t follow the chart all the time. Sometimes, Klinger’s divergences can’t predict a price reversal. So, you have to combine other indicators for further confirmation.
Tip 4. Trading with the signal line
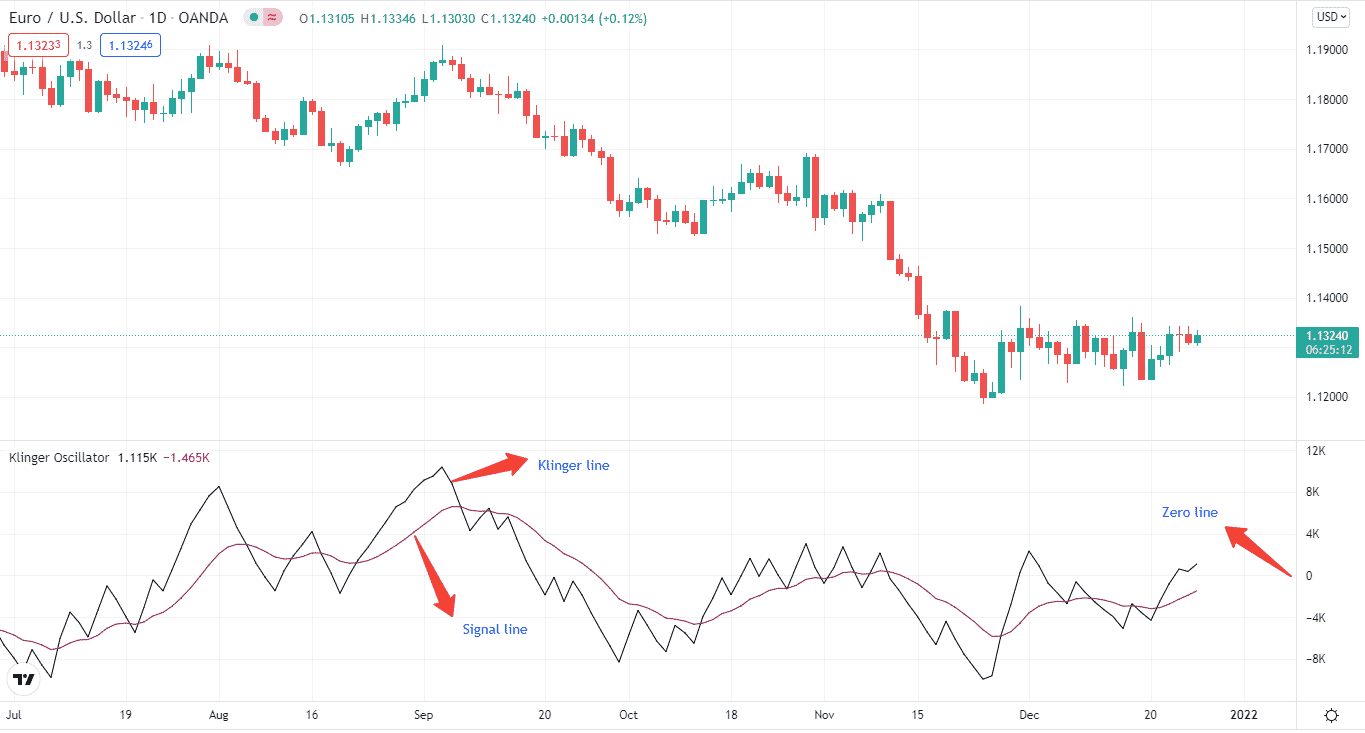
You can take a buy position when the signal line crosses a zero line, and the Klinger line is above the signal line.
On the flip side, you can go short if the signal line is below the zero line and the Klinger Line is below the signal line.
Why does it happen?
As mentioned above, the EMA crossovers are part of Klinger, so signal line and Klinger line crossovers present us with buying and selling opportunities.
It’s important to remember that some versions of the indicator don’t include a zero line, so you have to look at the chart for it.
As you can see on the chart below, there is no zero line, but the 0 figure points out a zero line.

How to avoid the mistake?
It is difficult to differentiate which crossovers you can trade. So, you have to pool the Klinger with other technical indicators for further confirmation.
Tip 5. Using the MACD with Klinger
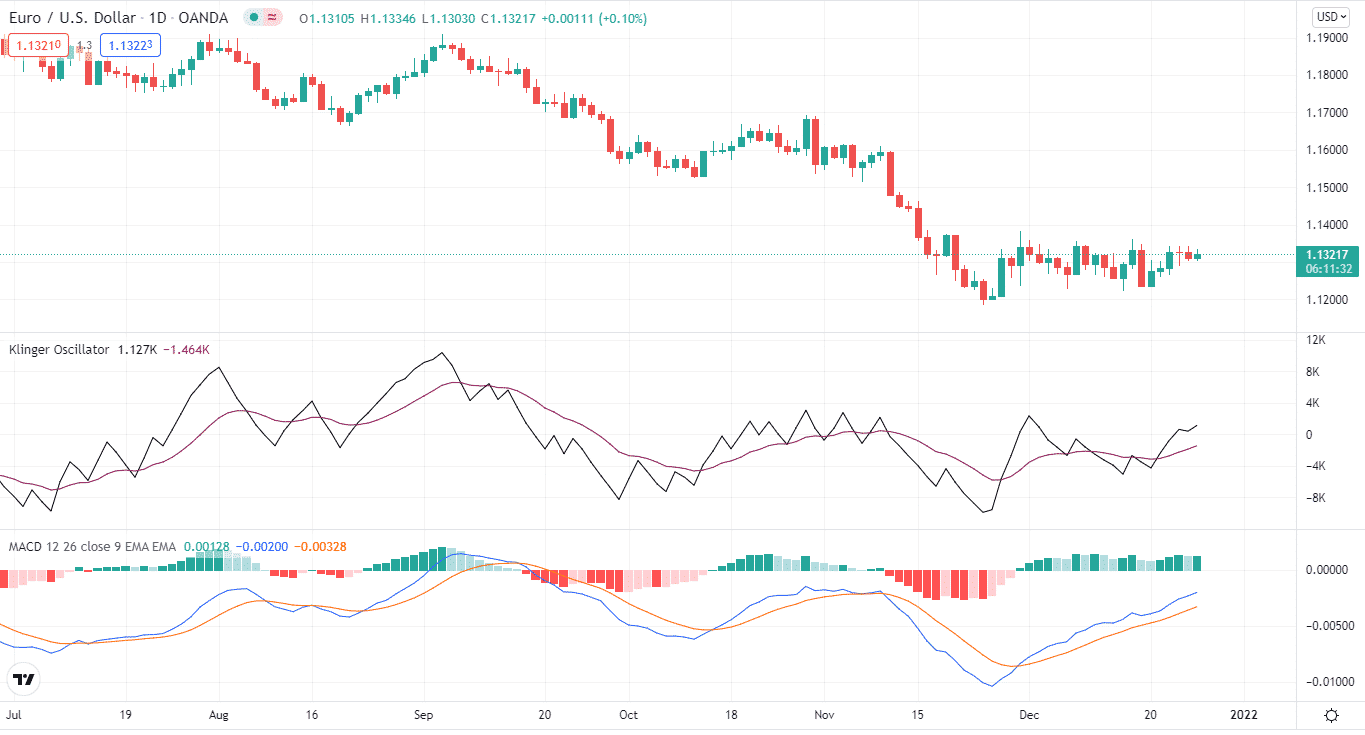
You can also use the MACD with the Klinger oscillator. The MACD works on the same rules as Klinger. Both have two lines and depend on EMAs. The MACD further confirms the signals by plotting volume bars on the chart.
It helps in reducing any false signals produced by the Klinger indicator.
Why does it happen?
There’s no Holy Grail indicator. You can’t fully rely on one indicator because of constant market moves. Indicators do miss trading opportunities. By combining the MACD with Klinger, you can filter some market noise.

How to avoid the mistake?
Add New Post
about:blankImage: Change block type or styleChange alignmentabout:blankAdd titleKlinger Volume Oscillator: Top 5 Tips Which Help You in Trading
Stephen Klinger created this oscillator in 1977. He also wanted to forecast long-term patterns in the market while looking at short-term fluctuations.
This oscillator tells you about key price reversals by using volume. In this guide, we’ll dig deeper into the tool and the top five tips you can use with it.
What is the Klinger volume oscillator?
This tool depicts price movement on the chart using high/low/close and volume. The indicator calculates price moves and then turns the volume of the asset to present us the overall picture.
This oscillator displays the difference between two exponential moving averages (EMA). When trading with this tool, divergences on the oscillator is an excellent approach to detect future price reversals.

The Klinger oscillator’s default settings include a 34-period or a shorter EMA and a 55-period or a longer EMA. The 13-period MA is utilized as a signal line to initiate buy or sell orders. This method is similar to signals generated by other indicators like the MACD.
Top five tips for trading
Now that you know the Klinger volume oscillator, it’s time to move to the top five tips for trading with the indicator.
Tip 1. Going long
To trade during the uptrends, you need to identify a straightforward thing. When the Klinger oscillator is more significant than zero, the shorter EMA is more excellent than, the longer one.
When the 34-period EMA goes above the longer 55-period EMA, the market is an uptrend, and you can go long.
Why does it happen?
As the Klinger volume depends on EMAs, the price moves like MA crossovers. If the shorter EMA goes above the longer one, it’s a buy signal.
How to avoid the mistake?
It’s important to pinpoint the EMAs crossovers. If you get that wrong, then your whole position will get affected.
Tip 2. Going short
To trade when the market is falling, you have to look for a crossover of longer EMA going above the shorter one.
When the 55-period EMA goes above the shorter 34-period EMA, the Klinger indicates a downtrend, and you can take short positions.

Why does it happen?
As mentioned earlier, Klinger uses EMAs, so crossovers are fundamental factors in determining downtrends. If the longer EMA goes above, the shorter one, it’s a sell signal.
How to avoid the mistake?
Crossovers can provide false signals. So, it’s best to use the Klinger with other indicators.
Tip 3. Trading with bullish and bearish divergences
Bullish/bearish divergences are a regular occurrence on the chart. In the case of Klinger, divergences identify the lack of confirmation between price and volume in a move.
When the asset price continues to decline while the indicator value rises, this is regarded as a positive trend.
On the flip side, when the price increases but the value of the Klinger oscillator lowers, it is a bearish signal.
Why does it happen?
Bullish and bearish divergences are part and parcel of any oscillator. They tell when to enter and exit the trade.
When prices rise, but momentum falls, a top is likely near, and it’s a bullish divergence. This is what you need to look for when taking long positions.
A bearish divergence has occurred if prices hit a new high reach a lower top, which is a strong sell signal.
How to avoid the mistake?
Divergences may occur too early. You can miss a trend if you don’t follow the chart all the time. Sometimes, Klinger’s divergences can’t predict a price reversal. So, you have to combine other indicators for further confirmation.
Tip 4. Trading with the signal line
You can take a buy position when the signal line crosses a zero line, and the Klinger line is above the signal line.
On the flip side, you can go short if the signal line is below the zero line and the Klinger Line is below the signal line.
Why does it happen?
As mentioned above, the EMA crossovers are part of Klinger, so signal line and Klinger line crossovers present us with buying and selling opportunities.
It’s important to remember that some versions of the indicator don’t include a zero line, so you have to look at the chart for it.
As you can see on the chart below, there is no zero line, but the 0 figure points out a zero line.

How to avoid the mistake?
It is difficult to differentiate which crossovers you can trade. So, you have to pool the Klinger with other technical indicators for further confirmation.
Tip 5. Using the MACD with Klinger
You can also use the MACD with the Klinger oscillator. The MACD works on the same rules as Klinger. Both have two lines and depend on EMAs. The MACD further confirms the signals by plotting volume bars on the chart.
It helps in reducing any false signals produced by the Klinger indicator.
Why does it happen?
There’s no Holy Grail indicator. You can’t fully rely on one indicator because of constant market moves. Indicators do miss trading opportunities. By combining the MACD with Klinger, you can filter some market noise.

How to avoid the mistake?
Divergences and crossovers can produce market noise. Further, you can even miss a bullish/bearish divergence for a reversal, so you can’t rely on it completely.
So, before this happens, you need to have another indicator on the chart to confirm the market move.
Final thoughts
A crossover between the lines of the Klinger volume oscillator is the most important thing to look for when applying it. So, you have to locate crossovers carefully, wait for the price to continue its path, and then take positions.
You can use technical analysis like trendlines or combine it with other indicators like the MACD or the RSI to confirm trading signals.


