The McClellan Volume Oscillator is a prominent technical indicator that detects the price moment according to participants’ actions. It calculates the increasing and decreasing issues or volume data to obtain the market context. So no wonder this technical indicator can be helpful to crypto investors when making trade decisions.
However, when a newbie comes to use any indicator, it is mandatory to follow specific guidelines to get the best results. This article highlights the indicator alongside listing the top five tips to use the crypto assets effectively.
What is the McClellan Volume Oscillator?
This tool remarks on a certain asset’s rising and declining price issues and shows it in an independent chart. Many financial investors use this technical indicator while making trade decisions in stocks or other financial assets. The indicator has a dynamic line that floats between +100 to -100. There is a central line at zero level. The dynamic line moves according to the price pressure in any particular direction.
Top five tips for using the oscillator in crypto strategy
You can use the tool successfully in crypto trading. We list the top five tips to use in the following part.
Tip 1. When entering a buy trade
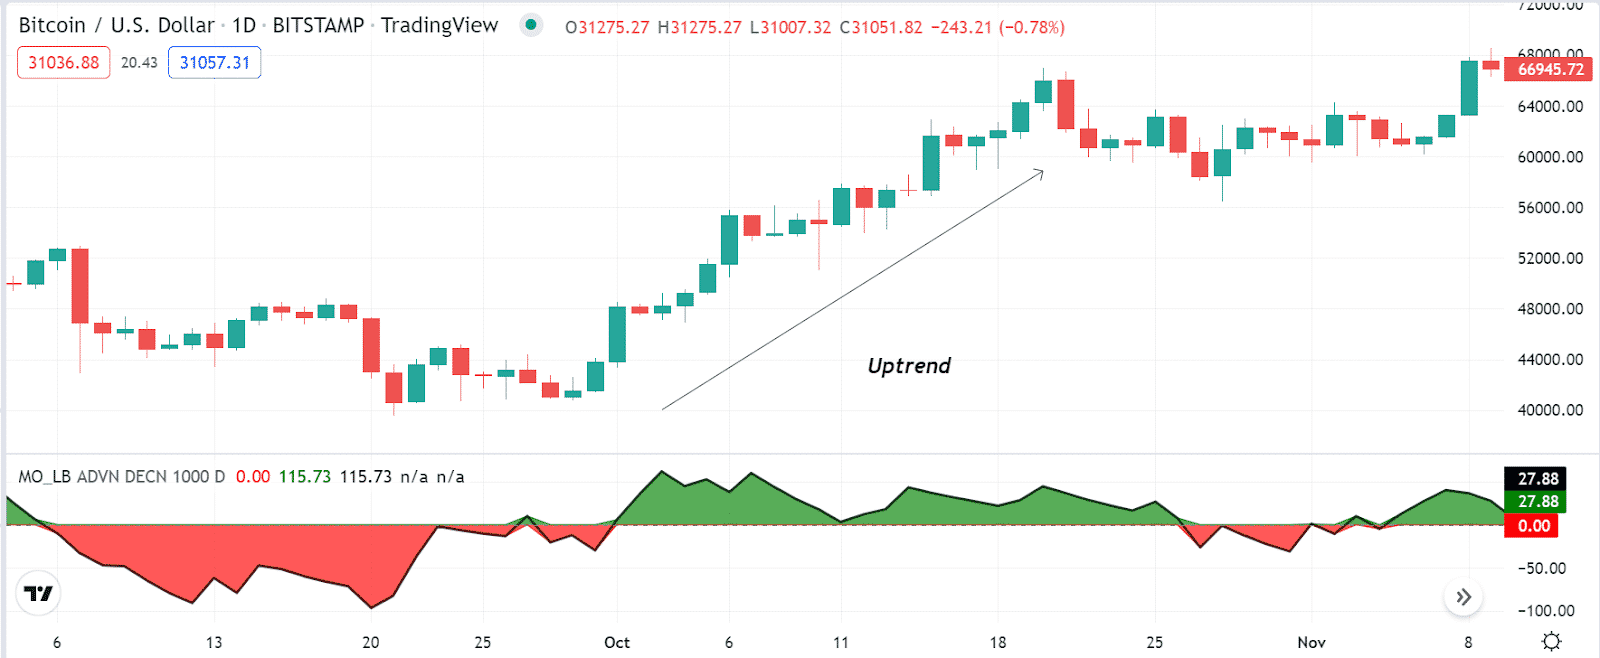
Seek to open buy positions when the dynamic line of the RSI indicator window reaches above the central line. The gap between the central line and the dynamic signal line of the oscillator will turn green. When you match these scenarios with your target asset chart, it declares a potential bullish momentum.
Why does this happen?
It happens as the oscillator measures the increasing and declining volume of the asset price. When the price increases or faces bullish pressure, the dynamic line rises toward the +100 level.
How to avoid mistakes?
Smart crypto investors always seek to avoid mistakes to limit loss and maximize profits. When using the indicator, it is better to conduct a multi-time frame analysis to execute trades in the direction of the current trend.
Tip 2. When entering sell trade
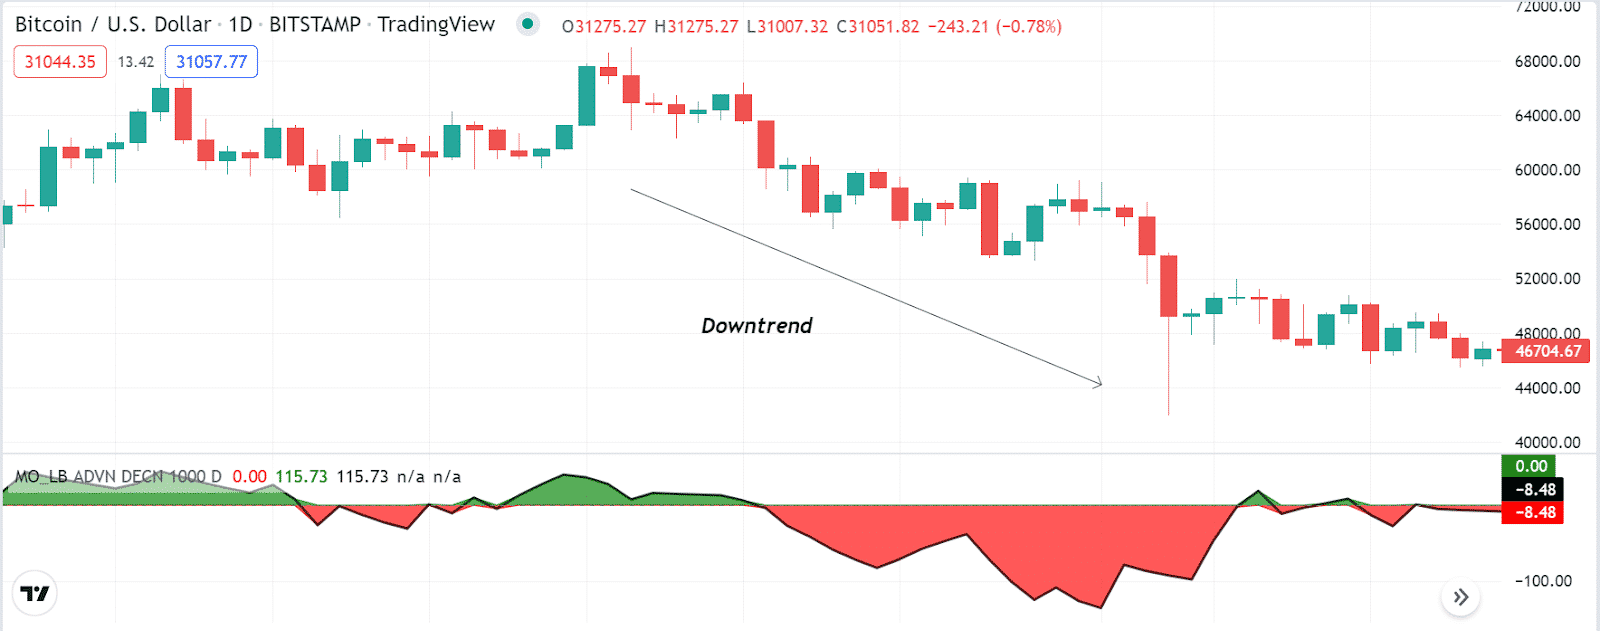
When seeking to enter sell trades, it is mandatory to determine the declining pressure on the asset price. You can enter sell trades using the indicator readings. For example, the dynamic line of the indicator window starts declining toward the -100 level and reaches below the central (zero) line; it indicates the initiation of bearish momentum.
How does this happen?
It happens as the indicator measures the increasing and decreasing issues of price movements and shows the market context. When the declining pressure increases, the dynamic line starts to decline and to reach below the central (zero) line confirms sufficient bearish pressure on the asset price.
How to avoid mistakes?
We suggest conducting a multi-timeframe analysis to confirm the trend direction before entering any trade. Moreover, checking on fundamental info and combining the indicator reading with other technical indicators increases the potentiality of catching the best trades.
Tip 3. Determining sideways
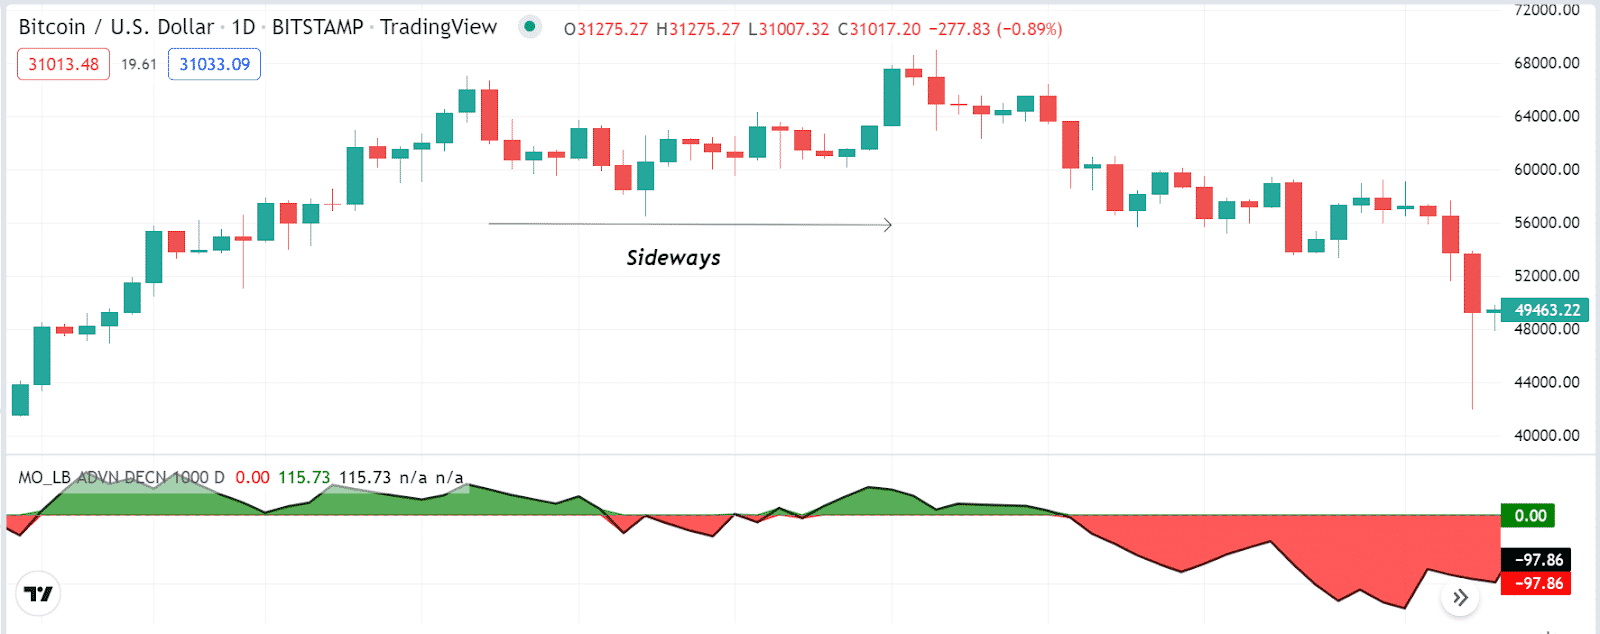
Determining sideways or consolidation phases of price movement are important while participating in the financial market. Smart financial traders always seek sideways or low volatile phases as it enables opportunities to execute swing trades. You can use the indicator to identify sideways. When the dynamic line frequently makes crossovers with the central (zero) line on the indicator window, and the gap between these lines gets smaller, it declares low volatile phases or sideways.
Why does this happen?
The dynamic line of the indicator window frequently crosses above and below the central (zero) line as the volume decreases. Moreover, the gap between these two (dynamic and central) lines decreases as there is no trend when the price remains on a trend; the distance between these two lines increases as the dynamic line continues to move in any specific direction during solid trends.
How to avoid mistakes?
Smart investors usually spot these sideways to determine opportunities to enter potential swing trades, as in most cases, volatility decreases before a considerable price movement.
Tip 4. Detect breakouts with support and resistance
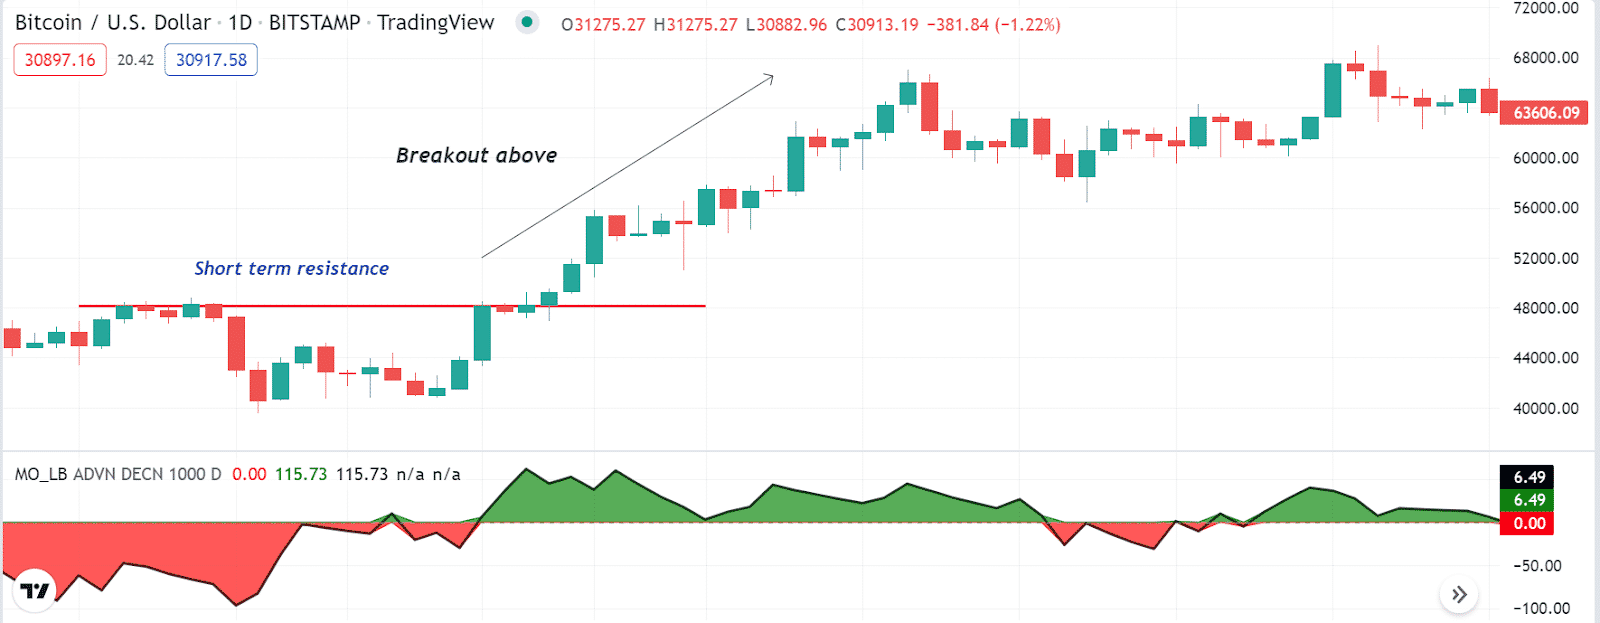
Detecting breakout levels enables participating in swing trades. When you have a basic concept of detecting support resistances, you can easily detect breakout levels by combining the concept with the indicator. The indicator positively influences the asset price, declaring a bullish momentum and vice versa. For example, the price breaks above any short-term resistance level.
How does this happen?
The price breaks above or below any support resistance level, and the technical indicator confirms the movement. Combining both readings, it becomes easier to detect breakout levels.
How to avoid mistakes?
When marking breakout levels, be aware of fakeouts. Moreover, executing trades using breakouts enables participating in swing trades. When entering swing trades, use tight stop loss for your executing trades alongside applying proper trade and money management concepts.
Tip 5. Combine other indicators to execute effective trades
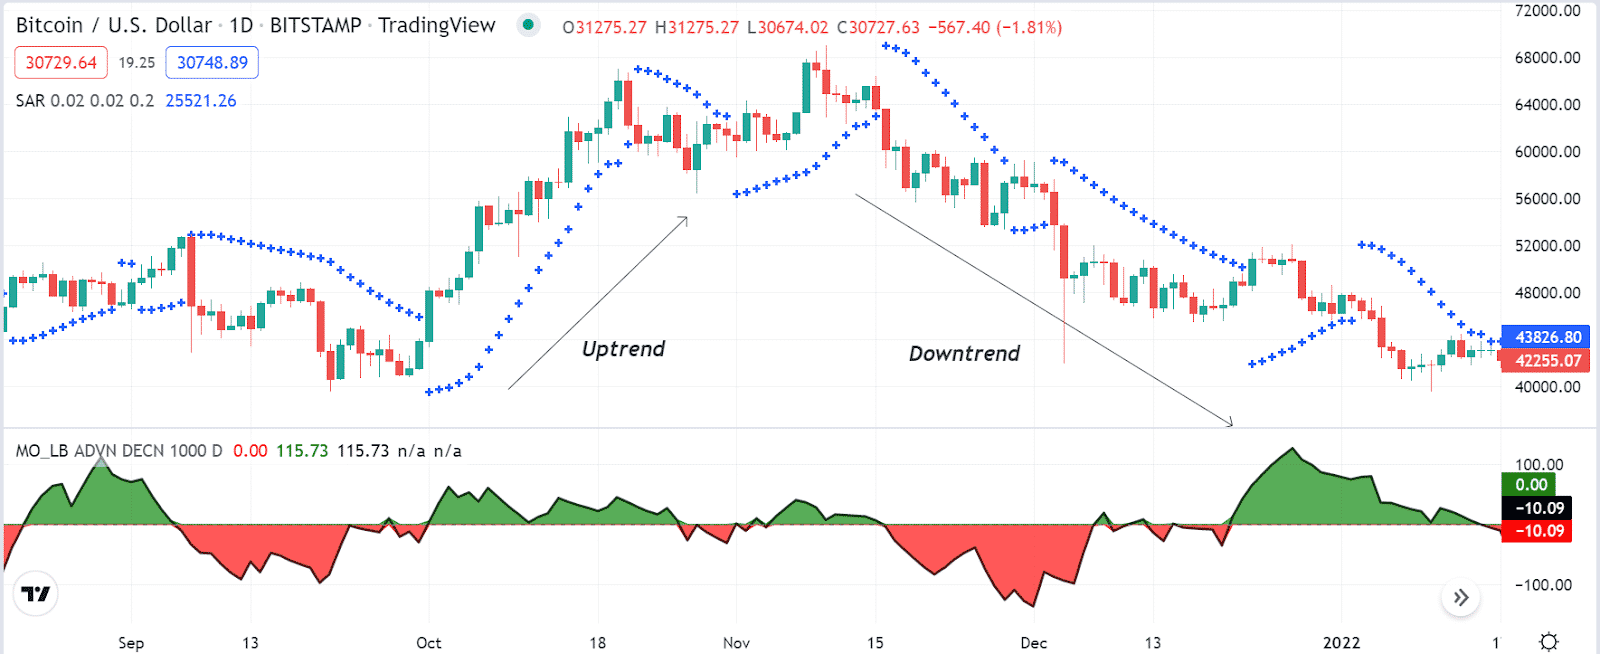
You can combine other technical indicators with the McClellan Volume Indicator to execute efficient trades. For example, you may use the parabolic SAR alongside the indicator to generate trade ideas; when both the parabolic SAR and the McClellan Volume Oscillator indicator declare price movement in any particular direction, it is better to open trades in that direction.
Why does this happen?
It happens as the parabolic SAR detects swing points and trends. Meanwhile, the oscillator confirms the price direction. So effectively combining both readings enables participation in most potential trades.
How to avoid mistakes?
When combining two or more indicators to generate trade ideas, it is mandatory to recheck and match the readings before executing any trade. Additionally, use proper stop loss to reduce risks.
Final thought
Finally, this article introduces you to one of the most effective technical indicators in the financial market. You can use this technical indicator to execute constantly profitable trades. Moreover, you can use many other technical indicators alongside the McClellan Volume Oscillator indicator to generate efficient trade ideas.


