Many crypto traders spend a lot of their precious time searching for the best trading strategy to use in cryptocurrency. Despite the fascinating search, there is only one result. There is not a single way to trade the markets.
The truth is, there is no one way to trade the crypto markets. Being a trader, you need to learn a lot of trading strategies, and MFI is one of them. You might be interested in learning the Money Flow strategy. It combines trend and volume with RSI for a unique indicator.
Don’t get confused. This article aims to explain the MFI strategy and ways to use it effectively. Unlike other strategies, it also incorporates volume in its calculation. However, the price is almost similar to that. Let’s discuss the basics of it.
What is it about?
You can consider it an indicator that utilizes price and volume to determine the direction of price movement. Gene Quong and Avrum Soudack created this tool, and it is pretty similar to RSI.
A typical price is set for every period. As a result, the Money Flow is positive when the demand increases. In contrast, the cash flow is negative if the typical price declines.
The RSI formula is then used to create an indicator from zero to one hundred based on positive and negative flow ratios. Its capacity as a volume-dependent index means it can effectively identify price reversals and extremes.
How to trade the MFI?
You first need to learn the overbought and oversold divergence trading strategy to understand the concepts of MFI and its trading methods. Both are somehow the same because they provide the same type of indications. Divergences and variable momentum conditions are the most common signals offered by MFIs.
The signal above 90 indicates overbought conditions, and a reversal or pullback may be imminent. Market reversals or escapes may occur when the signal falls below 10. The market that reaches a heavily sold level does not indicate that the prices will reverse suddenly.
The markets may remain in the territory of the waving state during periods of strong upward or downward movements for days, weeks, or even months.
During conditions of increased momentum, the prices can stay high or low for an extended period. For this reason, you should not automatically enter counter-trend positions when the MFI reaches or exceeds 90 or 10, indicating high trend conditions. This is the wrong approach to take when considering the MFI strategy in crypto.
You can also use the trick to watch for divergences between the price of the security and the MFI. In other words, when the prices reached a new high but the MFI could not do so, we had a divergence.
Bullish trade setup
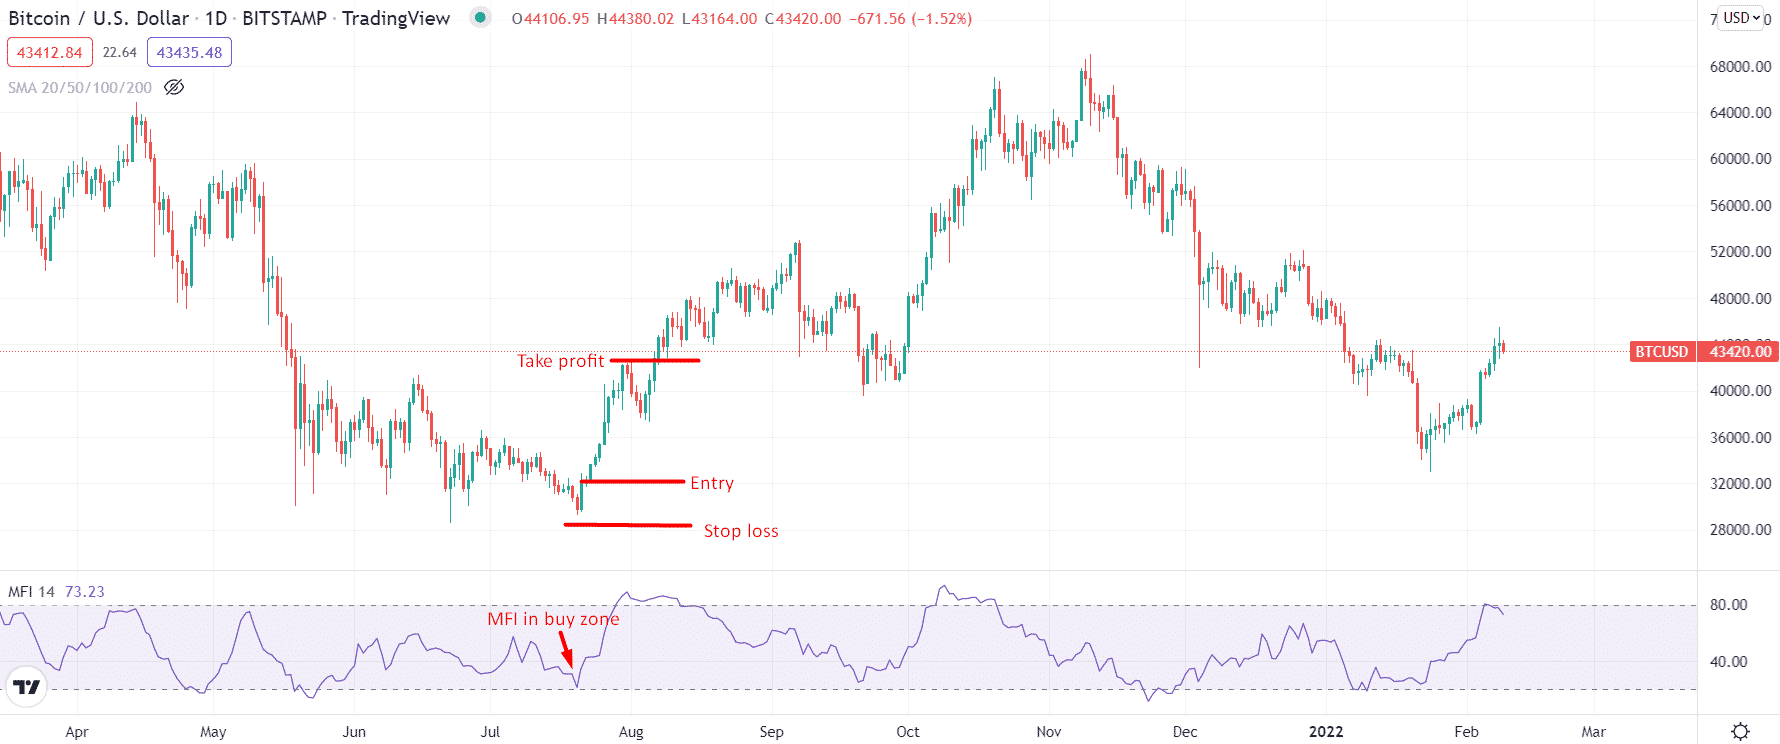
Let’s look at the bullish trade setup using the MFI indicator.

Entry
Look at the chart above. The MFI value exceeds the 50.0 mark, and the price chart forms a bullish candle. You may need to wait for the candle to close and enter the trade.
Stop loss
For stop-loss, you should look around the swing lows. Place the stop-loss slightly below the recent swing lows.
Take profit
You can place the take profit level around the next resistance level. Alternatively, you may wait until the MFI value hits 75.0.
Bearish trade setup
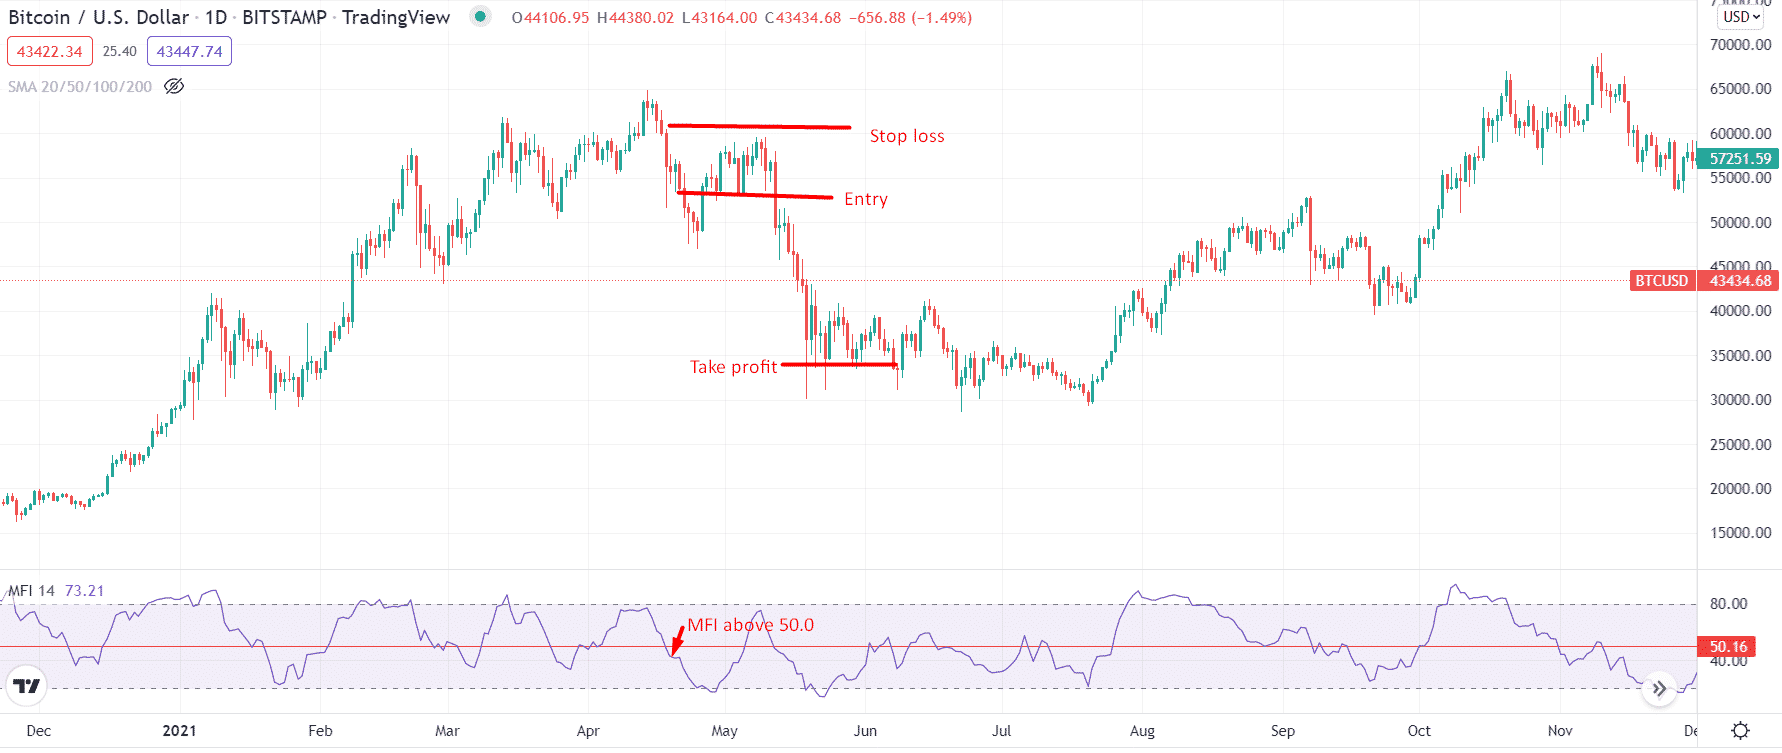
Let’s look at the bearish trade setup using the indicator.

Entry
Look at the chart above. The value falls below the 50.0 mark, and the price chart forms a bearish candle. You may need to wait for the candle to close and enter the trade.
Stop loss
For stop-loss, you should look around the swing highs. Place the stop-loss slightly above the recent swing highs.
Take profit
You can place the take profit level around the next support level. Alternatively, you may wait until the MFI value hits 25.0.
How to manage risks?
Remember that diverging signals between the MFI and price action that result in a divergence do not always indicate trend reversals. It can sometimes give false signals.
In addition, it is essential to note that divergences accompany not all trend reversals. Because of this, it is vital to put in place a well-thought-out risk management policy and not solely rely on signals.
Pros |
Cons |
| It is excellent at identifying divergences on the chart. | The lagging indicator can produce numerous whipsaws if not used correctly. |
| It helps identify the areas of high growth on the chart. | It does not contain all of the data necessary for proper price action analysis, so it should be used in combination with other tools. |
| It is good during a trending market condition, combined with moving averages. |
Final thoughts
The tool that uses price and volume data to signal high momentum trading is the Money Flow Index. Generally, a level above 80 represents the highly bought condition, and below 20 shows highly sold. Similarly, 90 and 10 are considered as thresholds.
There is a perception that the MFI is an underrated indicator. Also, it lives under the shadow of the RSI. But, those who get to its core begin to see its benefits. You can identify these signals by using this trading strategy of crypto.
Over time, the Money Flow Index has gained popularity among traders of all levels, from beginners to professionals, due to its relative accuracy and straightforward approach.
It is also important not to rely on the signals generated by the MFI alone for trading decisions, as you would with any other technical indicator. In addition to producing false signals, it is likely to make your money disappear without an additional hand.


