The RVI is a technical indicator that measures the energy level of the present market. It is an oscillator based on the idea that prices tend to close higher than they open in uptrends. When the price is trending upwards, the closing price is often higher than the opening price, whereas the converse is true in a bearish situation.
This guide will explain the indicator and how you can use it in crypto trading.
What is the Relative Vigor Index indicator?
We can determine the overall strength of the market and better forecast the conclusion of specific trends by using the indicator to assess price level fluctuations between the open and close of the market and comparing this to findings obtained during the following days.
When the RVI crosses over its signal line, potential buy chances emerge in uptrends. Conversely, when it falls below its signal line during a downtrend, possible short sell possibilities arise.
Because the crypto market operates 24 hours a day, determining currencies’ open and closing values may be difficult. On the other hand, crypto data is simple because there are starting and closing prices every day.
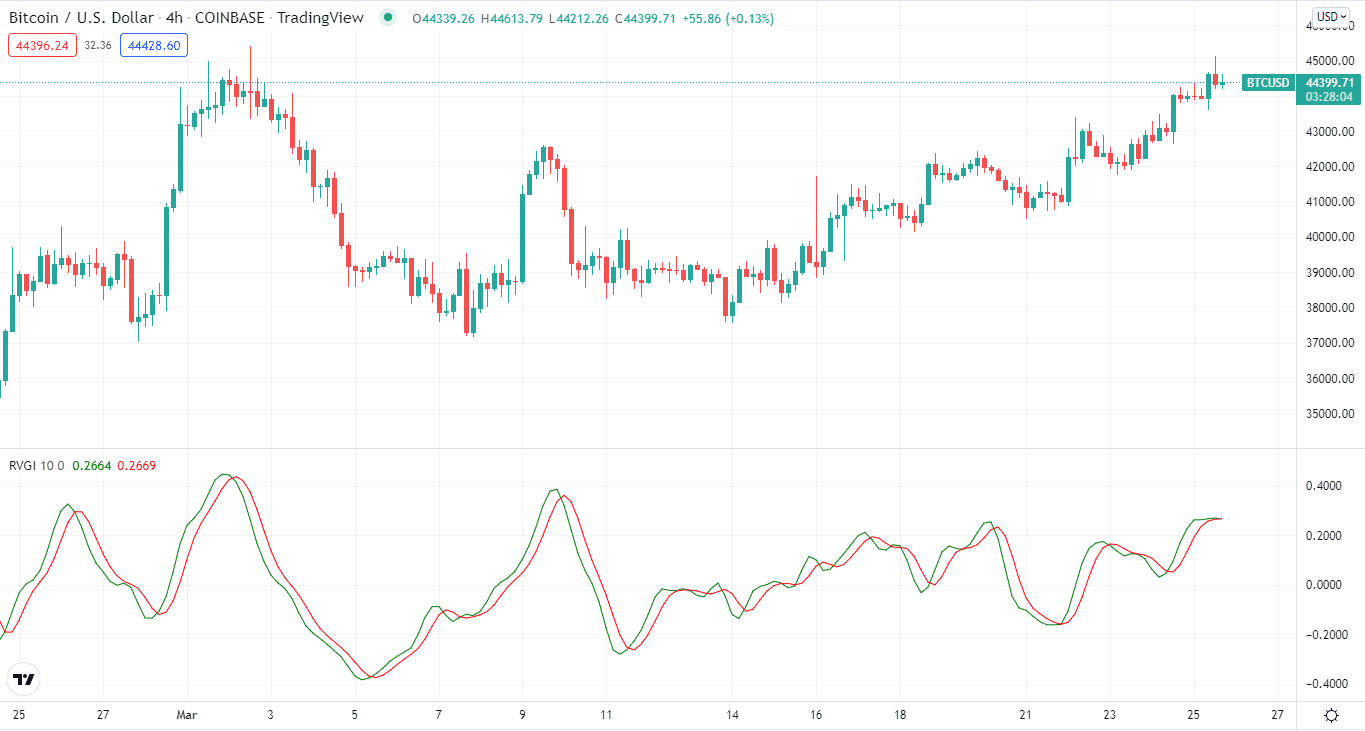
The first step, by the way, is to look at a chart visually and observe how it is trending. Then, when the market is trending, use the RVI to assist you in receiving the accurate signal.
You can use the indicator to forecast future changes in a crypto trend by looking for divergences with the current price and then calculating specific entry and exit points using the chart patterns.
Top five tips for trading with the RVI
Let’s cover the top five tips using the indicator.
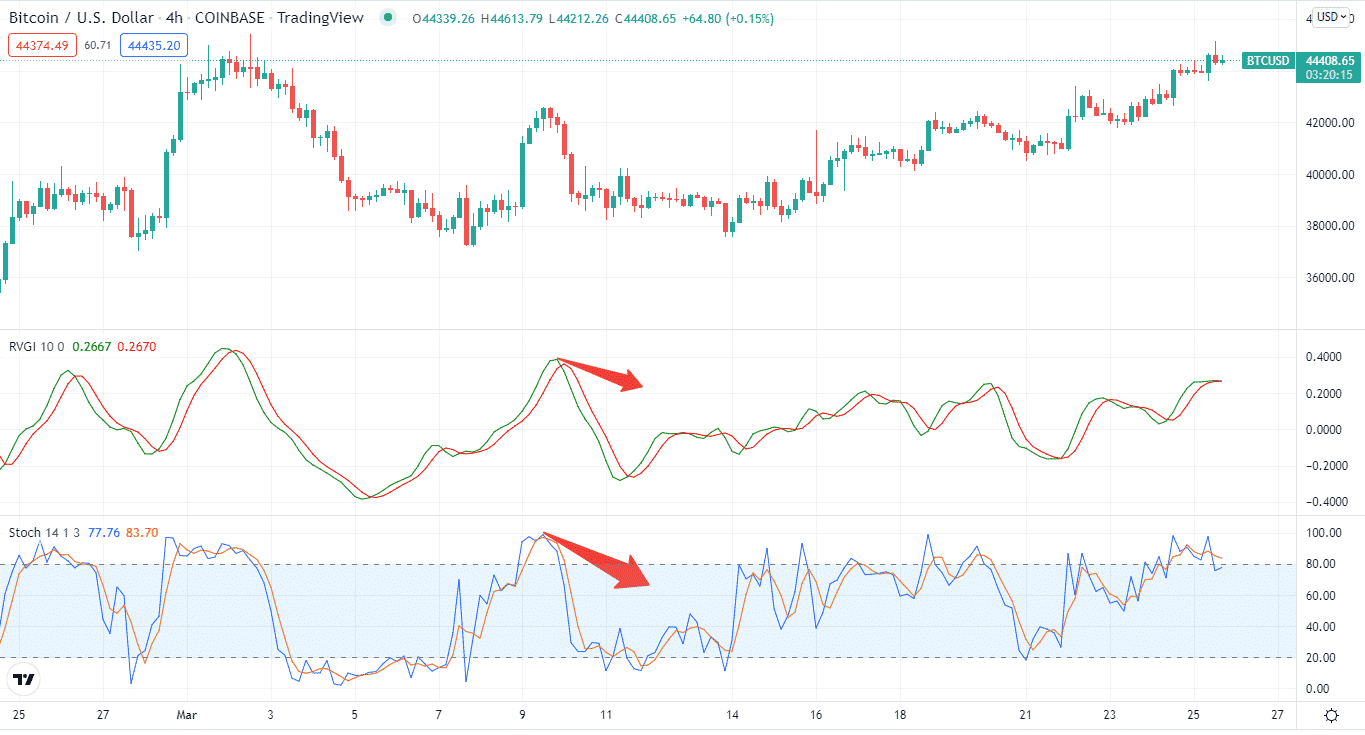
Tip 1. To combine it with stochastic
The indicator works best when you combine it with another oscillator.
What does it happen?
It is a leading indicator, and when you use it with other oscillators like Stochastics for crypto trading, it can provide accurate overbought and oversold trading signals. Below is a four-hour chart of BTC/USD. The two arrows show when the RVI and the stochastic begin to report an oversold position.
So, we proceed when the green line of the RVI tool breaks through the red line, signifying the start of a new bullish trend.
How to avoid the mistake?
Oscillators tend to vary between levels, although they can also stay at high levels for a long time.
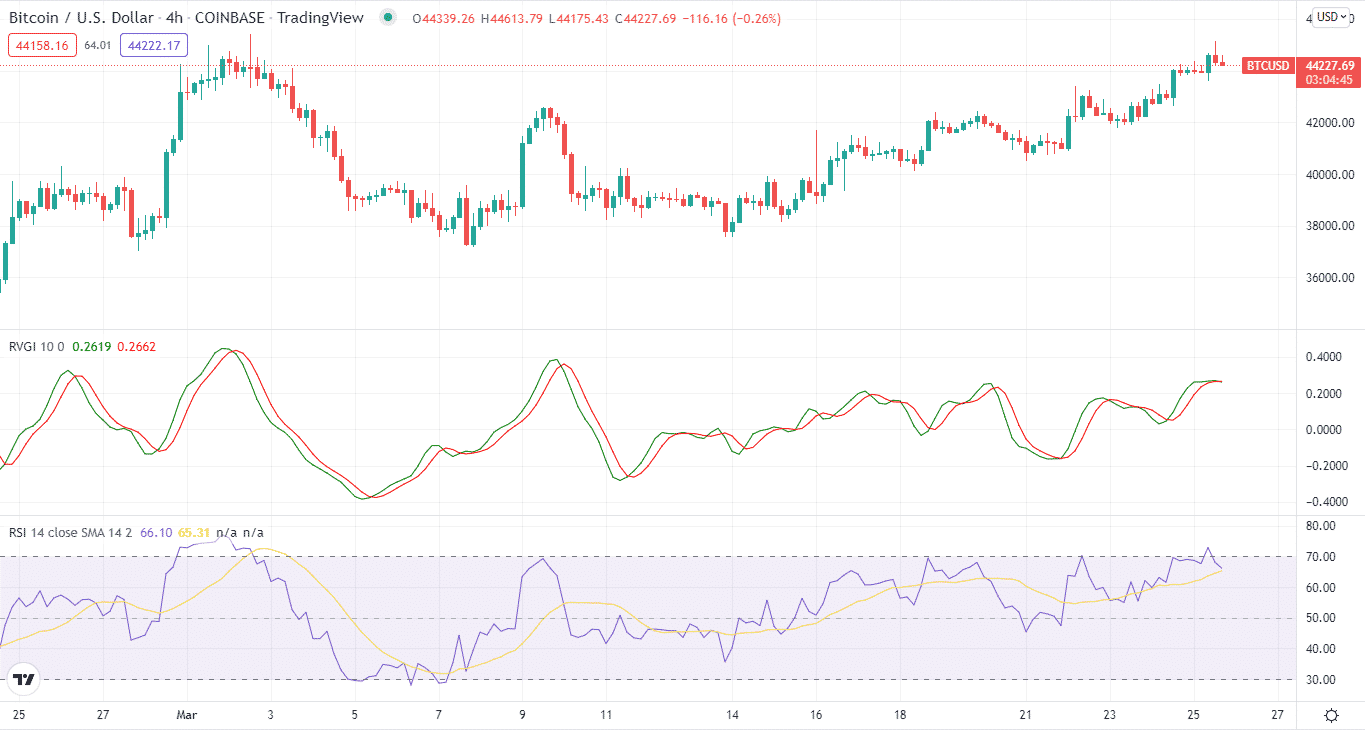
Tip 2. To combine it with the RSI
Many other oscillators, such as the RSI, are understood similarly as the RVI.
Why does it happen?
The RVI indicator is calculated in the same way as the RSI. However, instead of comparing the close to the low, it relates it to the open. We intend to enter a long position in the first setup after the RSI shows an oversold situation and the RVI offers a bullish cross.
How to avoid the mistake?
Rather than traveling around a centerline, the RVI is a centered oscillator, not a banded oscillator, which means it’s usually displayed up or down price chart, oscillating around a centerline rather than the current price.
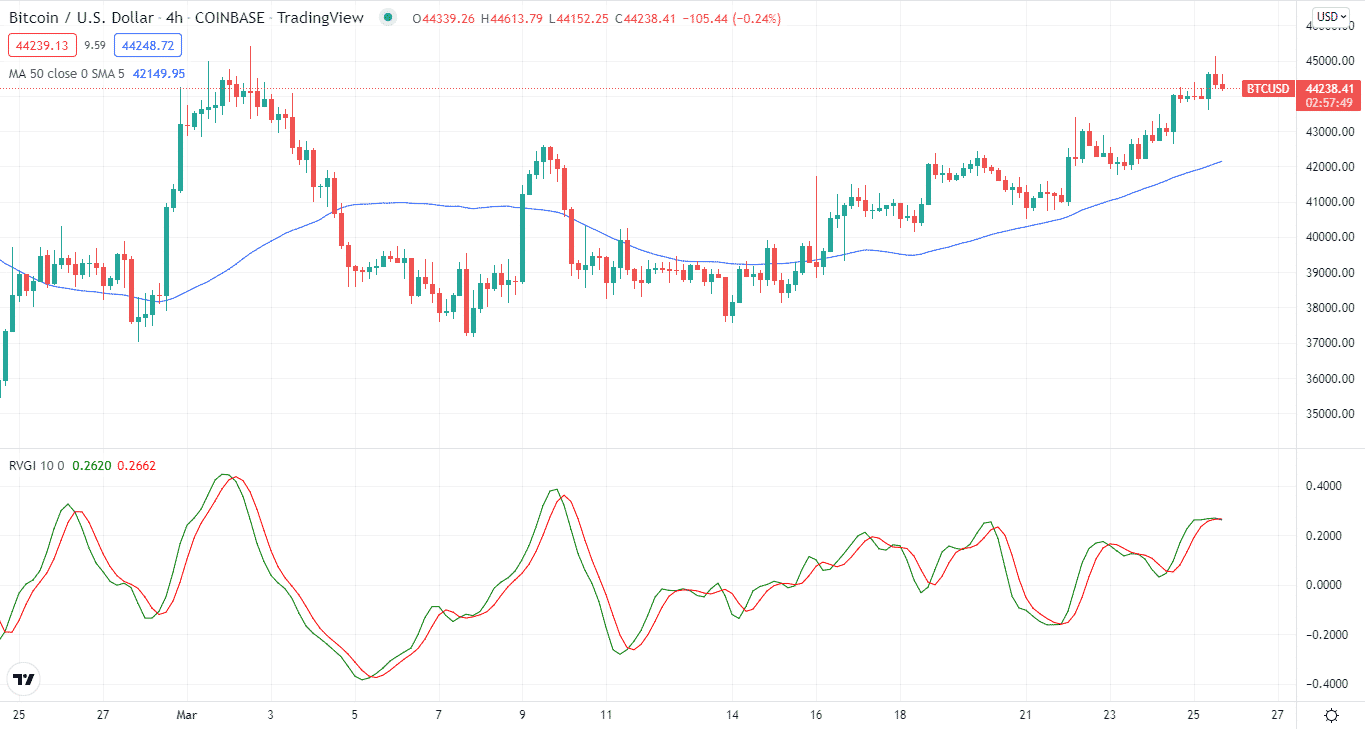
Tip 3. To combine it with MA
In trending markets, MAs are known to smooth out. However, when two MAs are used, a trend reversal can be established when the faster one passes, the slower one above or below, depending on the previous trend.
Why does it happen?
We combine two simple moving averages to find the direction of the trend. The two simple moving averages are at 50 and 200. In addition, we use a fast and slow-moving standard to see the potential trend change earlier.
How to avoid the mistake?
Do not add any other technical indicators to the mix for this strategy. The only addition will be price action patterns of individual candlesticks.
Tip 4. To combine it with the MACD
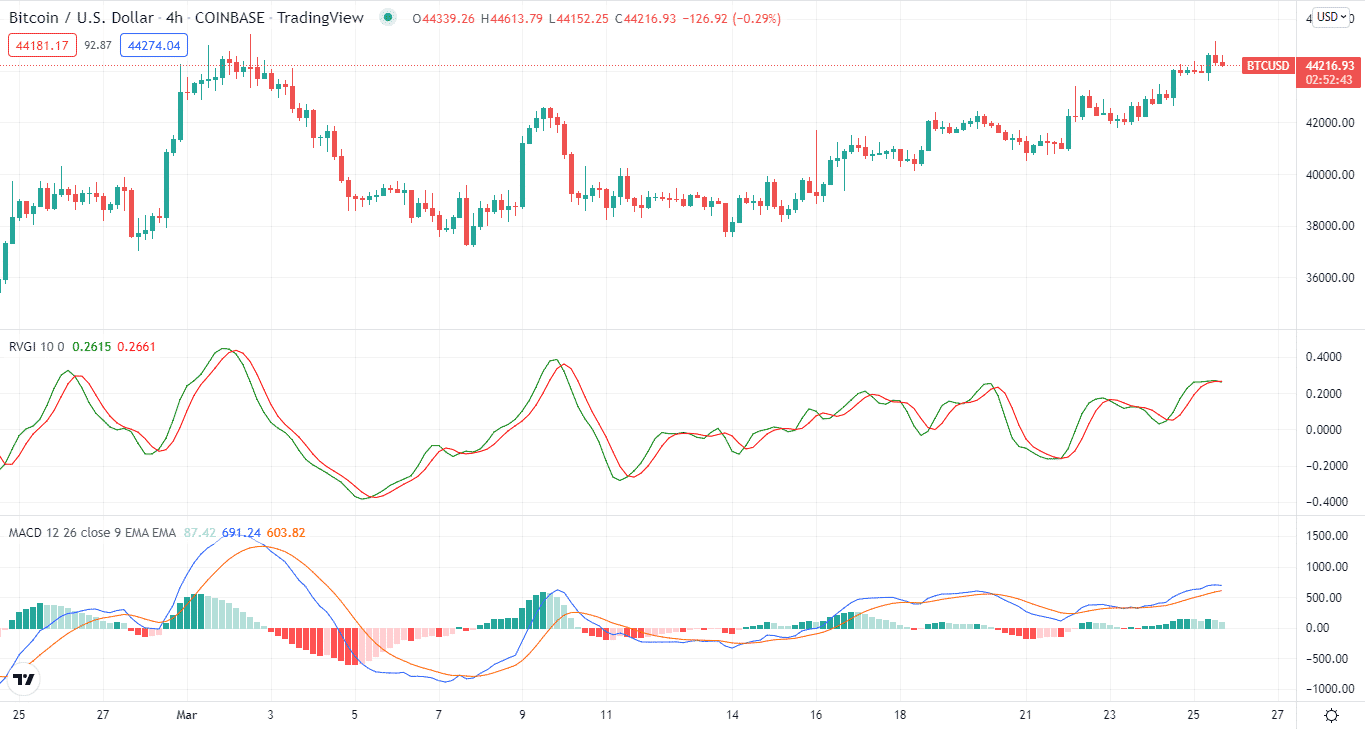
Like the previous strategies, we can also use the MACD and the RVI.
What does it happen?
The most crucial indicator from MACD is when the trigger line crosses the MACD up or down. The second is the RVI line. When the trigger line crosses the RVI up or down, this is the most crucial RVI signal. Third, the MACD indicator combines with the RVI.
Including an oscillator, such as the RVI, will give further context for overbought/oversold circumstances, while the MACD will validate if the trend’s momentum or strength is maintained.
How to avoid the mistake?
If one of the indicators crosses, we expect the other indicator to travel in the same direction. If this occurs, we will go long or short and hold our position until MACD signals us to close the trade.
Tip 5. To combine it with Bollinger Bands
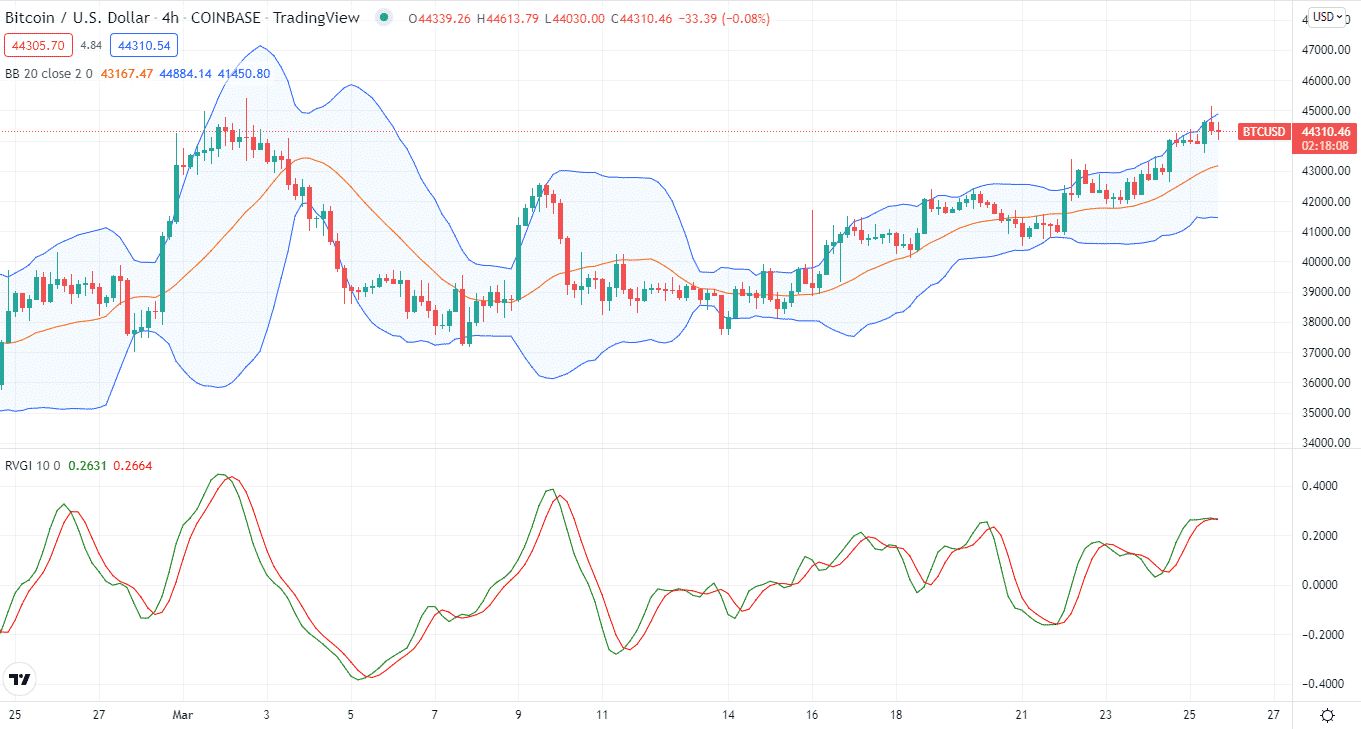
Finally, the last tip combines the indicator with Bollinger Bands (BB). Like other indicators, combining BB with the RVI produces fewer false signals.
Why does it happen?
The movement between the RVI and BBs implies that the trend will move in the direction of the RVI’s trend shortly. So, for example, if a crypto’s price increases while the RVI indicator decreases, the price will likely reverse shortly.
How do you avoid mistakes?
In range-bound markets, the RVI tends to give false signals. Setting a longer timeframe improves results by reducing the influence of whipsaws and price pullbacks.
Final thoughts
The RVI is an excellent indicator for finding the direction of the trend. It works like traditional oscillators like RSI, MACD, and others. However, as discussed earlier, the RVI works best when combined with other indicators.


