Should you be familiar with all of the many forms of moving averages? Not at all. However, there is one MA that you may not be aware of, and it might be one of the greatest MAs around.
This guide will talk about the type of MA known as SMMA. Then, we’ll proceed further with the top five tips on using the SMMA for crypto trading.
What is the SMMA crypto trading strategy?
The Smoothed Moving Average, aka SMMA, is a combo of two MAs. They are a simple moving average (SMA) and an exponential moving average (EMA). It gives present prices the same weight as old prices since it considers all accessible price data.
The SMA divides the price of a selected cryptocurrency by the period being evaluated, but it considers all periods equally. The EMA and the SMA, on the other hand, emphasize the current price.
The SMMA gives a wider picture of things by smoothing out short-term market fluctuations. This increased clarity assists traders in quickly confirming market trends.
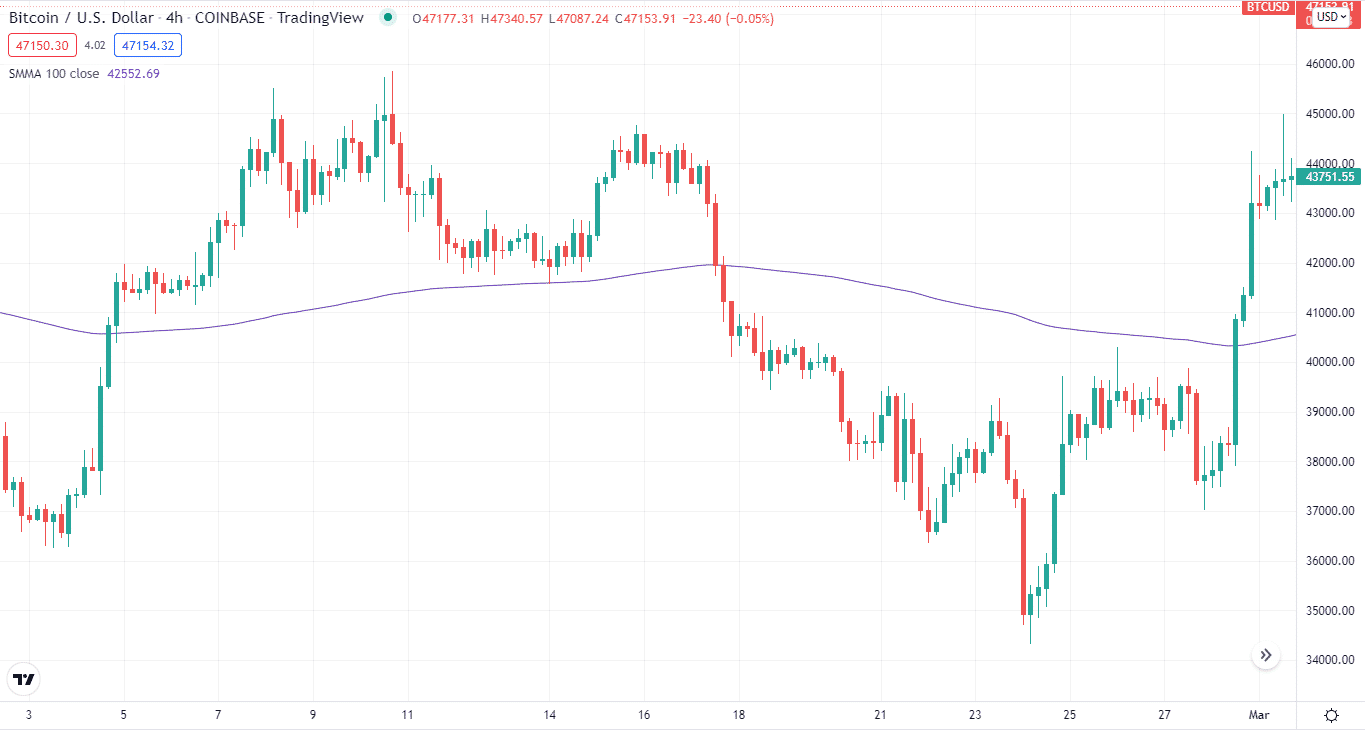
It is suitable for traders primarily concerned with the long term, as it has a lot longer delayed reaction than the SMA and EMA. On a daily chart, a 100 or 200 SMMA, for example, effectively depicts the cryptocurrency’s long-term trend.
Top five tips for trading with SMMA
Now you know what the indicator is all about. Let’s move on to the juicy part of the guide. Here are the top five tips for crypto trading with the tool.
Tip 1. Finding a trend
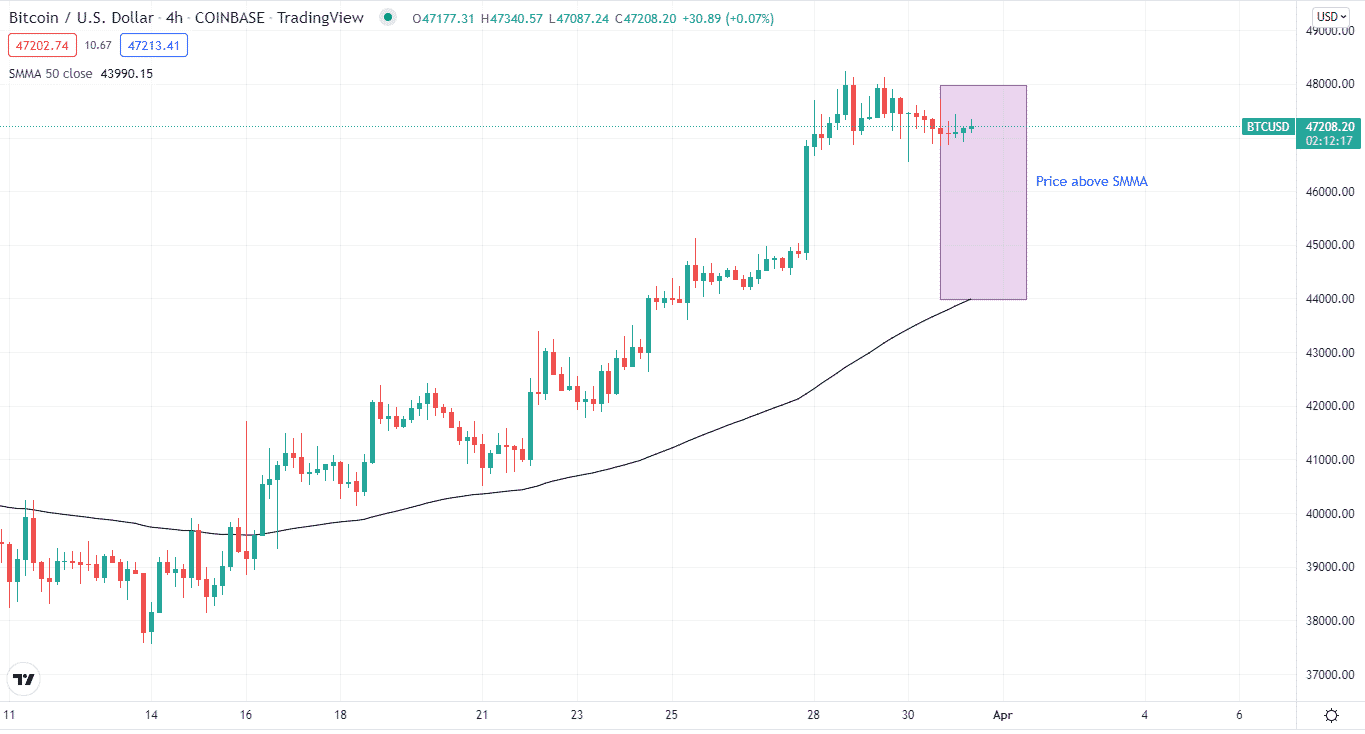
The SMMA’s most fundamental function is to determine the trend. The trend is positive if the price is above the indicator. On the flips side, the trend is negative if the price is below the SMMA.
Why does it happen?
The simplicity of this trading method is what makes it so appealing. It’s only useful to buy crypto when you’re convinced that its value will rise, allowing you to benefit nicely. Based on the current market direction, the smoothed moving average line is a reference for determining whether to buy or sell.
How to avoid the mistake?
The SMMA’s flaw is that it takes longer to react to fast price movements, which often occur near market reversal moments. As a result, additional indicators must be used to confirm the signal in addition to the tool.
Tip 2. Finding the dynamic support and resistance
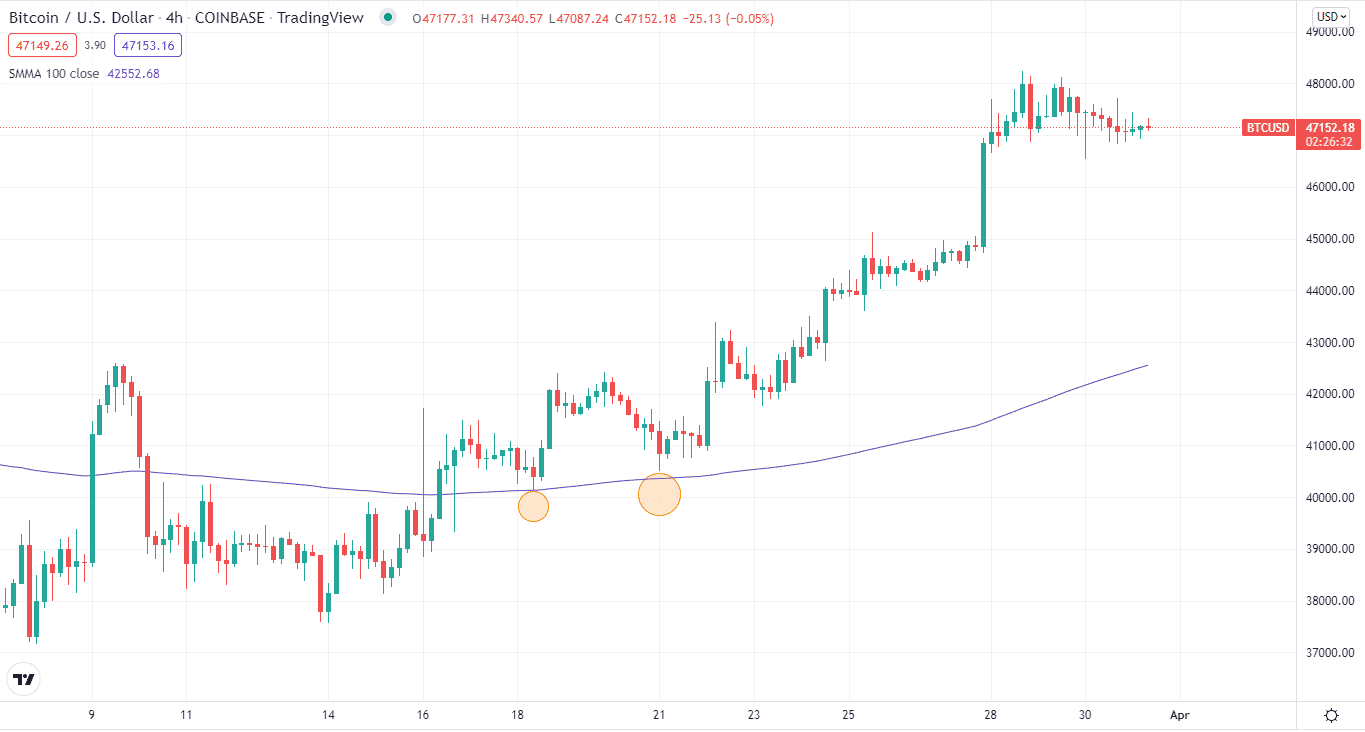
Another way to use the tool is to use them as dynamic support and resistance.
Why does it happen?
It’s named dynamic because, unlike traditional support and resistance lines, the levels here are continually shifting based on the current price movement. Take a look at the chart below. When the price hits the 100-day SMMA, it bounces back, indicating that the indicator is acting as a support level.
How to avoid the mistake?
When using the SMMA as support and resistance, keep in mind that the price might sometimes flirt about the line when the market consolidates. However, you’ll see distinct support or resistance signals more frequently with practice.
Tip 3. Identifying key market reversals
Detecting possible price reversals is a huge chance to initiate or exit a trade. It is called a reversal when a current trend ends, and a new one develops in the opposite direction.
Why does it happen?
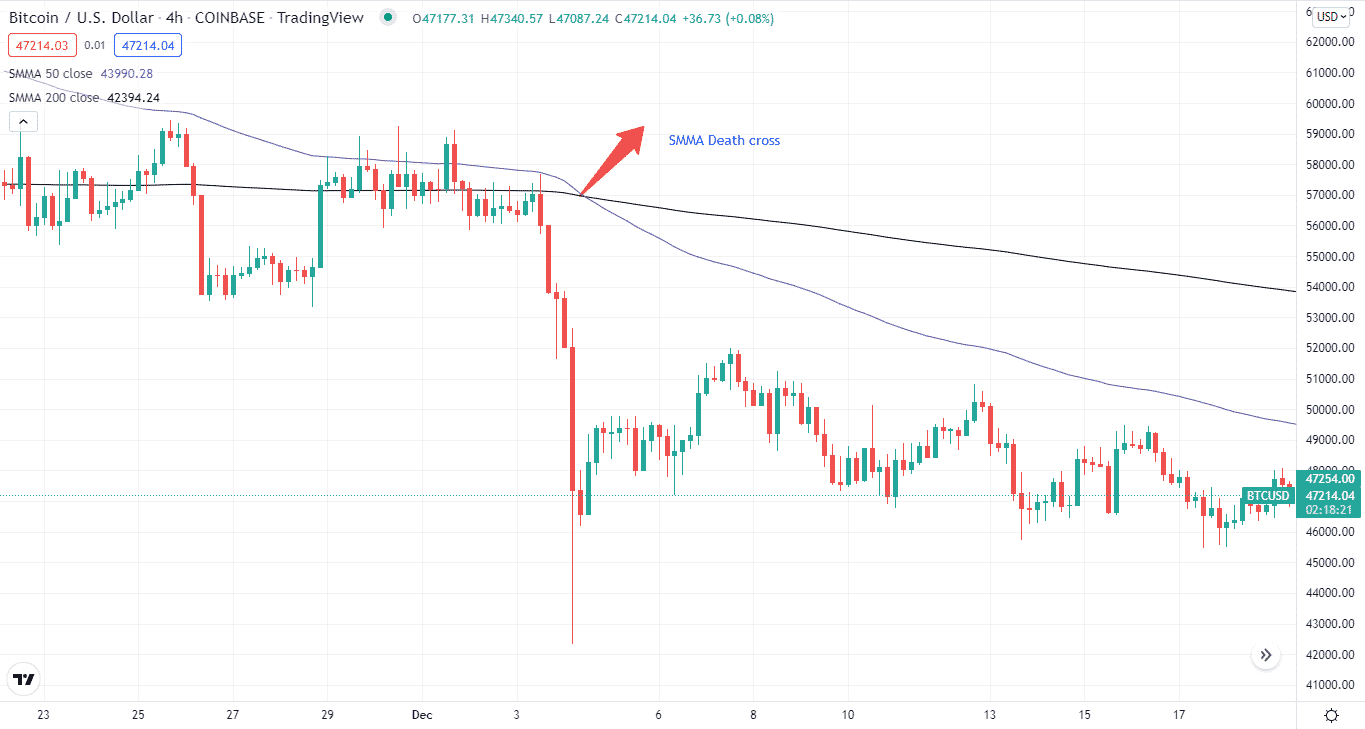
When combined with another SMMA, it is one of the most successful tools for trading reversals. The goal is to seek crossover between the two trendlines.
The most typical periods used here are the 50-day and 200-day SMMA indicators. We get two types of crosses when we use this indicator or any other MAs.
- When the two SMMA lines cross in a bullish direction, it’s a golden cross.
- When the lines make a bearish crossover, it’s a death cross.
How to avoid the mistake?
To assess whether or not the crossing is viable, you may need to add other indicators such as an oscillator.
Tip 4. Using the 200-day
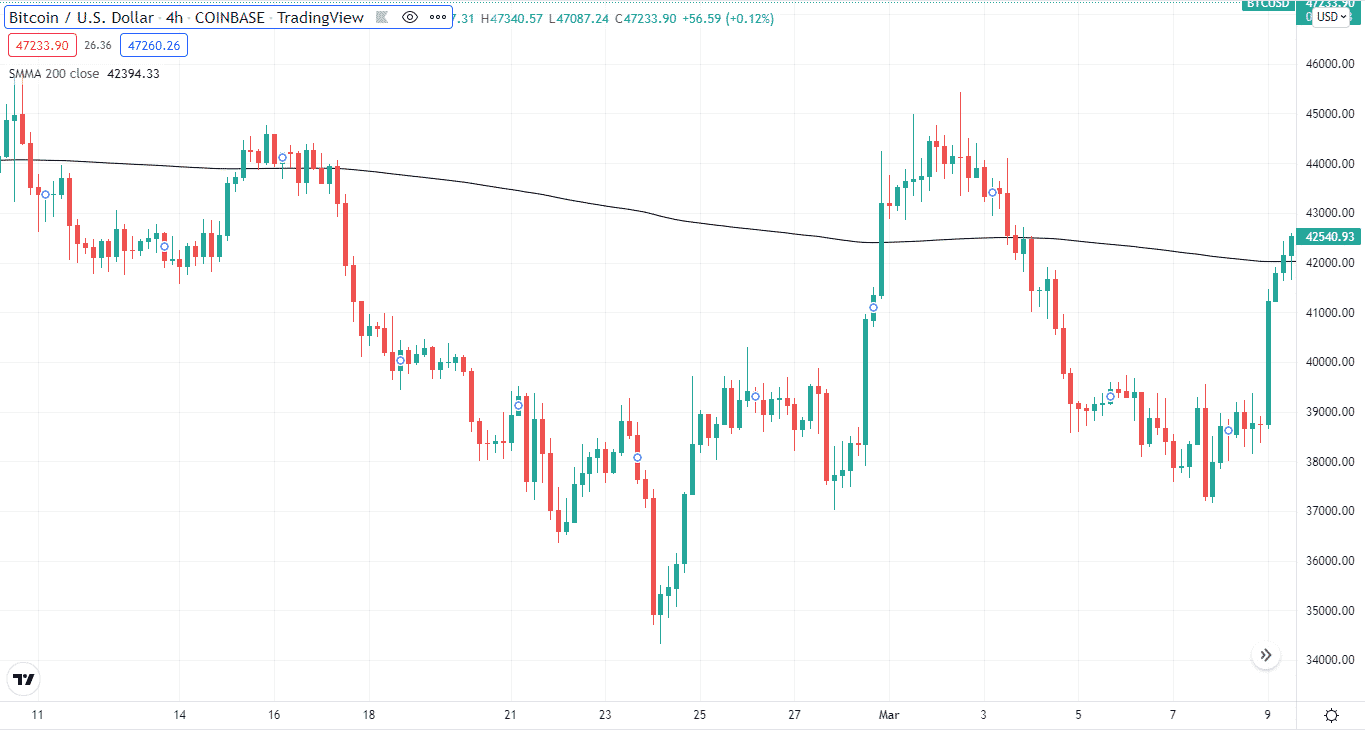
The 200-day SMMA is one of the most popular since it provides a larger picture. It provides us with long-term price movement historical data, which may assist traders in developing a profitable trading strategy.
Why does it happen?
To determine, say, Bitcoin with a 200-day MA, take the price movements of BTC for the previous 200 days, add them up, and then divide by 200. Then, simply substitute the most recent closing price for the oldest number to apply it daily.
After completing the setup, you may evaluate it and apply it to plan your strategy.
How to avoid the mistake?
Remember that this formula remains the same regardless of the period used, so you may use it for shorter or longer durations.
Tip 5. Trading on the current price
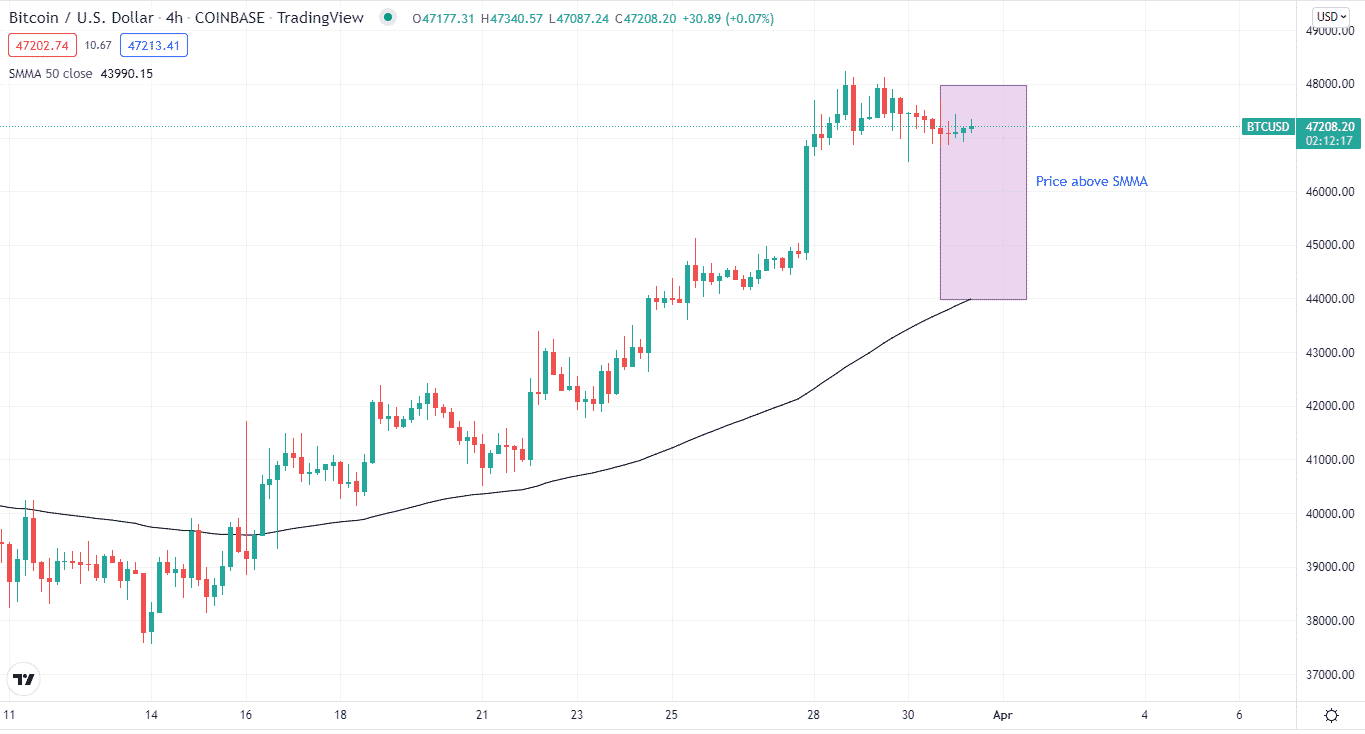
You look at the current price and compare it to the SMMA indicator line in this trading strategy. This method might assist you in making an informed decision if you’re just starting your trading day and seeking great entry points.
Why does it happen?
It’s a buy signal if the crypto’s current price moves above the SMMA line. When the current price falls below the SMMA line, you sell, and when it climbs over it, you exit the trade. Conversely, you exit the position when it falls below the line.
How to avoid the mistake?
Take note that the SMMA is only effective in a particular market situation. So, for example, it can’t give much useful information if the price goes sideways.
Final thoughts
SMMA is one of the most effective indicators for crypto trading. Its effectiveness differs from other moving averages. You can use the indicator for various strategies in crypto trading.


