Everyone is looking for the best trading setup that would lead to consistent profits. However, not many seem to have found it. The number of losing traders is a clear manifestation of this truth. Perhaps, there is no such thing as the “holy grail.” Thus, it pays to content ourselves with a reasonable strategy that we come across and find a way to make it work.
Trade with the trend
Trading with the trend is a suggestion you often hear when trying to learn how to trade or looking for a strategy. This suggestion is precious, though. You should factor the trend into your strategy to give it a slight edge. Of course, you can still trade against the movement if you have otherwise mastered that strategy. For beginners, trend trading is always the more practical approach.
There are many ways to identify the trend. The first is through price action. By simply eyeballing any chart, you can quickly tell if it is trending or not.
- If price prints higher highs and higher lows, then the market is trending upward.
- If price makes lower highs and lower lows, then the market is trending downward.
Another popular tool among traders is the moving average (MA). With this tool, trend identification is easy and more objective.

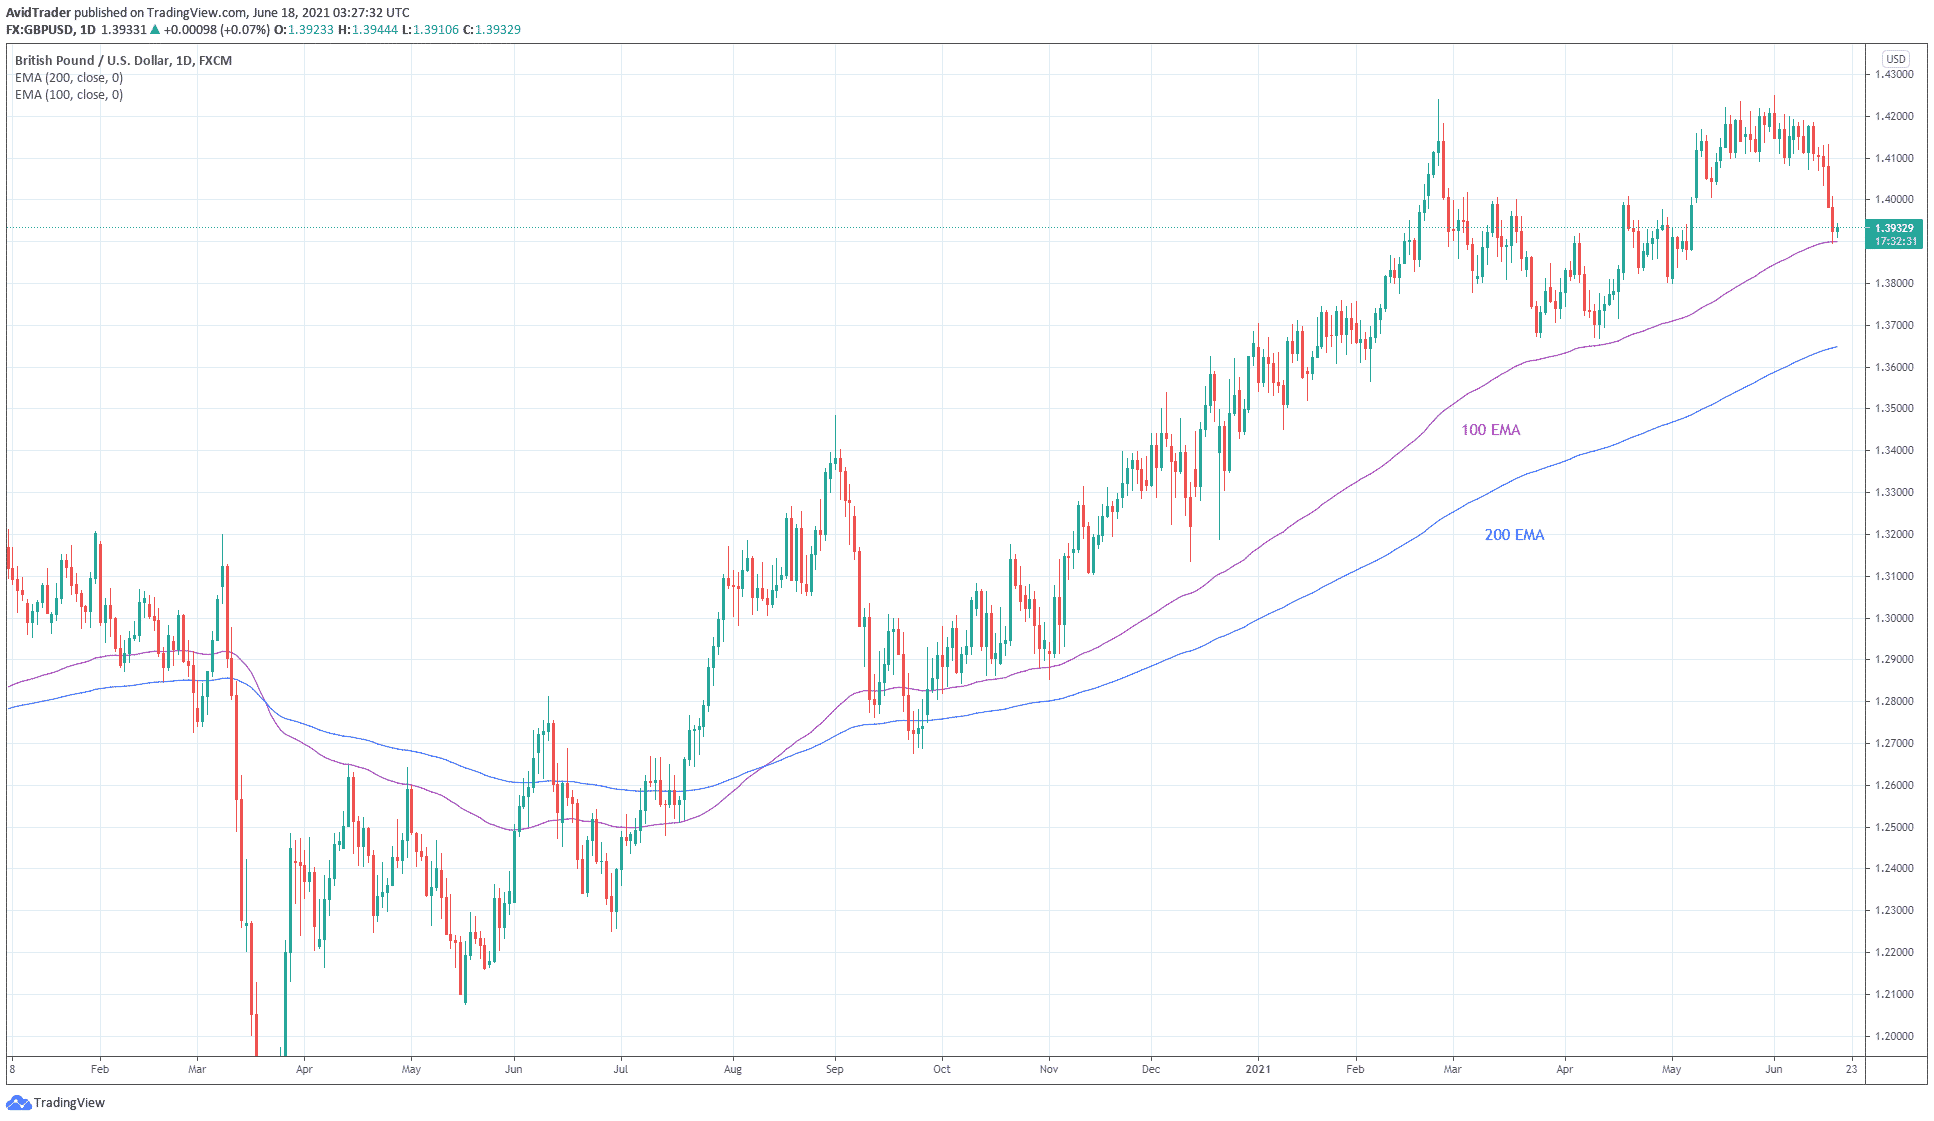
Consider the above daily chart of GBP/USD. The easiest way to spot the trend is using the moving average to identify the price location.
- If the price is above the average, then the market is trending up.
- If the price is below the average, the market is trending down.
The 100 EMA and 200 EMA are the best periods of MA’s for this purpose. Other traders use shorter periods like 50 EMA. Still, others use more extended periods, such as 400 EMA. However, the 100 and 200 MA’s are practically the best deal.
Other types of moving averages also work, such as simple, linear weighted, smooth, and others. However, more users are leaning toward the exponential type. The reason is that the EMA gives more credence to new data while still giving a good account of the overall trend. The EMA reacts faster to price changes so that you can act more quickly.
Trade with support and resistance
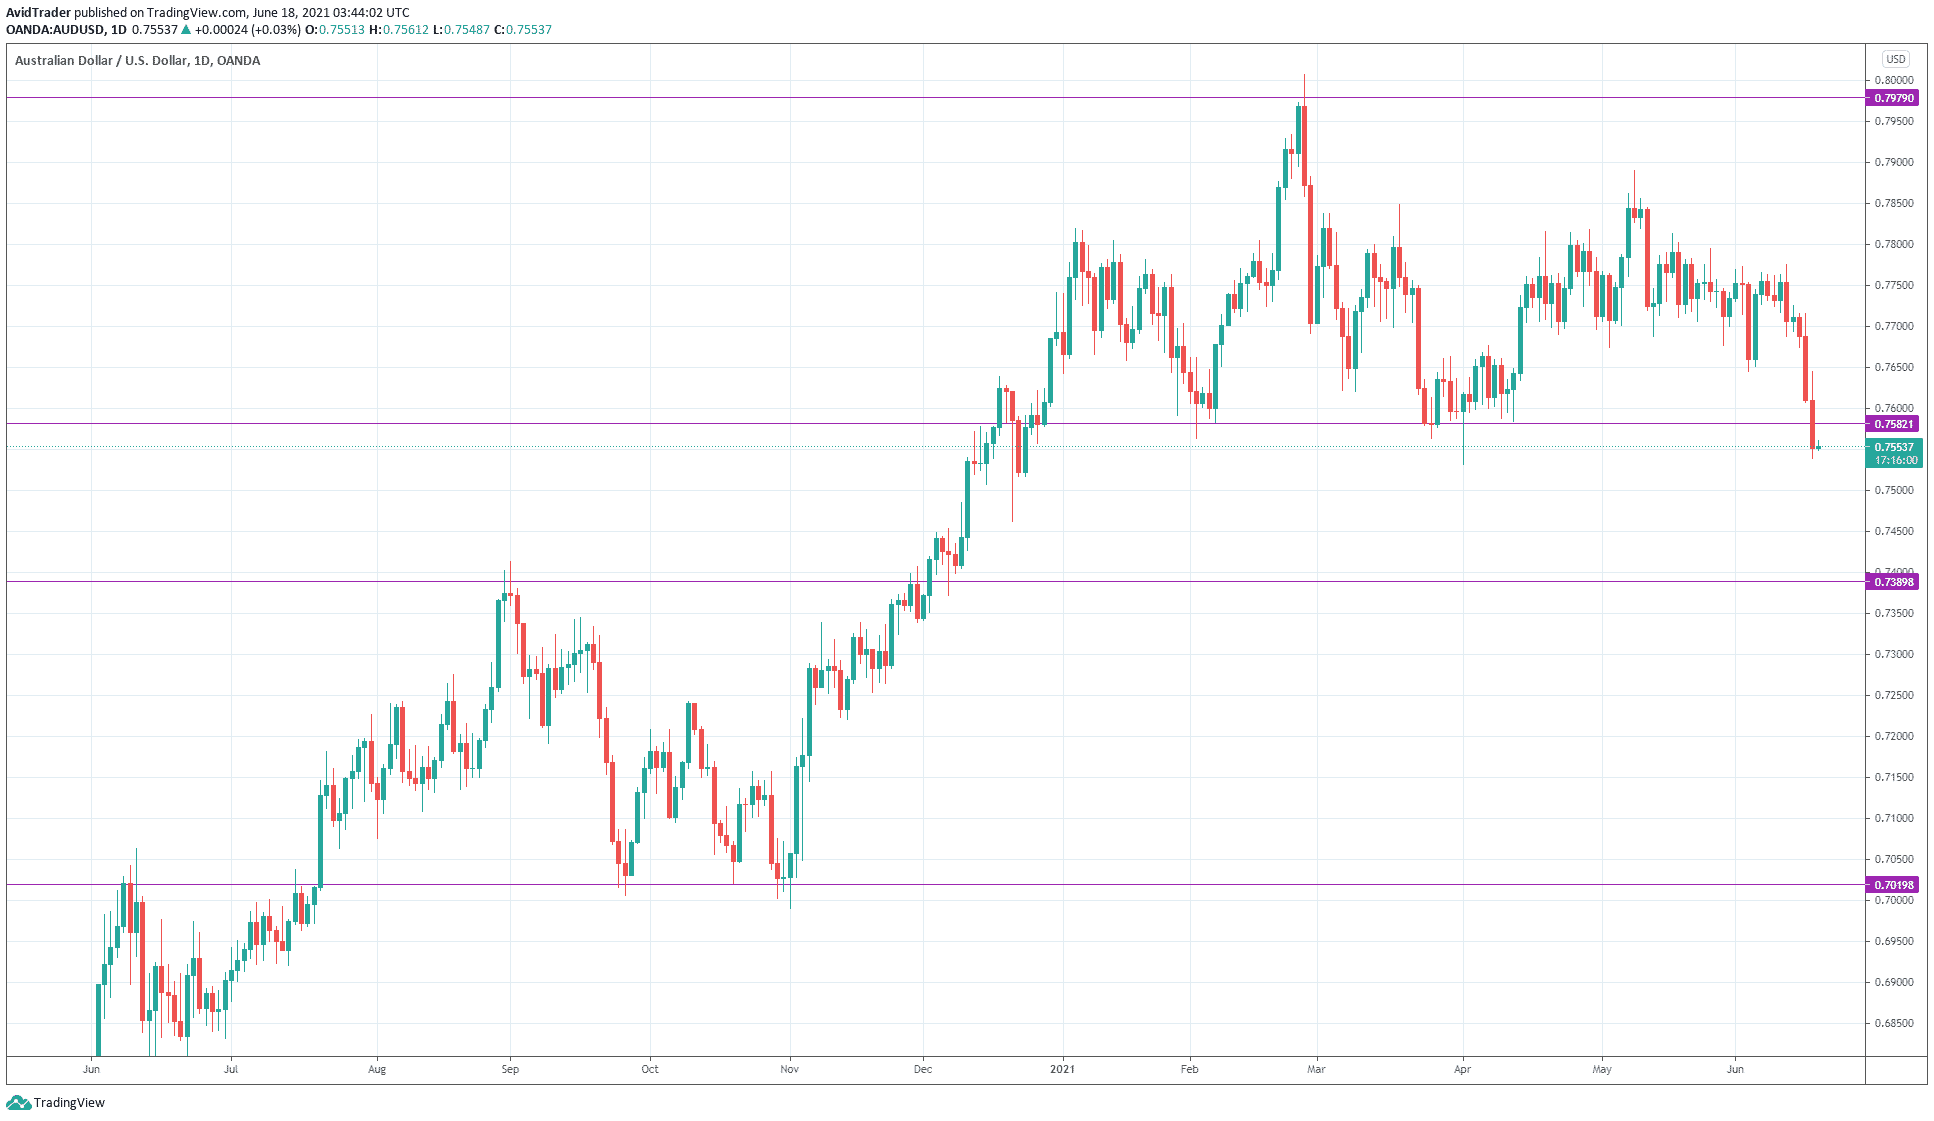
To stack up more edges to your trading strategy, you can factor in classical support and resistance. This refers to the horizontal lines you place on your chart to mark significant swings where price repeatedly fades away after making contact. Of course, trend lines are adequate for the support and resistance as well. However, traders understand that horizontal support and resistance are slightly more objective than trend lines.

Consider the above AUD/USD daily chart. We marked the significant support and resistance levels with maroon horizontal lines. As a trader, you should be looking for entries around these levels. Often, it makes more sense to think of support and resistance as zones or areas rather than levels on the chart. In addition, these zones tend to hold more value if you plot them on higher time frames, such as daily and weekly charts.
Trade with candlestick patterns
Candlestick trading is arguably the simplest type of price action trading. With this approach, you do not have to learn complex structures or price patterns to trade currencies. You focus on specific patterns that work time and again.
The most effective candlestick formations are the following:
- Bullish and bearish hammers
- Bullish and bearish engulfing candles
- Inside bar
- Evening star and morning star
- Piercing line and dark cloud cover
- False break pattern

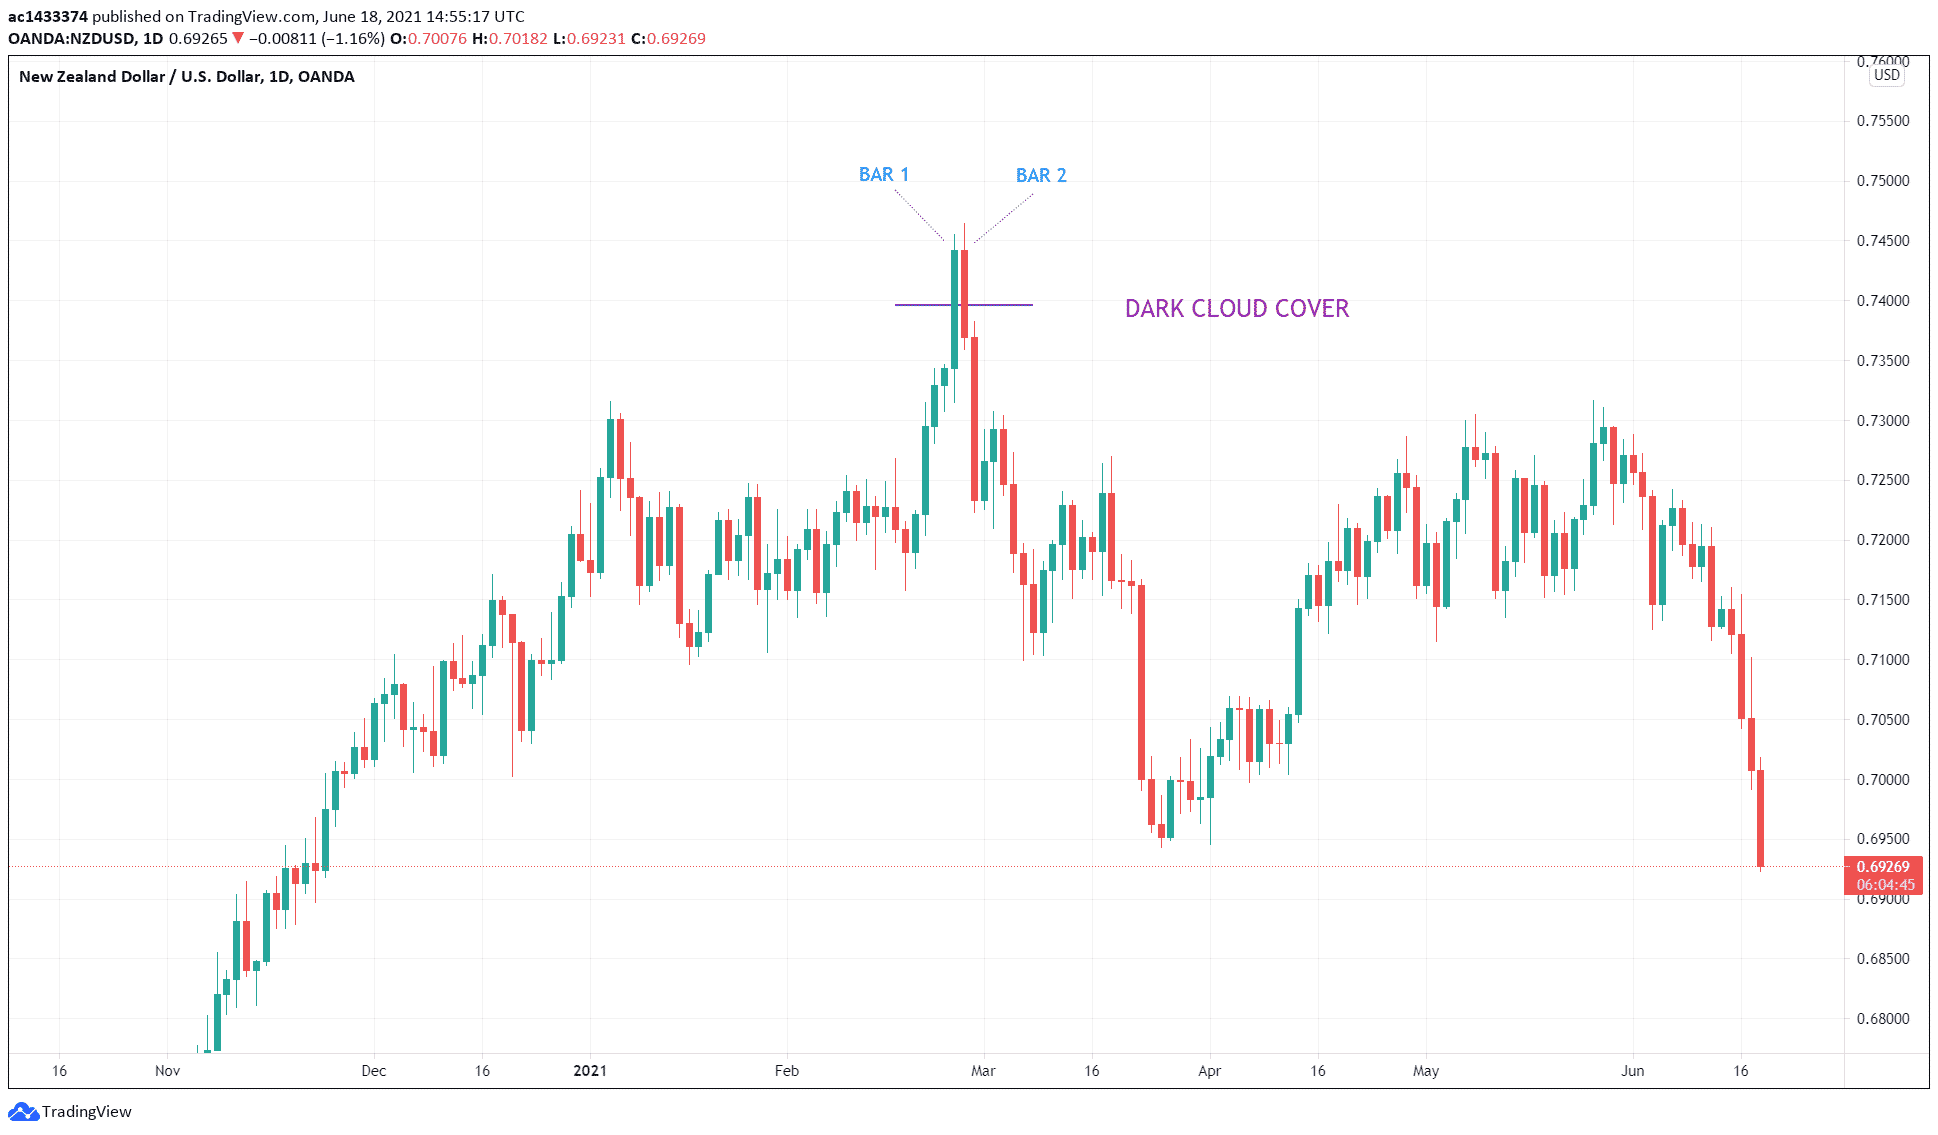
Let us take the above daily chart of NZD/USD into consideration. This example shows a dark cloud cover formation.
- The pattern is made up of two candles, marked bar 1 and bar 2.
- As you can see, the first candle is green while the second candle is red.
- The short horizontal line marks the estimated midpoint of the previous candle.
- A valid pattern exists if the second candle closes below the middle of the last candle’s body. In this case, the pattern is indeed useful.
If you are familiar with the candlestick pattern, you can make the case that the dark cloud cover is a milder version of the bearish engulfing pattern. The dark cloud cover provides a bearish signal, so you should take a short position when it shows up.
This is only one example of candlestick patterns you can use. The piercing line is the exact opposite of the dark cloud cover and carries a bullish tone. There are other patterns in the list above that you can look into. All of them can prove effective when taken in the proper context. It is best to trade these patterns when they appear in specific locations, such as around support and resistance zones.
The simplest trading method
Probably the most straightforward trading strategy is the support and resistance play. Seasoned traders know this strategy fully well, but they give it different names. Some names include break and retest, mirror flip, backward retest, and others. All of these names refer to one method, which this section will present in complete detail. This section will put together the elements covered in the previous areas.
As you might have guessed, the trading strategy consists of three elements. While this strategy may work even with one or two elements only, you can realize a higher strike rate if all components are in place.
These elements are the following:
- Trend
- Support and resistance
- Candlestick formation

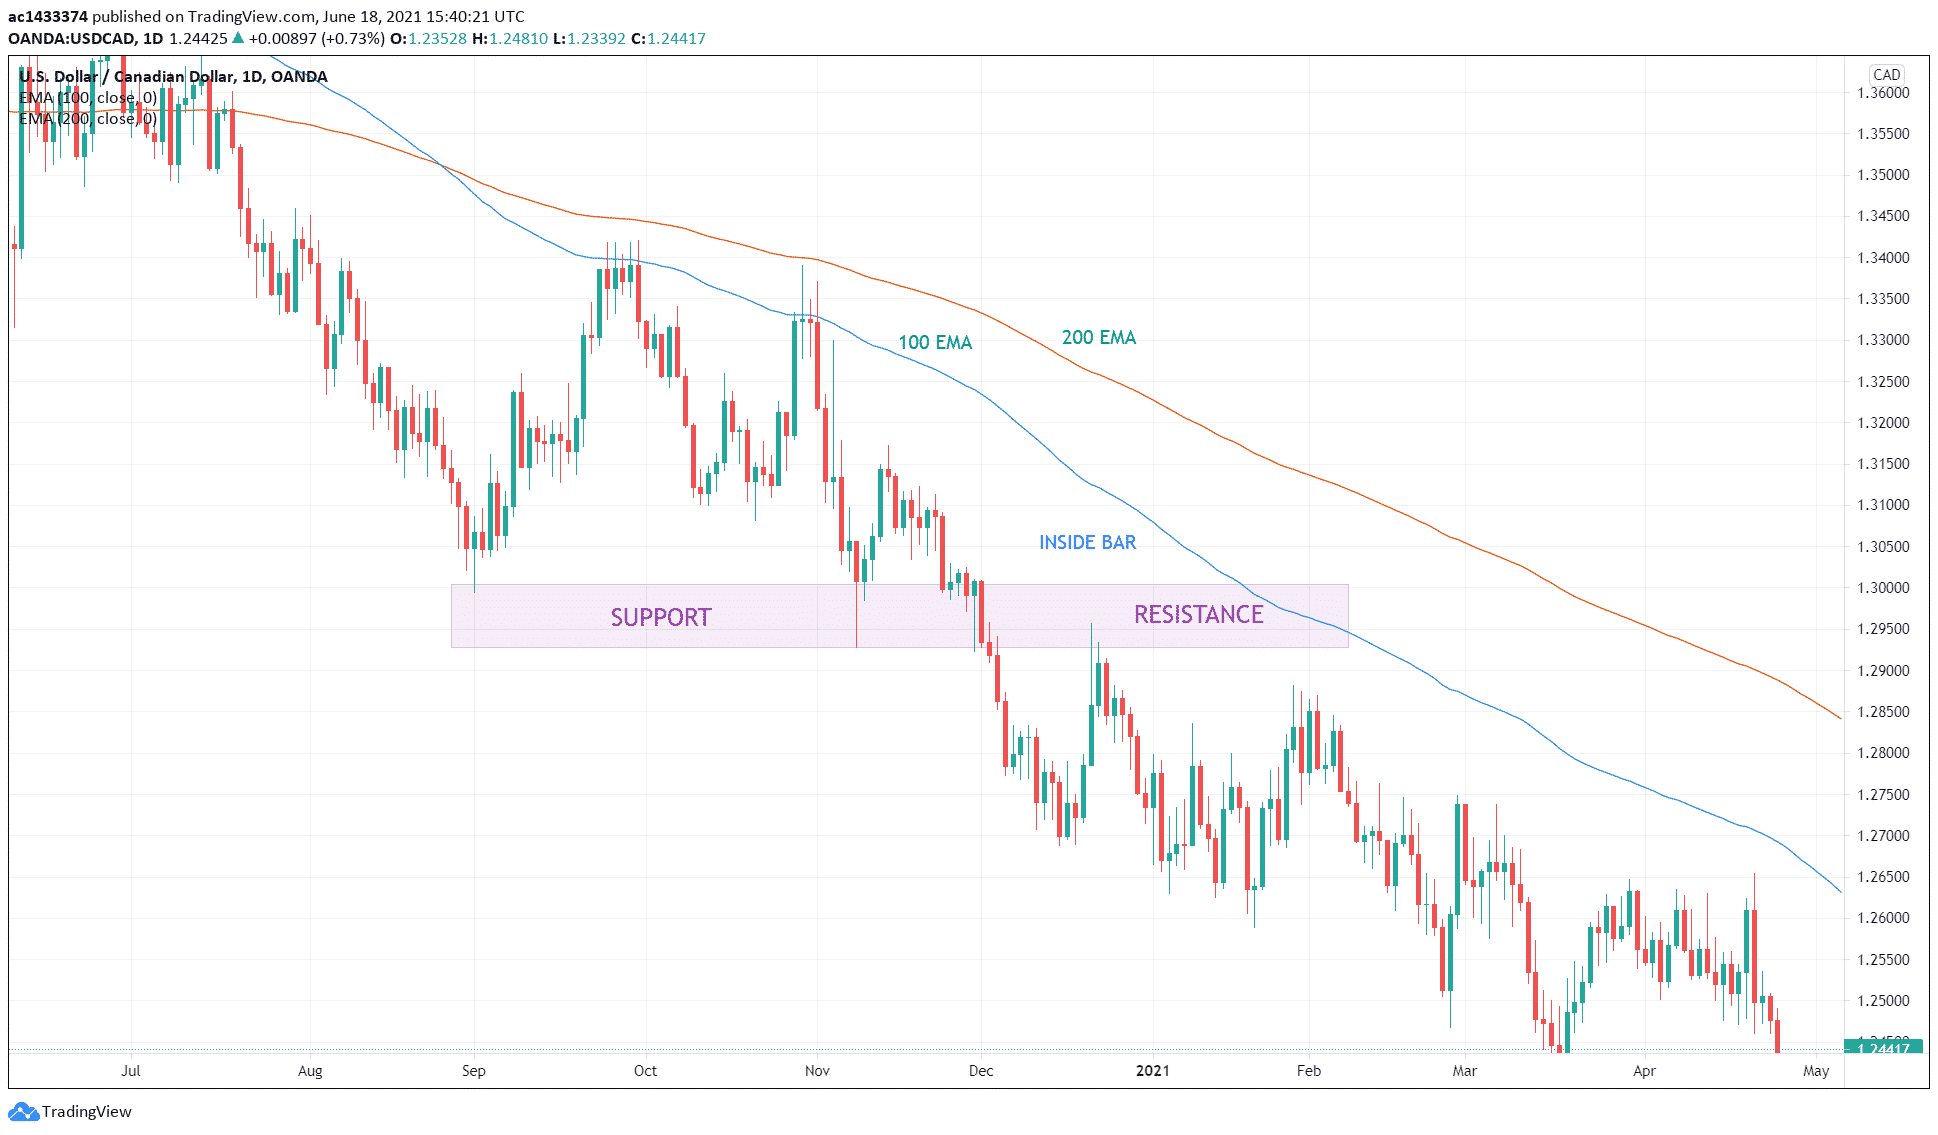
The above USD/CAD daily chart shows a setup with all three elements in place.
- First, the trend is down because 100 EMA is below 200 EMA.
- Second, an evident horizontal support and resistance zone exists. We have identified this zone as previous support turning into resistance.
- Third, during the zone retesting, price forms a bearish inside bar setup. The inside bar pattern is the third element.
While it is not clear in the above chart, the inside bar consists of two candles, with the second candle wholly contained within the previous candle’s range. As a result, you might find it challenging to enter the sell trade here. However, one sell entry method you can use takes a short position when the price starts breaking down. The red candle breaking the low of the inside candle marks this event.
Final thoughts
The previous section shows the complete picture of the most straightforward trading strategy of all. The concepts of trend and support and resistance are already familiar to virtually all traders. The area that needs further study is candlestick patterns.
You can utilize any candlestick pattern that forms in the area of support and resistance. Any such pattern is just as effective. In the author’s humble opinion, this is the most straightforward trading strategy in existence. You cannot find a setup as simple and as effective as the support and resistance play.


