Traders learn about the concept of multiple time frame analysis at some point while learning how to trade. They understand that incorporating this concept in trading can lead to better trade results. However, over time, they seem to forget this element of market analysis as they go along their journey.
To find their trading voice, traders begin to specialize. They start to assume a specific trading style, such as:
- Breakout trading
- Counter-trend trading
- Day trading
- Guerilla trading
- Scalping
- Swing trading
As a result, they miss apparent trade opportunities occurring in well-defined support and resistance areas and fail to see the overall trend.
What is multiple time frame analysis?
It is a trading approach designed to increase the odds of finding winning trades and reduce trade risk. It involves looking at a specific market from different perspectives using various time frames. Other traders call it the top-down approach.
With this approach, the trader uses:
- One or two higher time frames to understand the major trend
- One or two lower time frames to find trade setups and execute trade entries
What is essential in this trading approach is to understand where a prospective trade sits in the overall trend or market structure. You can expect better results if you take trades in lower time frames in the same direction as the trend in higher intervals.
Number of periods to use
There is no specific recommendation as to the number of time frames you should use in this approach. Any combination of periods is possible. However, traders adopt a general guideline. In most cases, three-time frames are good enough to get a good perspective of a market being considered. Less than three will cause considerable data loss, while more than three lead to redundant analysis.
In establishing the three time frames, you can follow a simple method known as the “rule of four.”
- Define the interval where you would like to find trade setups. If you think this is the hourly chart, then that is your middle time frame.
- To find the lower period, divide 60 minutes by 4, and you will get 15. Therefore, the lower time frame is the 15-minute chart. This is where you will make trade entries.
- The higher period is the 4-hour chart. Multiplying the middle time frame (60 minutes) by 4 equals 240. The 4-hour period is equivalent to the 240-minute chart.
Using three time frames is standard among traders. However, utilizing two time frames is also standard practice. For example, day traders refer to the hourly chart for trend bias and then look to the 15-minute chart for entry.
You will learn about another way of using multiple time frame analysis in the sample strategy section.
The best way to apply multiple time frame analysis
Having learned about multiple period analysis basics, you are now set to put your knowledge to good use. With this approach to reading charts, it is better to begin with higher time frames and work your way down to lower time frames.
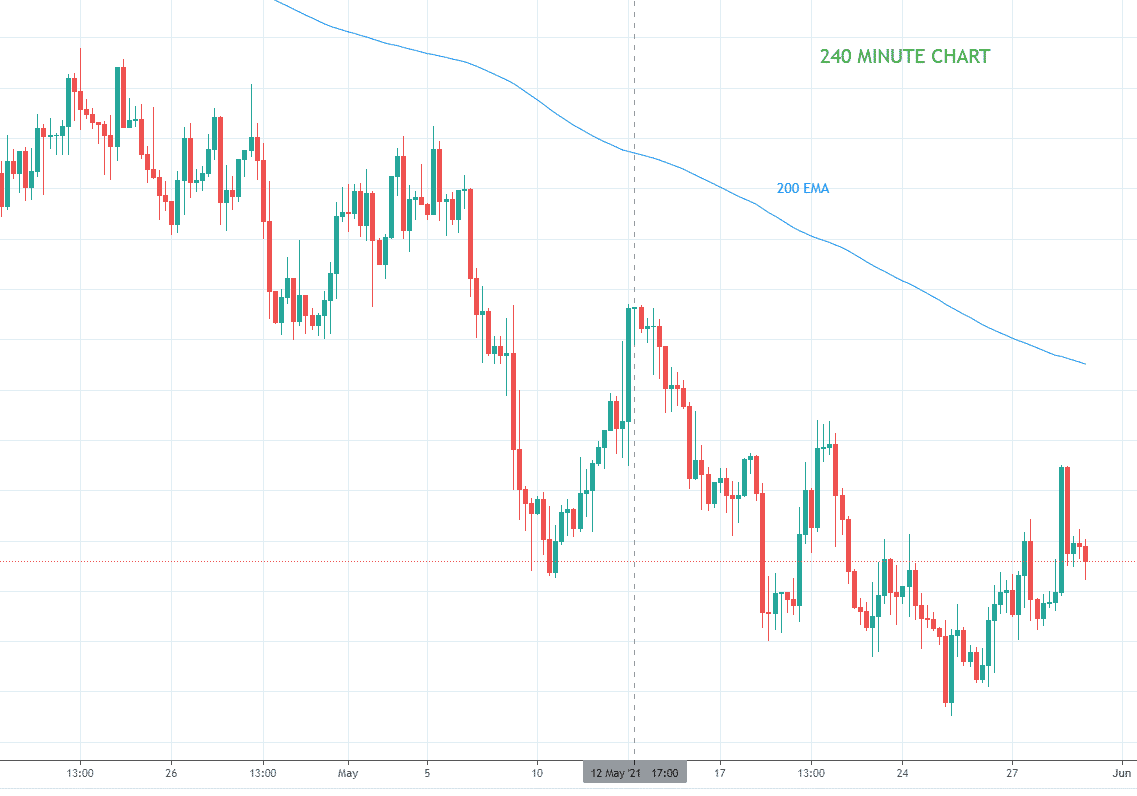
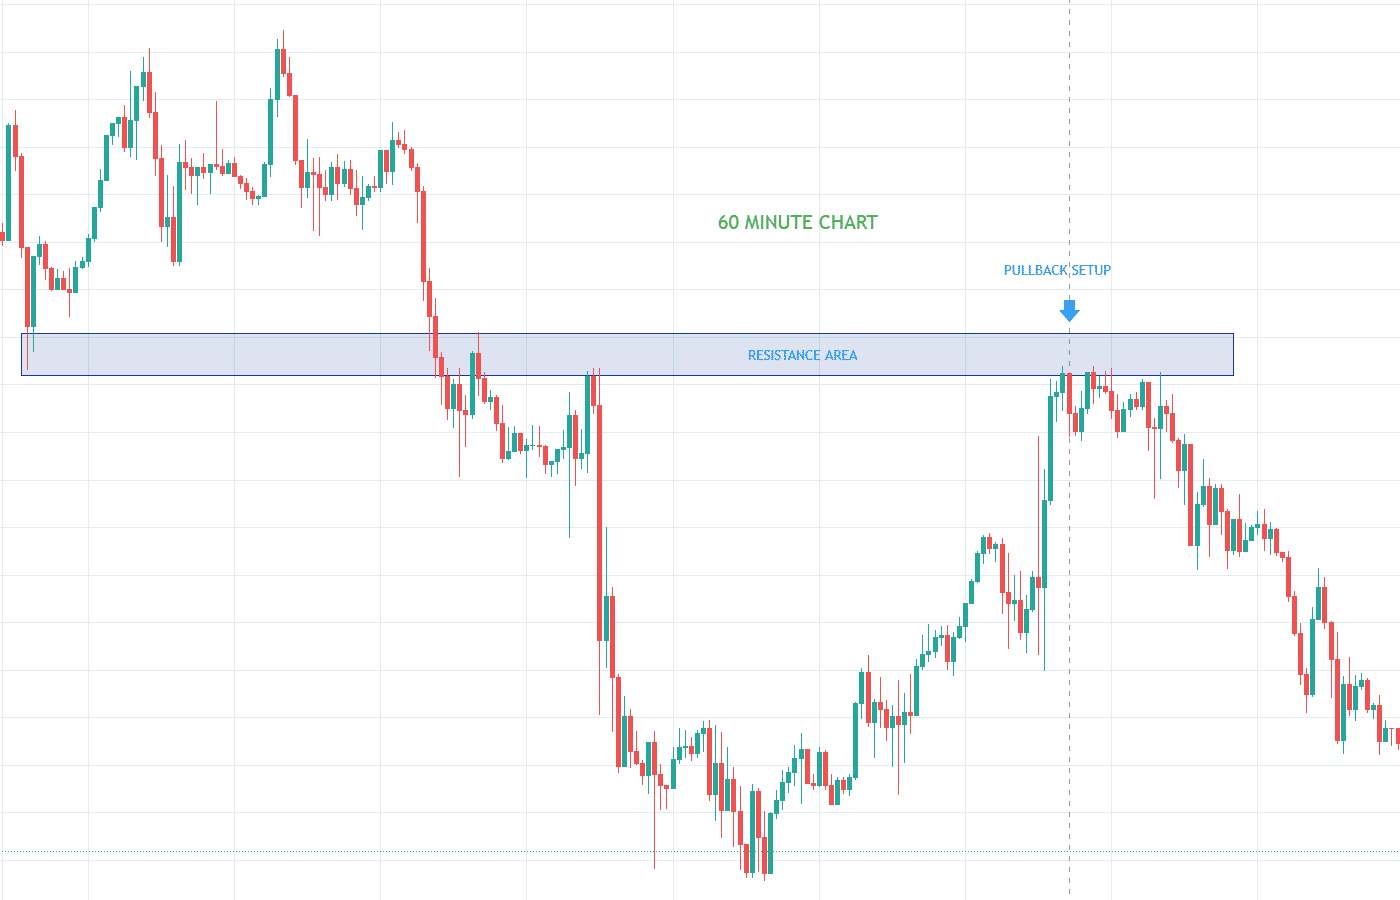
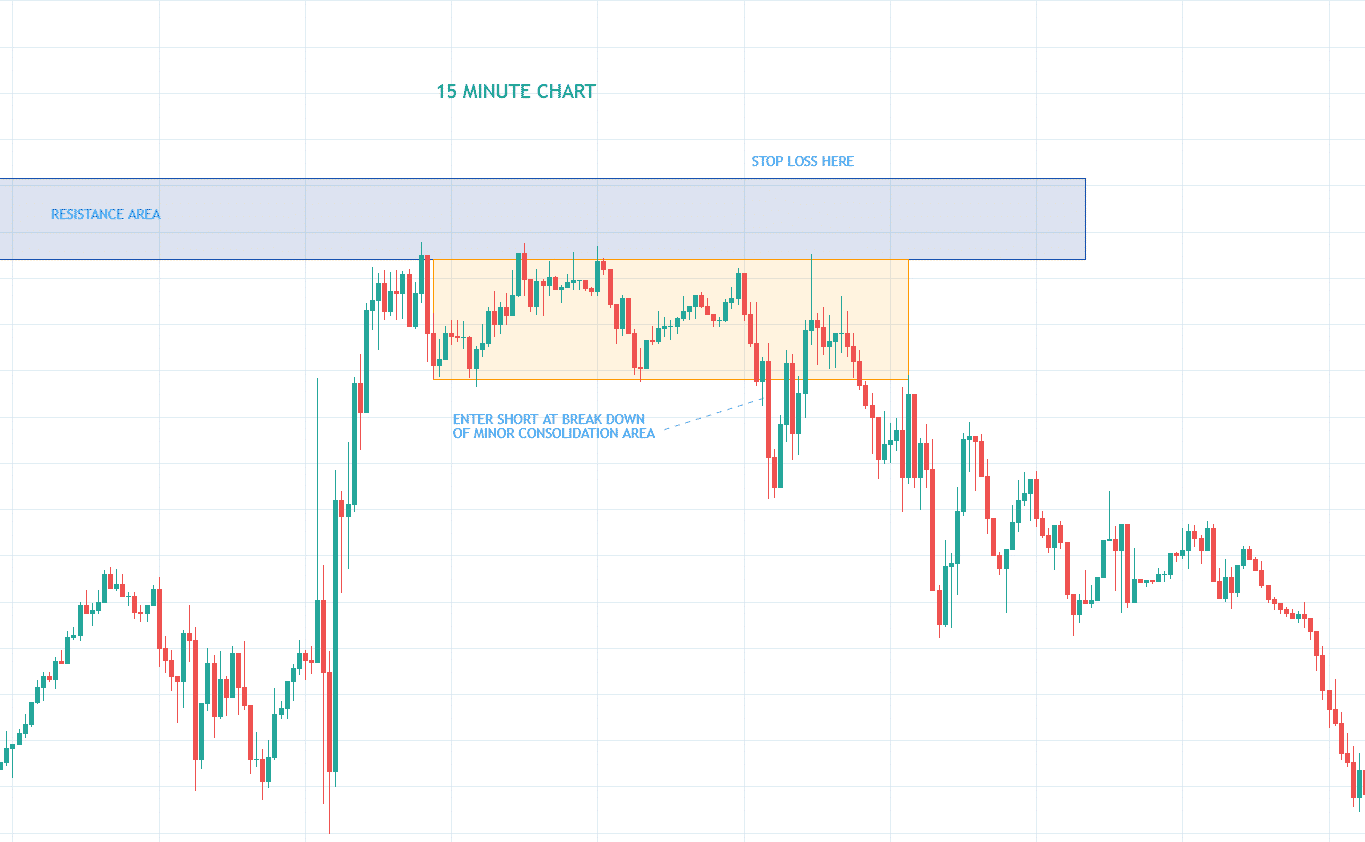
Try to look at the forest first before you look at the trees. So you do not get lost in the woods. This approach underscores the importance of trading with the general trend. The table below shows the best way of implementing multiple time frame analyses using three charts.
Trend time frame: 240 minutes
Setup time frame: 60 minutes
Entry time frame: 15 minutes
Sample strategy using multiple period analysis
Though practitioners use multiple period analysis in the following order:
- Identify the bigger trend
- Find a trade setup
- Take a trade entry
You can use this trading approach in another way. When you have gained enough trading experience, you will realize that trends persist for a long time. Thus, even if the price is significantly away from a long-term moving average and seems overbought or oversold, you can still take trades in line with the trend many times over.
The most effective way to trade forex is when periods line up. So if you are not aware of it yet, when a market trend, the trend is visible in most time frames, starting from the weekly chart to the hourly chart.
This article will present a sample strategy based on this concept. In this strategy, we will use three time frames. When all three periods trend in the same direction, we open a trade in the lowest time frame.
240 minutes
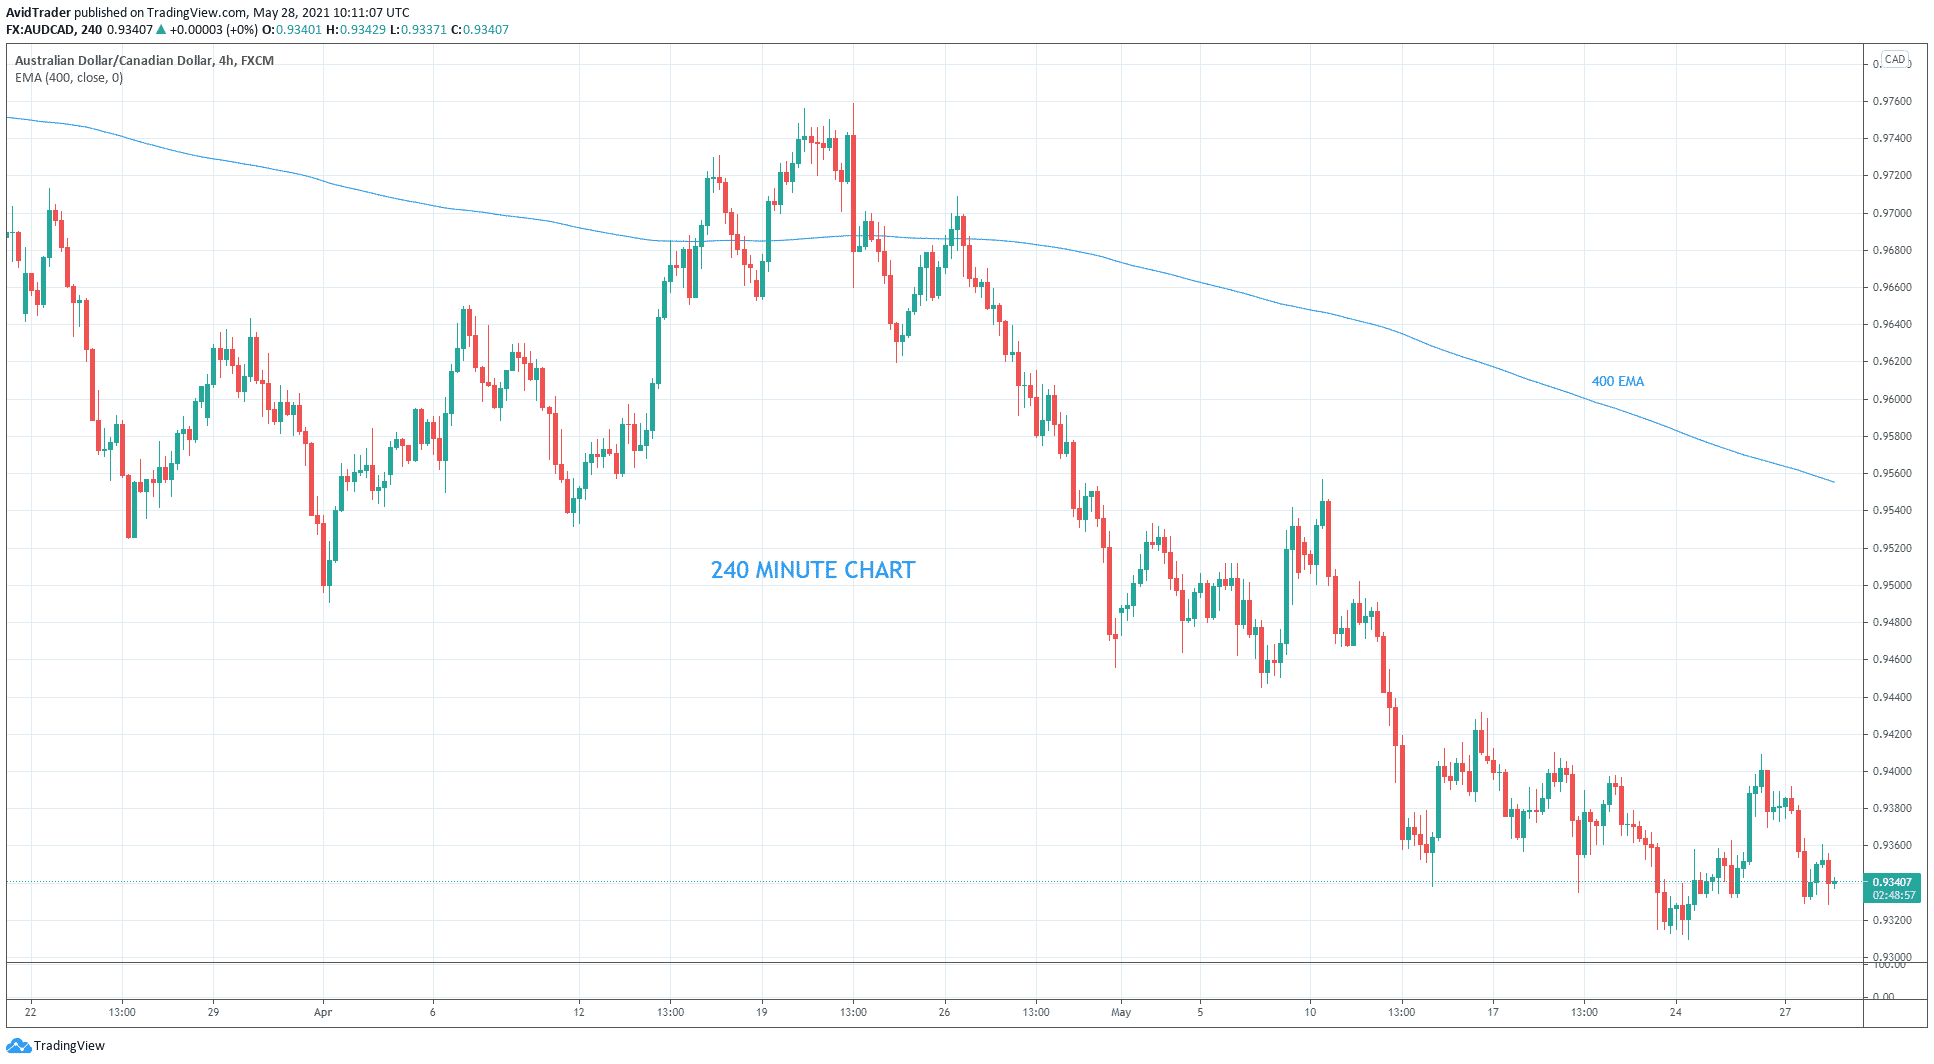
The above image shows the four-hour chart of AUD/CAD. Since 400 EMA is going down, then the trend in this time frame is bearish. Next, we go to the hourly chart.
60 minutes
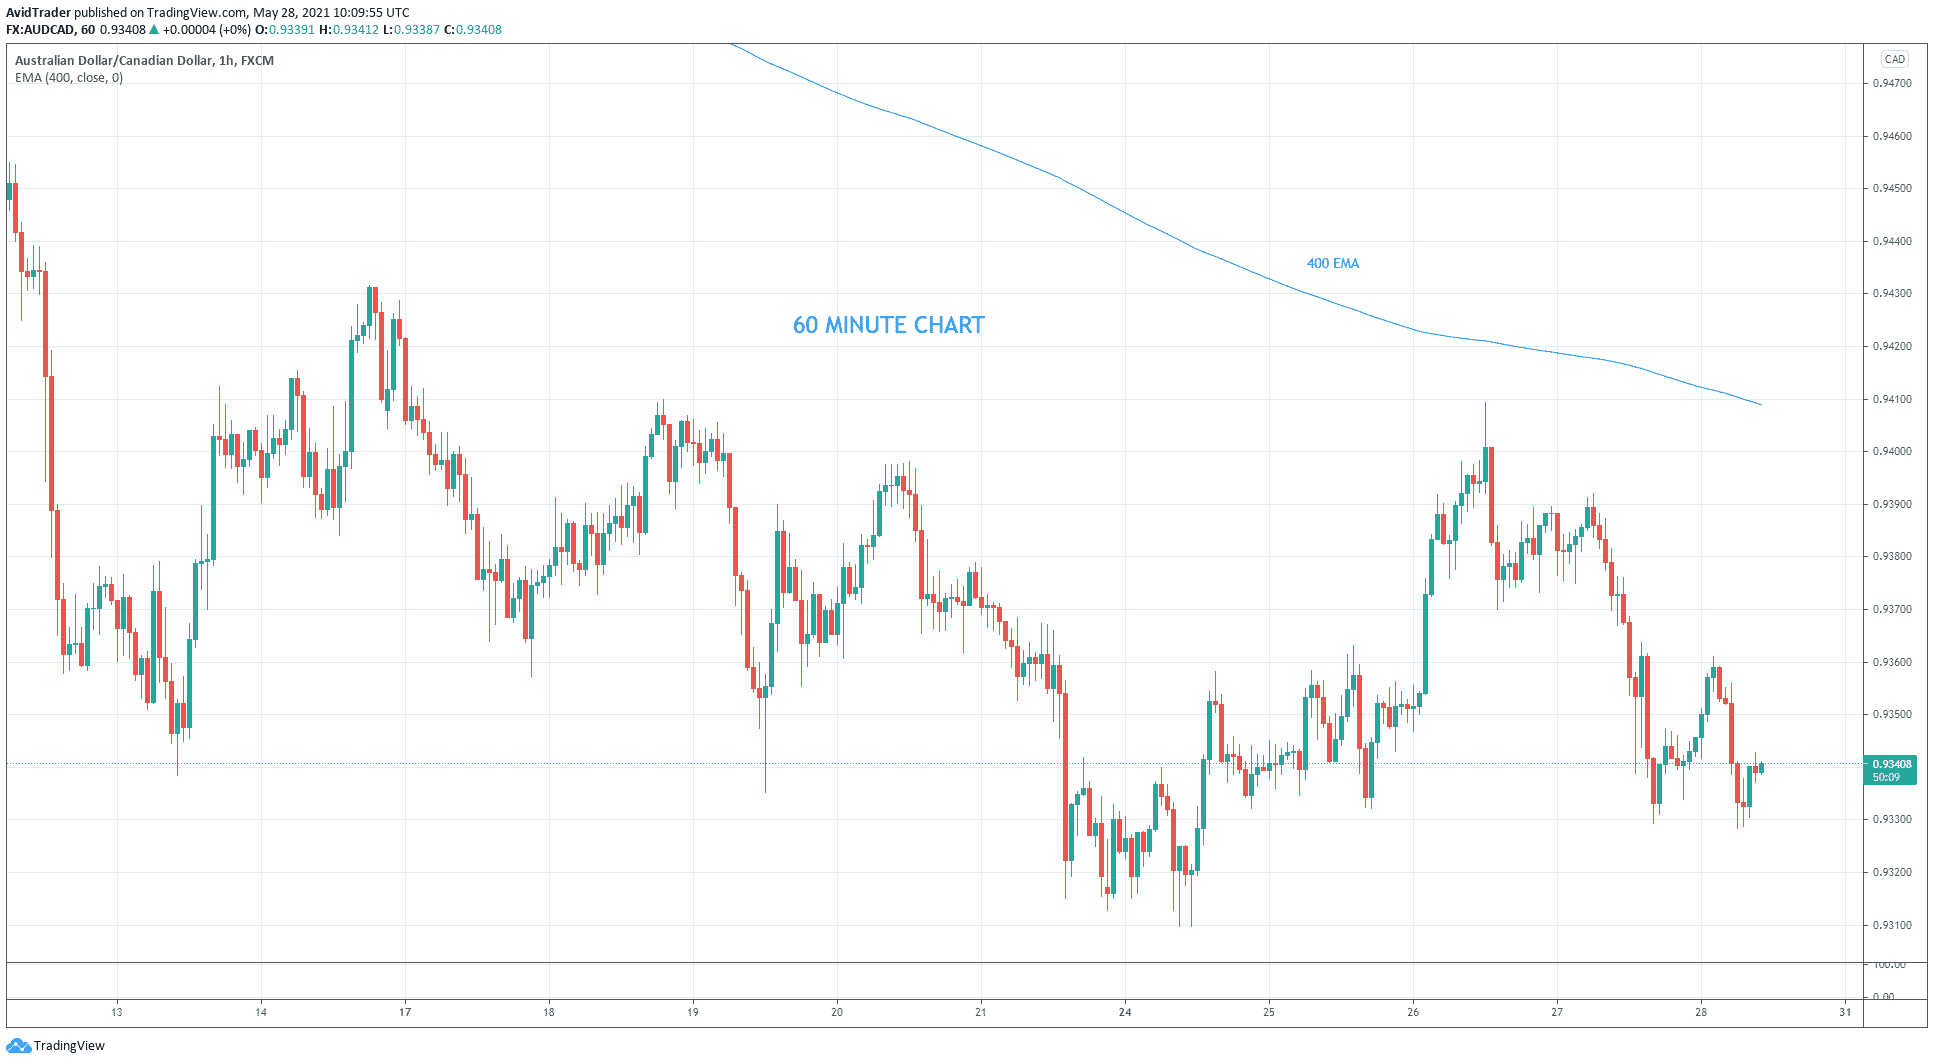
The trend in the hourly chart is also bearish because the 400 EMA is going down. Next, we confirm if the 15-minute chart is also trending down.
15 minutes
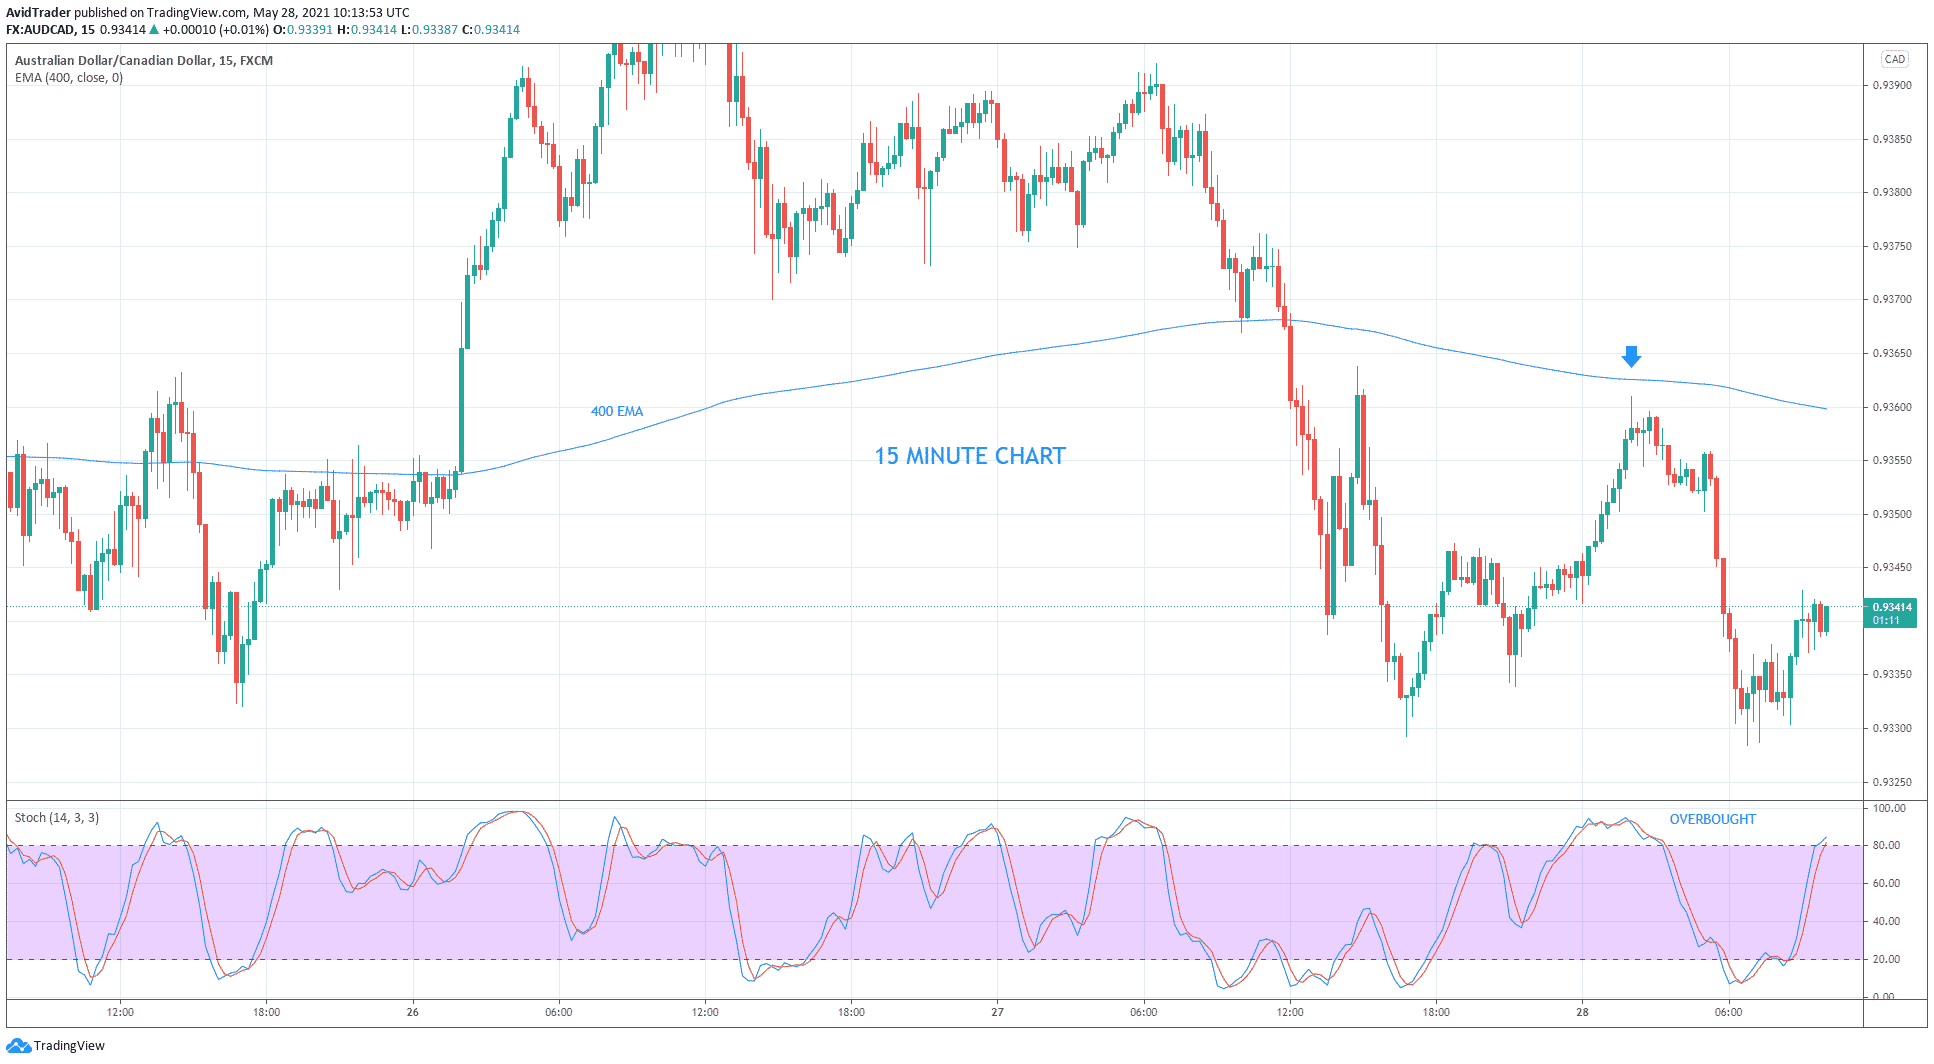
In the 15-minute chart, you can see that the price is below the 400 EMA. Therefore, the trend in this time frame is also bearish. Our sell entry comes when the stochastic becomes overbought. The down arrow marks this point on the chart.
This is how simple this strategy is, but it is very effective. Try opening one or two charts and go back in time in recent history. You would likely find multiple instances where you could have taken profitable trades using this strategy.
The strategy involves the following steps:
- Identify the trend on the 4-hour chart
- Then identify it on the hourly chart
- Finally, identify it on the 15-minute chart
- After these three steps enter a trade in line with the trend when stochastic becomes overbought or oversold
Final thoughts
A lot depends on the correctly chosen timeframe. For example, suppose a trader has little experience working with FX and options and suddenly decides a 1-minute timeframe. In that case, his trading will be more like playing roulette — “guess / wrong.”
Or another example. A trader has only $ 200 on the deposit, but at the same time, he decides to try himself in positional trading. If he opens a deal for 1-2% of the deposit amount, then it is easy to guess that even after a couple of months, the profit from such a deal will be scanty and will not even cover the cost of the internet. But short-term scalping or day-trading would benefit him much more.
You can dramatically increase the success rate of your trades by utilizing multiple time frame analyses. Too bad, several traders pay no attention to this approach once they start looking for a particular trading style.
After coming all the way down to the bottom of this article, you might have appreciated the value of multiple time frame analyses in trading. That is a good thing. Multiple time frame analysis encourages trend trading, which is still the best approach. Let your trades benefit from the edge inherent in dealing with the trend.


