The volume of stock market trade plays a significant role. The index reflects the interests of market participants and helps to predict price changes. In volatile markets, a definitive analysis of the volume structure will provide a greater level of safety.
Increasing volume is a sign that the trend is in good shape. Over time, as more research occurred in the area, on-balance volume (OBV) theory began to take shape. As per this theory, volume changes in correlation with price changes.
If you are interested in learning this strategy, check the basic details below.
What is the on-balance volume?
As explained in Charles Dow’s basic theory of volume, the volume should increase in the direction of the trend, which means that it will rise when the trend is upward. An upward volume must accompany a rising price, and the book must be upward in a downward direction.
It is a metric that measures the buying and selling pressure on a cumulative basis, subtracting volume on days when the market is down and adding volume on days when it is up.
Joe Granville created OBV, an indicator that measures positive and negative volume flow. Price trends are often confirmed by comparing them with prices and looking for divergences between price and OBV.
Top five tips for trading with OBV
Check out a few of the most widely used trading tips which rely on this indicator.
Tip 1. Setting it up in your charts
Unlike other volume indicators, it does not require special adjustments to track volume.
Why does it happen?
OBV automatically readjusts their values based on their automated calculations. Therefore, the settings are pre-defined.
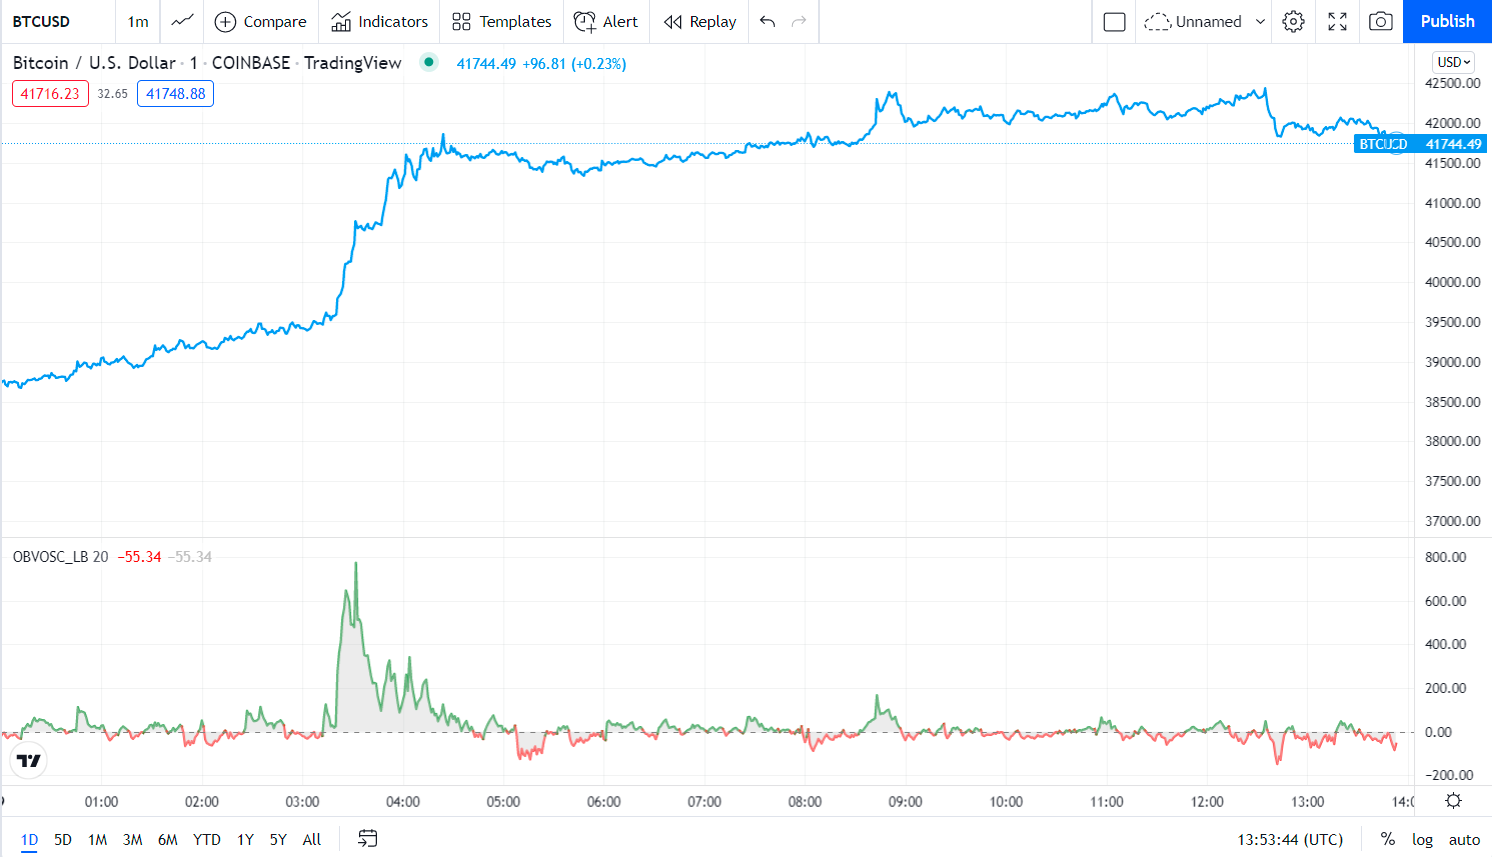
However, if you prefer, you can always change the line’s color or thickness to make the user experience smoother. For example, to avoid being confused, you might want to change the line’s color if it is green by default and you prefer candlestick charts.
It is also possible to alter the position in which the OBV box appears on your chart so that your trading workspace can be better managed.
How to avoid the mistake?
Suppose you decide to use the indicator on your chart. In that case, you should avoid analyzing it on a chart with a short time frame (under 4-hour) because they have high volatility and can cause unnecessary noise.
Tip 2. Identify breakouts
Although it is not recommendable, some prefer trading with just the indicator and the price trend. The idea works efficiently if you are looking for breakouts.
Why does it happen?
Traders identify powerful support and resistance levels to accomplish this goal. These are often helpful in confirming an escape even before the price changes. Traders’ behavior is reflected in volume before the price begins to remember it because volume represents buying/selling pressure.
How to avoid the mistake?
The following chart illustrates how the strategy looks. This picture shows that the price fails the channels before it does. Soon after, the price begins a clear upward trend.
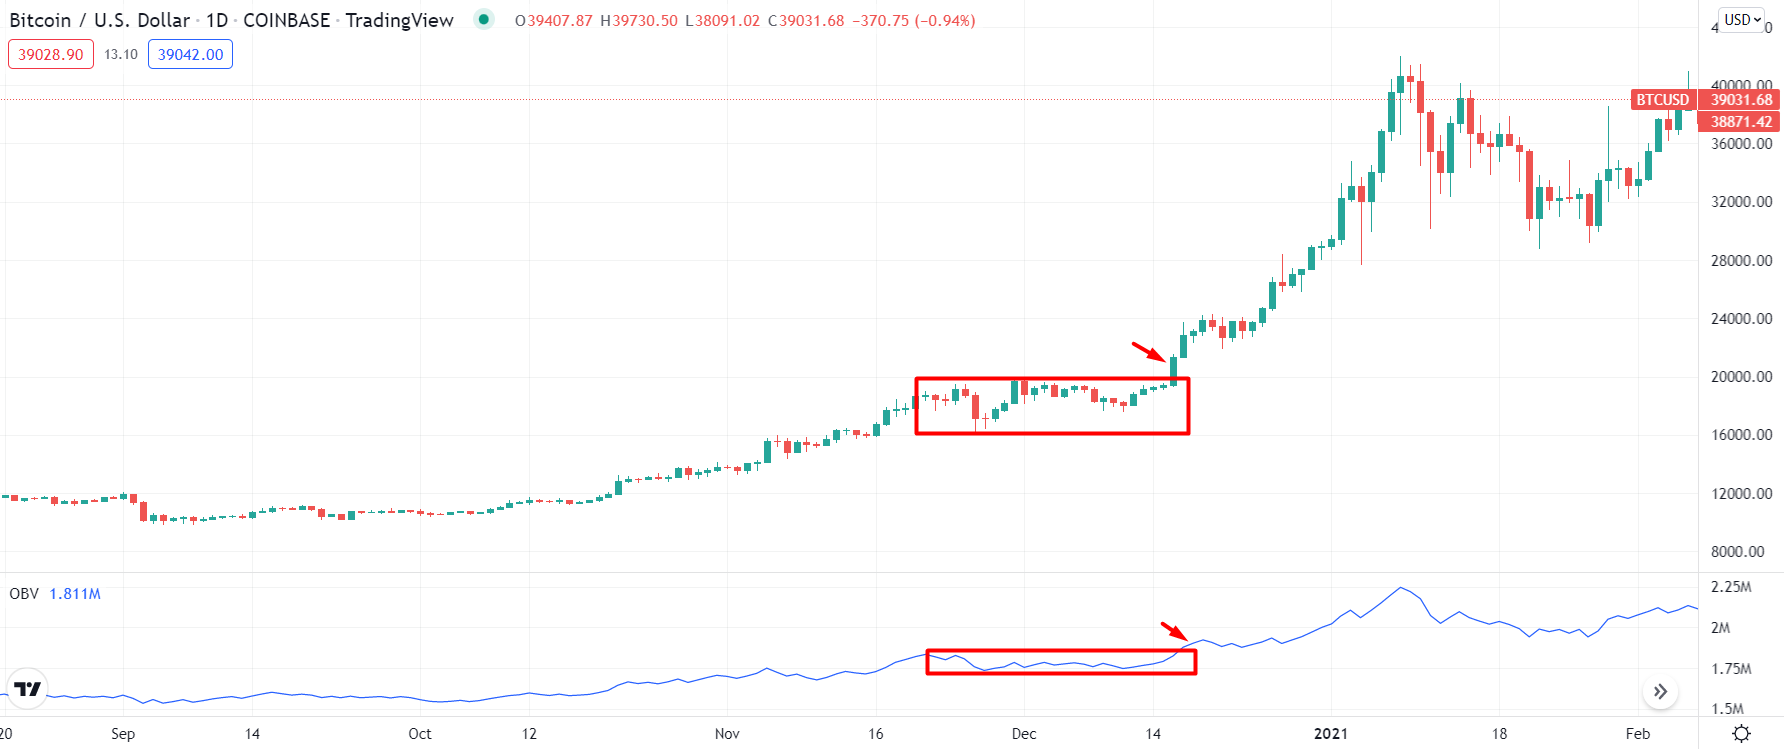
A volume is also a valuable tool in identifying false escapes. False escapes occur when the book drops or even increases slightly once a flight has occurred. An absence of interest indicates an increased probability of a false breakout and should serve as a warning sign. Even when the price ranges too long for an asset class and traders are at risk of losing focus, this strategy works.
Tip 3. OBV divergence
It can help traders predict whether the price will reverse or continue on its current course.
Why does it happen?
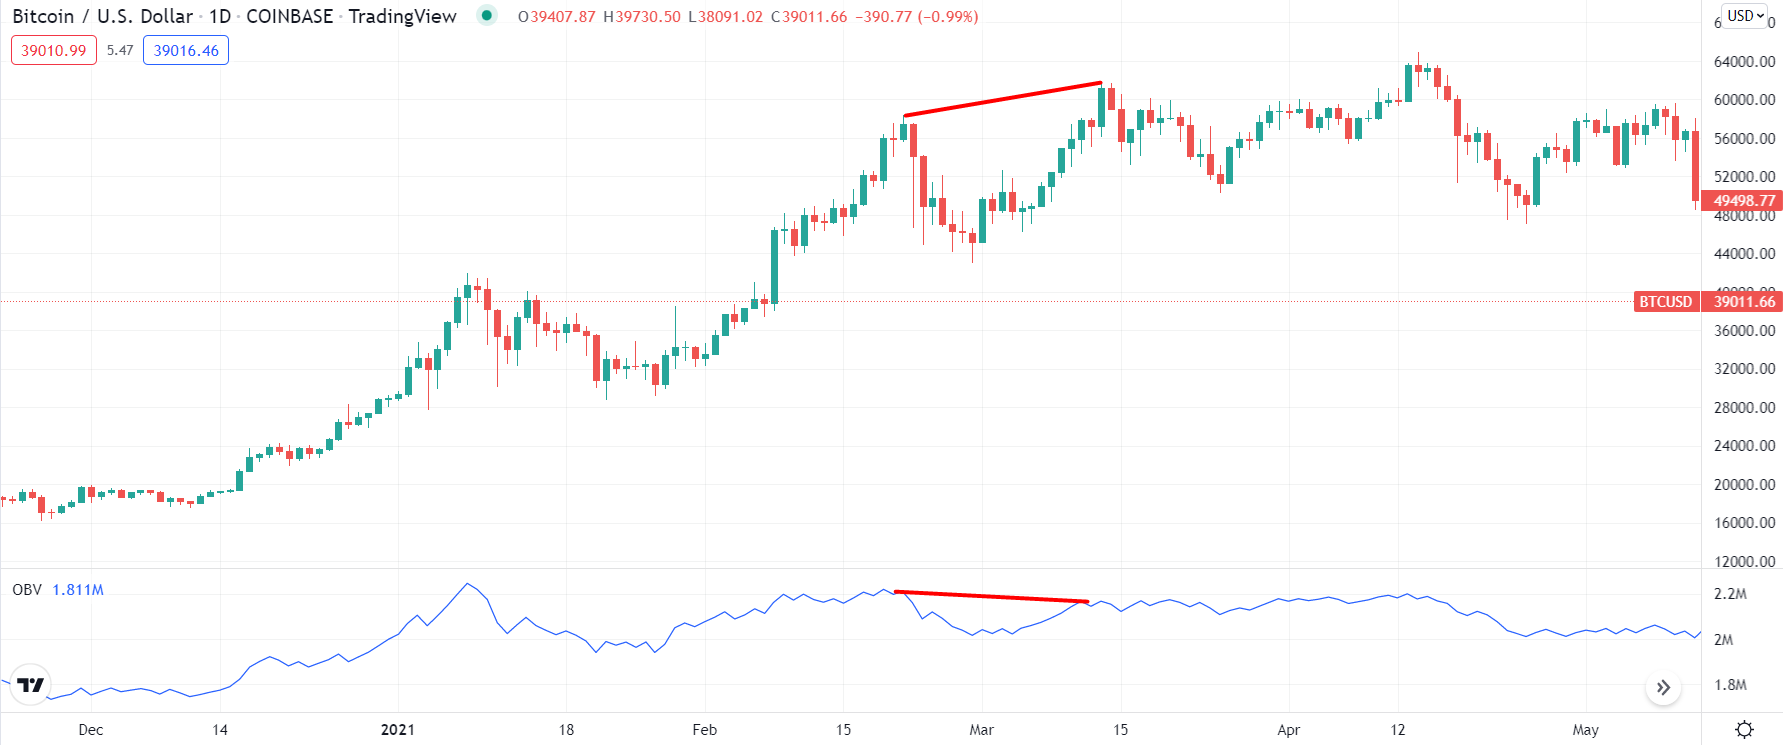
If there is divergence in an uptrend, the price marks a higher high while the OBV indicates a lower high.
How to avoid the mistake?
Consequently, we have a downtrend divergence when the price marks a lower low, but the OBV shows a higher low.
At first glance, you might think there is an upward trend in the price of Apple shares since we are at a higher high.
However, the OBV indicator reveals that volume flow has turned to the downside, and OBV has shown a lower high, which means bulls have lost their power, and selling pressure will continue to increase as we go forward.
Tip 4. Non-confirmation of uptrend
Here the price will make a new higher top, but OBV will fail to create a new higher top. This is the first sign of trouble in an uptrend.
Why does it happen?
- It shows that although the price is rising and making a higher top, volume fails to maintain that.
- It indicates that the increase in volume does not support the price rise.
- This is called a non-confirmation, and such type of non-confirmation can occur at the end of an uptrend.
How to avoid the mistake?
In this case, the price will reach a new high, but the balance volume will not do so. Again, this is a sign that an uptrend might be approaching trouble.
Even though the price continues to rise and a higher top approaches, the volume fails to keep pace. This indicates that an increase in volume does not accompany the price increase.
A non-confirmation of this type occurs at the end of an uptrend and can happen anytime.
Tip 5. Non-confirmation of the downtrend
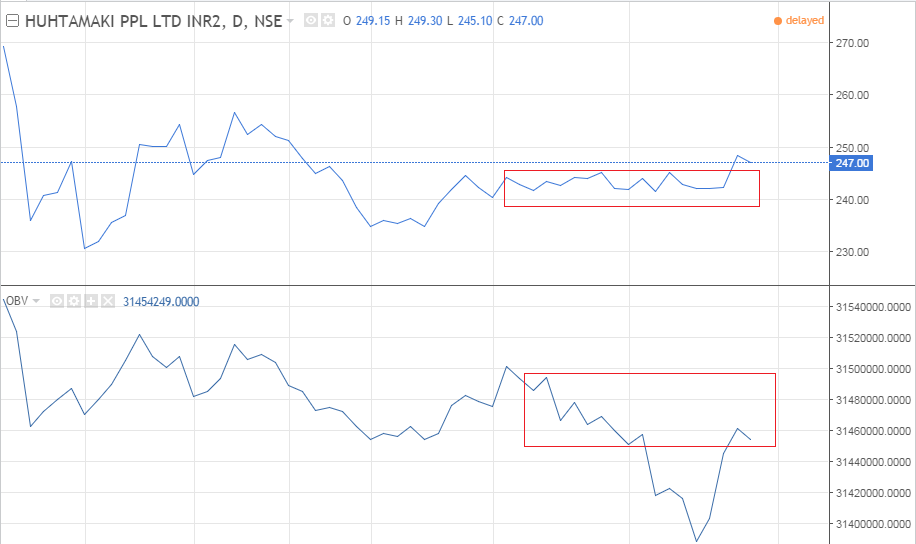
During a downtrend, price and volume tend to go down in the same fashion, i.e., lower top and lower bottom.
Why does it happen?
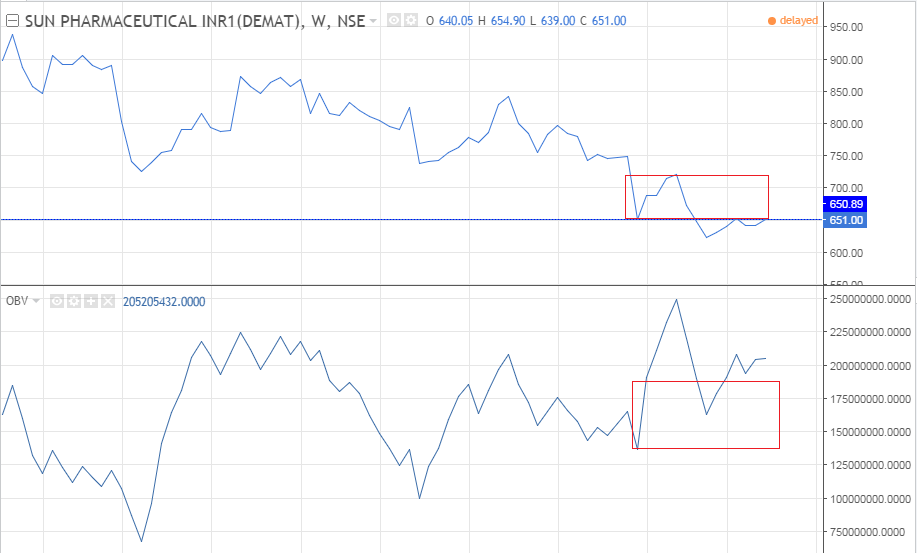
At times we will find that volume and price are not moving in tandem, i.e., the price has broken the last bottom, but the book could not die.
It shows that price has broken with the lesser volume.
How to avoid the mistake?
This is the point of trouble for the downtrend because the volume is no more supporting the price fall. This is called non-confirmation. This type of confirmation occurs at the end of a bear market.
Final thoughts
The OBV is a simple accumulation-distribution tool that tallies up and down the volume, creating a smooth indicator line to predict when major market moves might occur based on changes in relative trading volume.
OBV works best when testing significant highs and lows to measure possible breakouts and breakdowns.
Investors can use OBV to provide key predictions, such as a bullish divergence predicting the price will spoil resistance or a bearish divergence indicating a rally will stall or reverse.


