Candlestick trading is a process to read the price chart of a currency pair just by looking at candles. It is a straightforward method any trader from any level can use. It is a type of description that shows the price movement in charts.
The same chart appears from the individuals to the big boys of the FX. The line and bar charts are also popular after candlestick charts. Moreover, it shows price movement for forex, security, bond, stock, etc.
Let’s discuss what an OHCL is, how to read the price charts using it, and the top three candles that professionals and institutions observe and obey.
What is a candlestick (OHCL)?
It is simply a way to describe the price shifting of a specific period. This system of the financial chart shows the price movement of:
- Security
- Currency
- Derivatives
It is popular among other types for having a unique way to show the price movement. Each candle nearly shows every possible data about price movement for a particular period, such as:
- Open
- High-low
- Closing
It was introduced in Japan more than 100 years ago before bar charts and the west developed point-and-figure diagrams. Then, a Japanese man named M. Homma discovered a close connection between rice supply-demand and price movement.
This man developed a system through which he could track price fluctuations in the market and make correct predictions about when to buy and sell. Naturally, for him, these forecasts were vital since he was engaged in purchasing real goods.No delivery contracts did not exist at that time.
The essence of M. Homma’s method was not so much in the “dry” candlestick analysis but also in the fact that it considered the factors that may impact other market players. Thus, he was trying to delve into the psychology of the market. In part, he succeeded, and those who master candlestick analysis can also, to a certain extent, understand the psychology of trading.
There are two types of candles:
- Bullish, which is green or white
It forms when the closing price is greater than the opening price. It means that price increases.
- Bearish, which is red or black
When the closing price is lower than the opening price, this candle shows up. It means that the price decreases.
You can customize the color of candles in any marking you want on your chart.
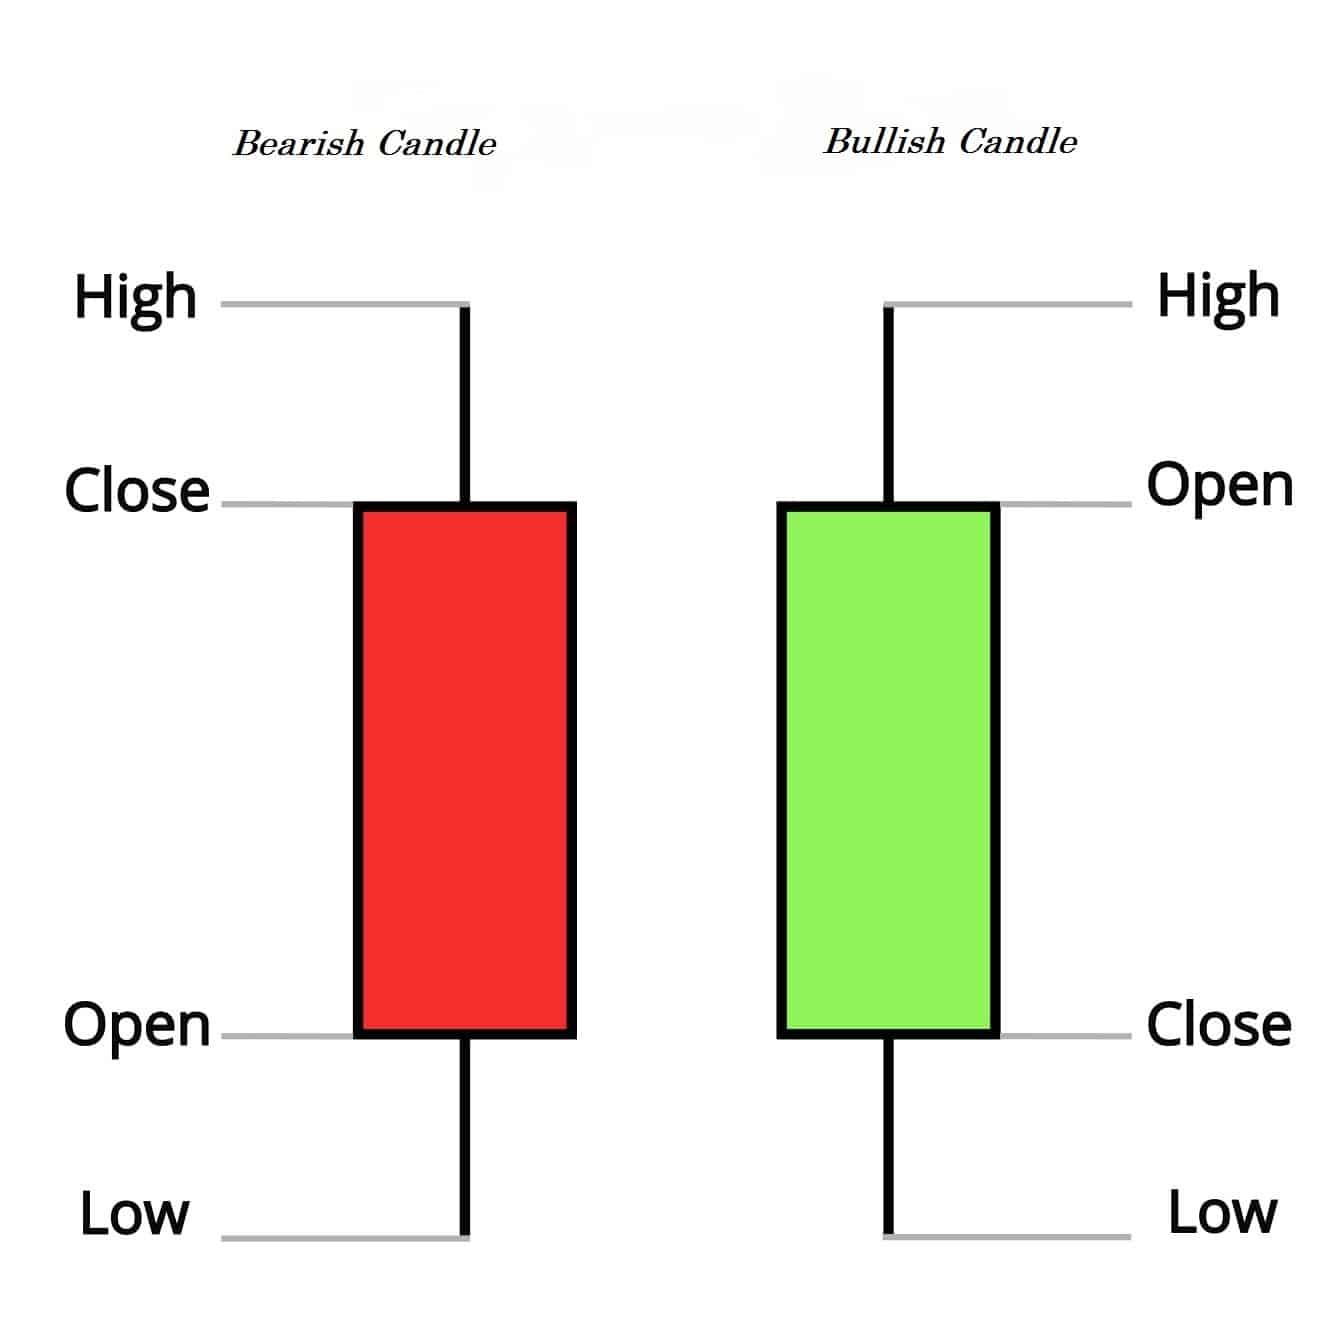
These are the elements of candles, which have a solid part or ‘real body’ representing the price movement of that period.
On the other hand, in a bullish candle, the price closes higher than the opening. It is just the opposite of a bearish one. There are also some wick or shadow parts on the candles, which indicates the trading activity during that session.
How to read the chart?
The candlestick shows valuable information about price movement, so it is famous for FX participants to do technical analysis. You can quickly get the picture of price movement or read the chart with a candlestick.
As we mentioned above, candles have different colors. For instance, bullish may be green, and bearish may be red-colored on the same chart.
- A series of bullish means an increase in price for the asset
- A series of bearish represent prices falling for a certain period
We can get a view by checking the body and wicks of the candles.
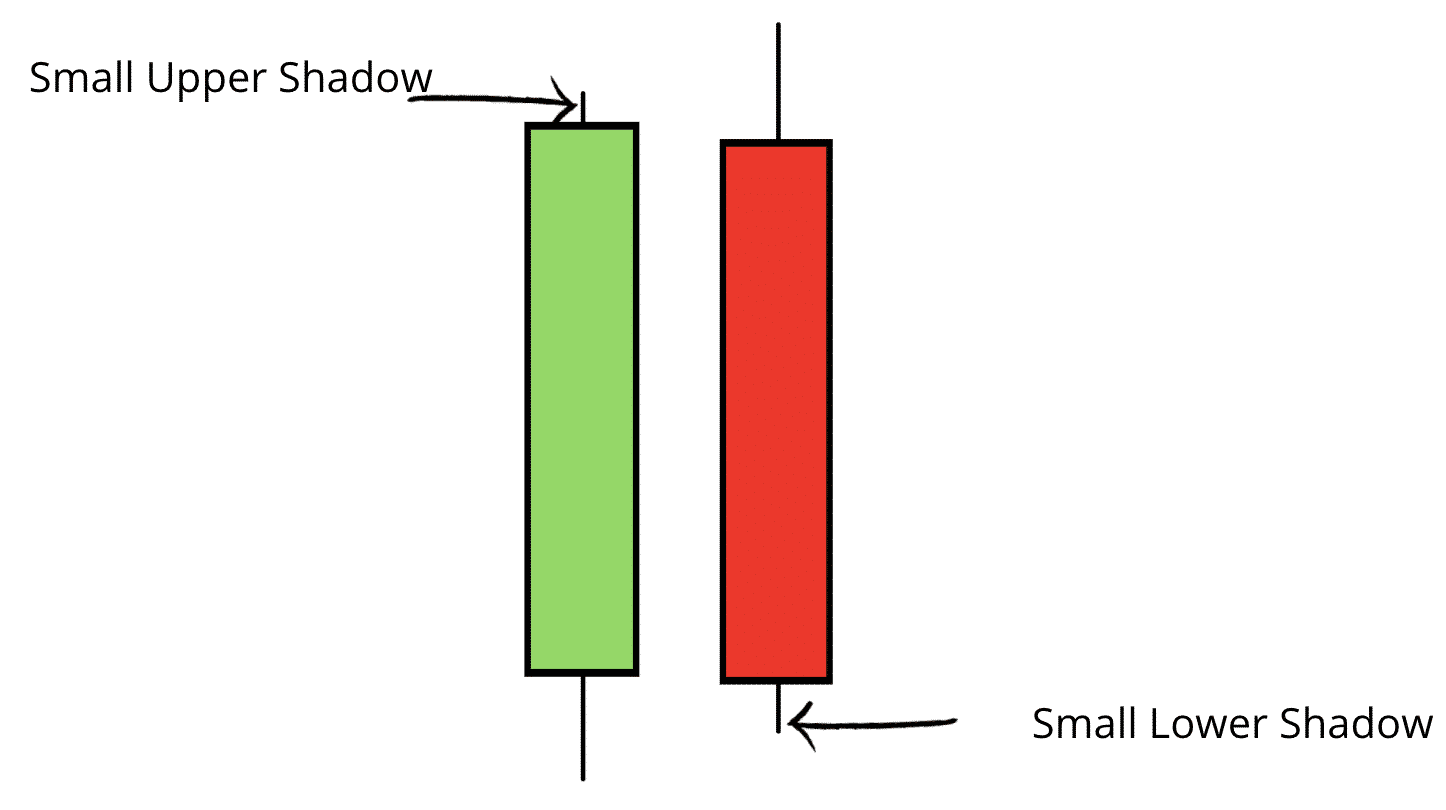
As per the above image, a green candle with a small upper shadow represents the price closed near a high, and a small wick below a red candle represents the price closed near the low of that day. Larger wicks below a small green body represent price may fall but close above the opening price and indicate buying pressure. So a tiny red body with a bigger shadow on the upside means the price may go up during the period but close below the opening price for selling pressure.
Top 3 candlesticks for forex
This part will discuss the top three types that show specific information about price movements and are popular among professionals.
№ 1. Doji
It is a very effective type of candlestick that shows market data and determines essential patterns. In this candle, the opening and closing price is almost the same for the trading asset for the specific session. The upper/lower shadows can vary. As a result, this type of candle looks like a cross, plus sign or inverted cross. It is alone is a neutral-type candle.
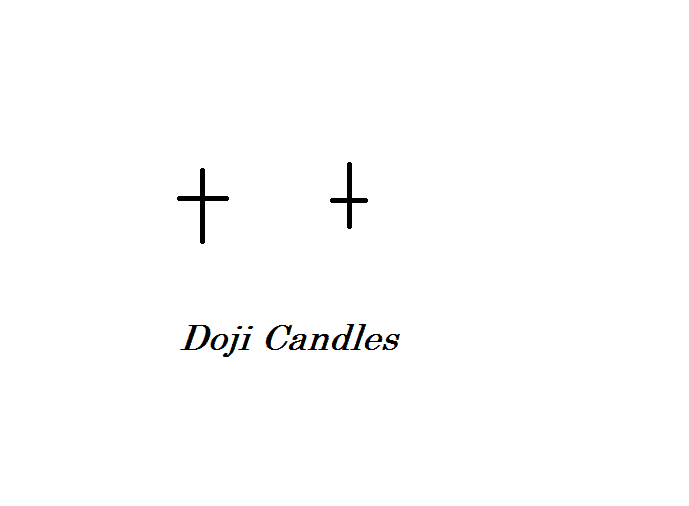
The price action traders often explain this candle as traders talking rest at this level may something new is coming. Another characteristic of this candle is that often price changes trends after making up a Doji candle.
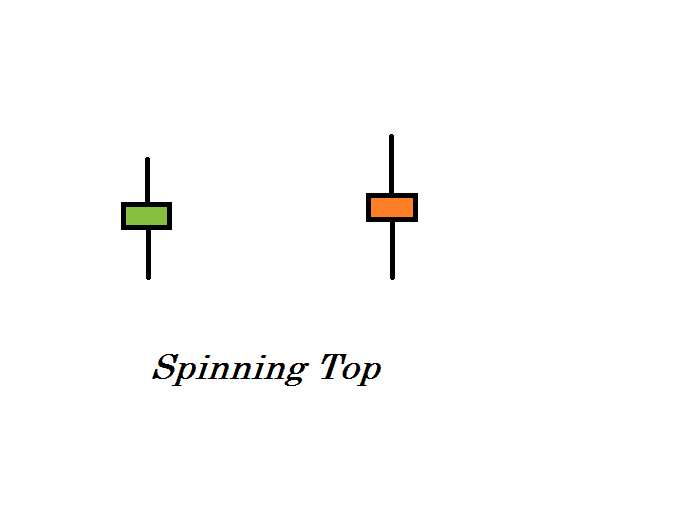
№ 2. Spinning top
Candlesticks with a tiny body, green or red, have upper and lower shadows known as spinning tops. They represent the indecision of the traders during the session. When the ‘real body’ is small, there is not much difference between the closing and the opening price for a defined period.
In the meantime, this type of candle contains upper and lower shadows. So it is clear that buyers and sellers both were active during that session.
№ 3. Long vs. short shadows
The upper & lower shadows carry information:
- The one with long shape confirms that the price extended well past that session’s opening and closing price.
- The one with small shape confirms that most trading actions occurred during opening and closing.
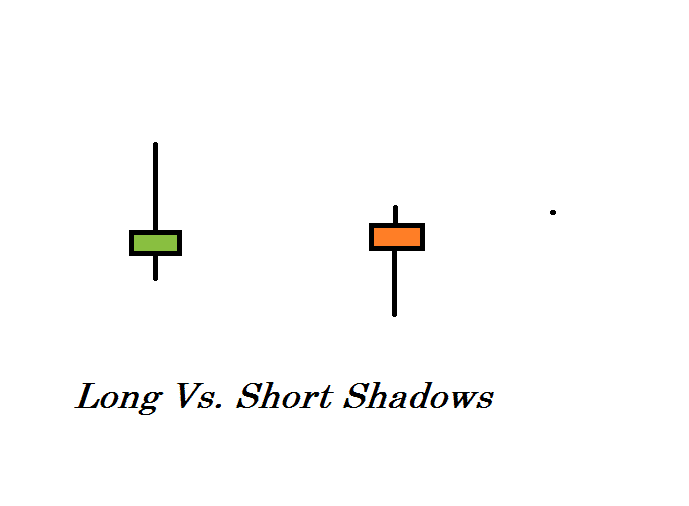
Candles with long upper shadows confirm buyer dominations during the trading session and vice versa.
Conclusion
The developed technique is unique in many ways. But first of all, it should be noted that it allows you to get more than just a picture on a chart. With its help, a trader can open the veil of the secrecy of decision-making by the market, which is, in fact, a crowd of people with different financial capabilities, but the only desire is to make money.
This method is beneficial to understand the price action for any currency pair. Some specific types of them may work just fine at certain levels, but you can’t ignore the fundamental facts that drive currency prices.
The FX price changing depends on both the technical and the fundamental facts for any currency. So we suggest not to take deals by relying on this method blindly. Instead, be aware of dealing in the FX during major macroeconomic news releases, such as interest rate decisions, central bank press releases, policy meetings, GDP, employment data, etc.
