Finding a price momentum is the primary requirement in trading as all trading strategies are profitable if it comes within the direction of a trend. You can use several indicators and tools to identify the market momentum that will help you to understand where the price is heading.
In addition, several factors affect the price movement of the currency pairs. Hopefully, there are some significant factors for momentum trading and several methods to sort out that momentum.
Let’s look at the critical factors of momentum trading and the top three ways to identify that momentum. Understanding these concepts will take you one step closer to achieving a successful career in the financial market.
Key factors for momentum trading
This part includes the key factors that involve momentum trading. You can quickly identify the price-changing tendency of certain assets by observing these factors.
Volume
Volume is the number of orders that change hands during a particular period. It is a very effective technical indicator as it represents the overall activity of traders during a specific period. You can identify the existence of trends or trend reversal, a continuation, or price direction of any asset by observing volumes.
When any asset value rises, in the meantime, the volume also increases, indicating the asset is stable and may go more upside. An increasing volume with a declining price indicates seller domination may come or the asset. Study shows you can win nearly 77% trades by using volume for your trading decisions.
Volatility
It is another critical fact to understand momentum. Volatility is the measurement of price changes during a particular period.
- When fast price changing occurs during a specific period, then the asset is volatile.
- On the other hand, price changing is slow for non-volatile assets.
For example, when central banks release monetary policy decisions, currencies and stock prices often show volatility. If the central bank lowers the interest rate, then a violent reaction can come from the investors. The stock prices can rise, and the domestic currency price may fall as a quick consequence.
Time frame
Another critical factor for momentum trading is the time frame. Traders use different time frames as suits with their trading strategy, style, and expectation. The time frame for trading is always different for different level market participants.
For example, the time frame for trading will never be the same for any institutional trader and an individual. Professionals often use three different time frames to find out the birds-eye view of price changes and have more accuracy on analysis. You get the primary trend and avoid false swings by observing more extended time frames.
Three ways to find the momentum
This part contains the top three ways or methods to sort out the momentum. Mastering these methods will help improve your trading decisions and increase your profitability.
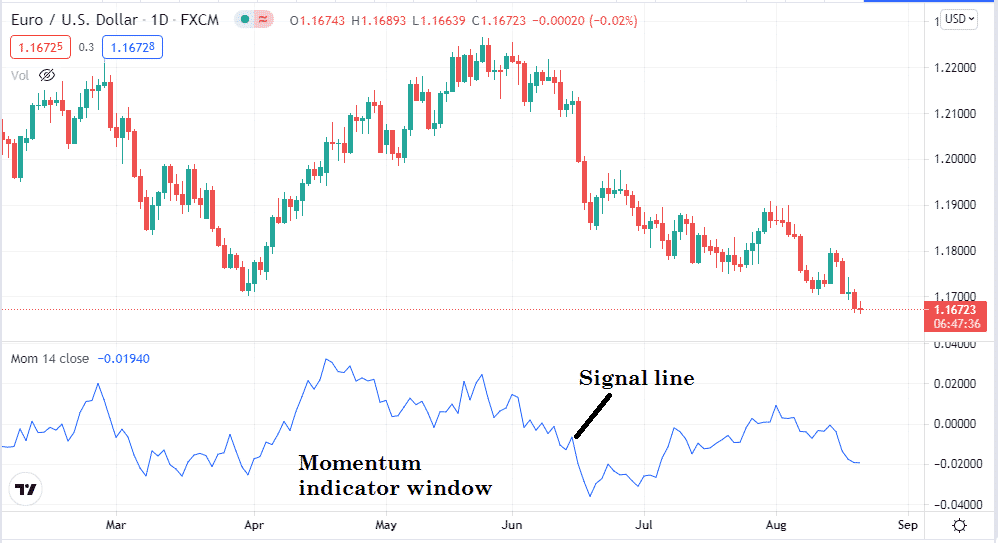
The momentum indicator
It is an oscillator indicator that shows its reading on an independent window. Financial traders use this technical indicator to identify the price trend. It is a beneficial indicator that shows reading by comparing the asset’s different times values, such as past and current. The momentum indicator contains a dynamic signal line in a range of 100.

The figure above shows the momentum indicator on a daily chart of EUR/USD where the signal line moves toward upside for the increasing asset price, and when the asset value is declining, the signal line direction would be downward. You will get better and accurate results through this indicator when you use it with other indicators or market data. Additionally, we suggest doing a multi-timeframe analysis for better results.
The relative strength index (RSI)
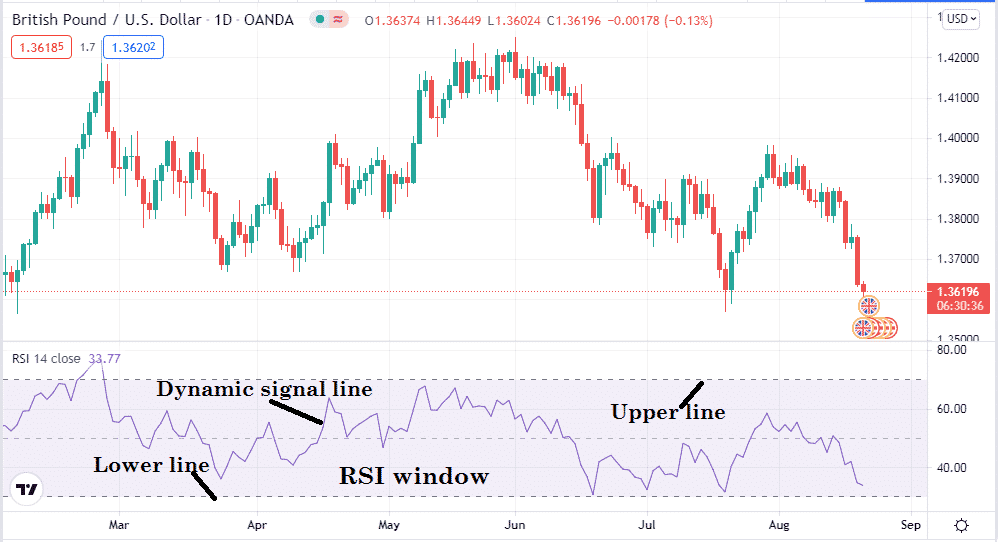
The RSI is a prevalent technical indicator among financial traders to analyze momentum for financial assets such as commodities, currencies, stocks, etc. It shows reading in an independent window that includes a dynamic signal line, upper and lower lines.
In a range between 1-100, the upper line is at 70, and the lower line is at 30. These two lines show the overbought and oversold condition of the asset price.

When the signal line touches, crosses, or remains above the upper line, that indicates an overbought condition for the asset. Meanwhile, for a declining asset price, the signal line moves toward the lower line.
If the signal line touches, crosses, or remains below the lower line, that indicates an oversold condition for the asset. Traders generally seek to enter the market when the price reaches the overbought or oversold zone, expecting a reversal trend.
Moving averages
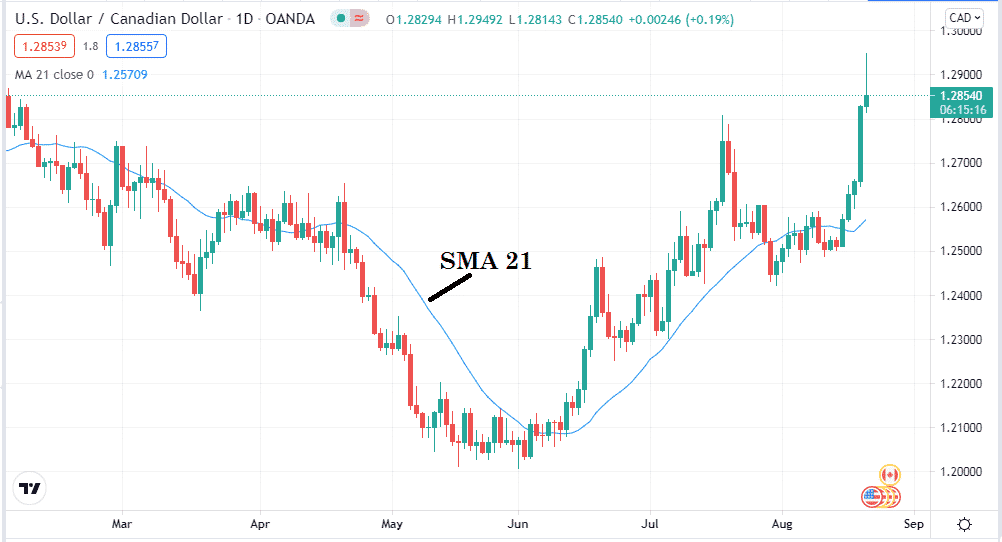
It is another most common technical indicator that financial use identifies the price direction. This indicator draws a signal line on the price chart by adding up various values of the price candles for a particular period. There are four types of moving averages:
- Simple
- Exponential
- Smooth
- Linear weighted

When the price candles cross above the moving average line, it indicates buyer domination at the asset price. The price candles remain above the MA signal line as long as bullish pressure remains intact or increasing bullish pressure.
On the other hand, when asset prices decline, price candles cross below the MA line and remain that way as long as the downturn continues. The MA indicator’s general concept is to add up values of a specific period and then divide it by that number.
Final thought
Finally, If you want to become a successful trader, you must understand the asset’s momentum. Any forex trader who understands the momentum and the direction of the price movement can be a legitimate trader. It will help if you do more practice and research to master these concepts. When you master these concepts, it is just a matter of time to become a professional in the financial market.


