As a technical trader, you cannot avoid using one or more technical indicators even if you trade pure price action. Many price action traders use at least a moving average (MA), a technical indicator.
Of course, it is good practice not to put too many indicators on your chart. Otherwise, you will lose sight of the trend and the price oscillations within the trend. One or two indicators are often enough for practical trading purposes.
In this article, you will learn about the detrended price oscillator (DPO). Not many traders know about this indicator. However, it is a powerful indicator that can give you multiple signals you can trade. Read on to understand how to use the DPO in your trading.
What is the detrended price oscillator?
The qualifier “detrended” from the name of this oscillator comes from the word “detrend,” which means removing the trend. Thus, the indicator attempts to remove the trend from consideration.
While it looks like a traditional oscillator usually displayed below the main chart window, the DPO belongs to a separate group of technical indicators known as cycle indicators. It is not a momentum indicator as opposed to MACD, RSI, stochastic, and others. The DPO allows you to easily see the cycles (i.e., top to bottom or bottom to top) and measure the length of such cycles.
DPO calculation
You can get the value of the DPO by getting the price of an instrument (x/2 + 1) periods ago and then subtracting the value of the SMA x periods ago. Most platforms set the default period of the DPO to 21. With this period, the platform will get the asset price 11 periods ago and then subtract the value of the SMA from 21 periods ago.
In the following chart examples, we will use 16 periods instead of 21 for the DPO settings. When plotted on the chart, the DPO displays a line that fluctuates up and down between the zero line. The usual range of the DPO is +0.05 and -0.05. However, when the market is volatile, you can expect higher extreme values.
DPO signals you can trade
Although the DPO is not popular, it is one of the most popular tools you can use in trading. If applied correctly, you can get accurate trade signals whatever time frame and symbol you are using it with. You can use the DPO in three main ways, namely:
- Reversal – when the oscillator reaches a relatively high level (overbought) or relatively low level (oversold), you can trade in the opposite direction.
- Divergence – the DPO is a terrific classic divergence tool.
- Crossover – the DPO signals an entry every time it crosses above or below the zero line.
We will explain these three trade signals in more depth shortly with chart examples to clearly illustrate the concepts.
1. Reversal
Similar to MACD, the DPO has no defined upper and lower boundaries. This contrasts with other popular oscillators such as RSI, stochastic, CCI, TDI, and others. While the DPO has no limits, you can expect the value to fluctuate within the range of 0.05 and -0.05. Apply the DPO to your chart and go back in time to see this for yourself.
When the DPO approaches these limits, you can say the price is either overbought or oversold, and you can expect a reversal soon. In most cases, price reverses before it reaches the limits. On some occasions, the price goes beyond the limits before reversing.

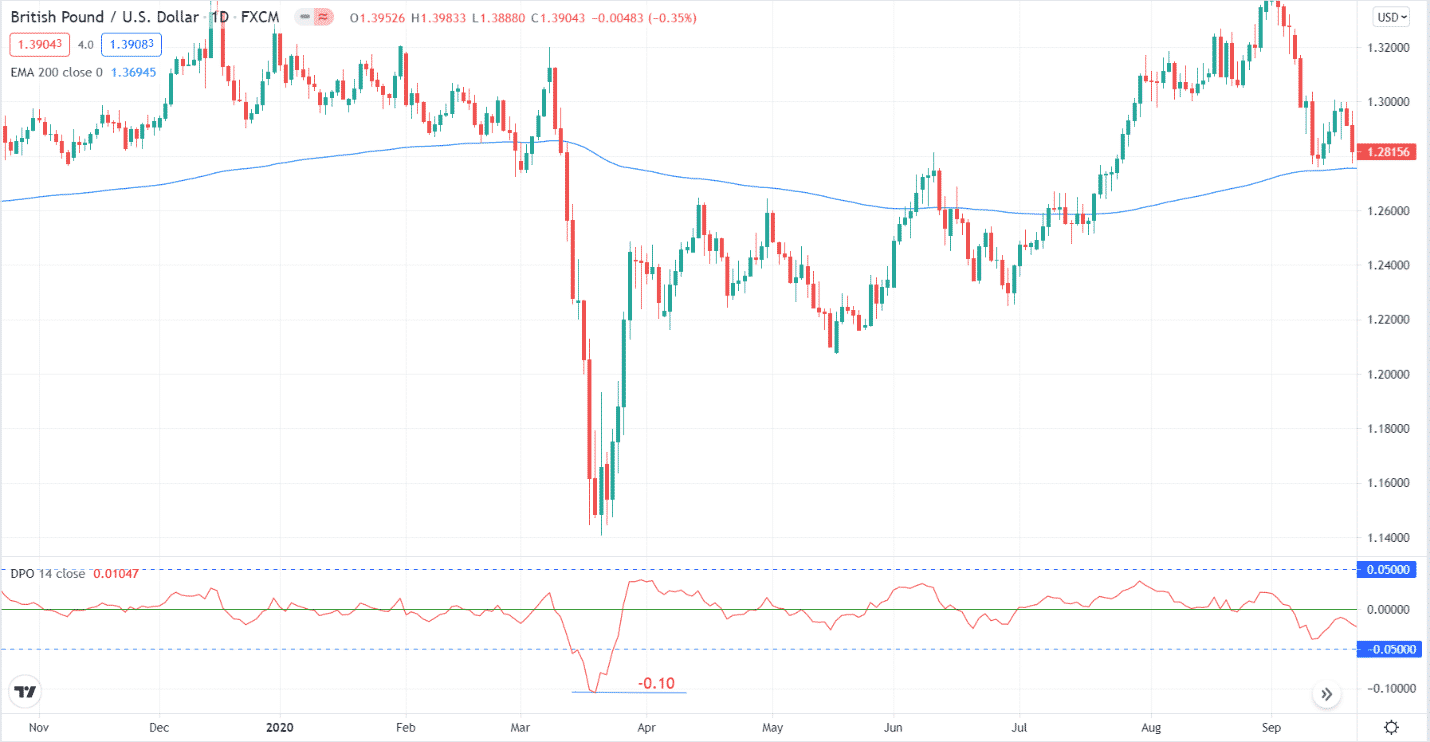
The daily GBP/USD chart above shows a situation that rarely occurs in many markets. When the DPO registers such an extreme value, you can see that price moves too fast and very strongly in one direction, which might be caused by a high-impact news event, political, or environmental issue.
As a result, the DPO goes beyond the lower limit and even reaches -0.10, which is an extremely low level. The price is heavily oversold at that point. That is why the price immediately reversed to the upside shortly after.
2. Divergence
If you like to trade divergence, you will find plenty of trading opportunities with the DPO. As an effective divergence signal provider, the DPO should list the best divergence indicators, such as MACD, relative strength index (RSI), stochastic, and traders dynamic index.
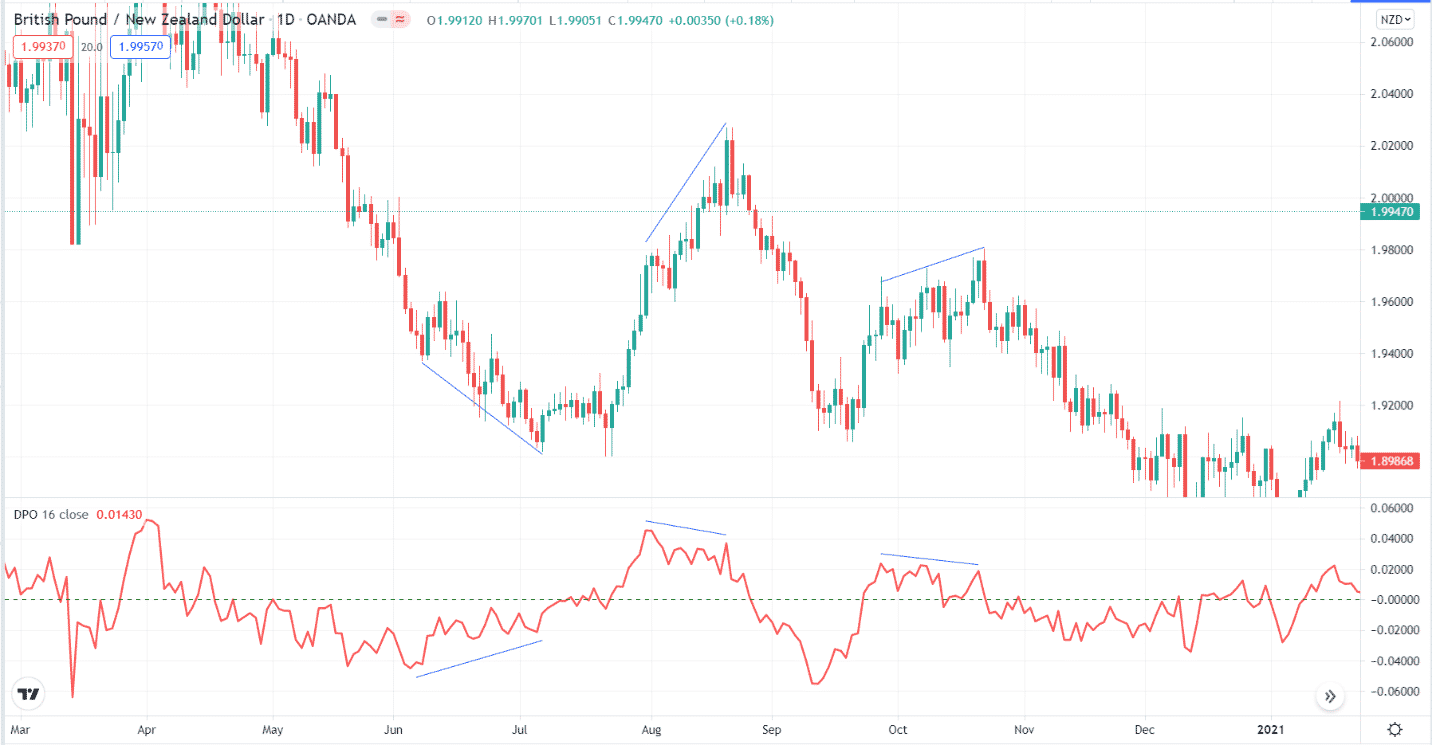
Take a look at the daily GBP/NZD chart below. Here you can see three divergence signals given by the DPO in quick succession. After divergence was printed, the price immediately reversed as a result. This is just one symbol. You can find several examples from other symbols on your platform.

3. Zero crossover
Similar to the RSI, the DPO will generate a trade signal every time the line crosses the zero line. The main differences are that RSI is a momentum indicator and uses the 50 level as a balanced line. On the other hand, the DPO is a cycle indicator and uses the zero level as a balanced line.
In theory, every time the DPO crosses above the zero line from below, that is a buy signal. Every time it crosses below the zero line from above, that is a sell signal. However, trading in this manner is not practical and may lead to losses. If you do this, you will be trading much too frequently, depending on the time frame you select as a watch chart.
Be selective when considering trading DPO signals. The best way to trade the zero crossover is in this manner:
- Identify the major trend. The 200 EMA is ideal for this purpose.
- Wait for the price to make a pullback and approach or touch the 200 EMA.
- Wait for the DPO to cross the zero line in the trend direction.
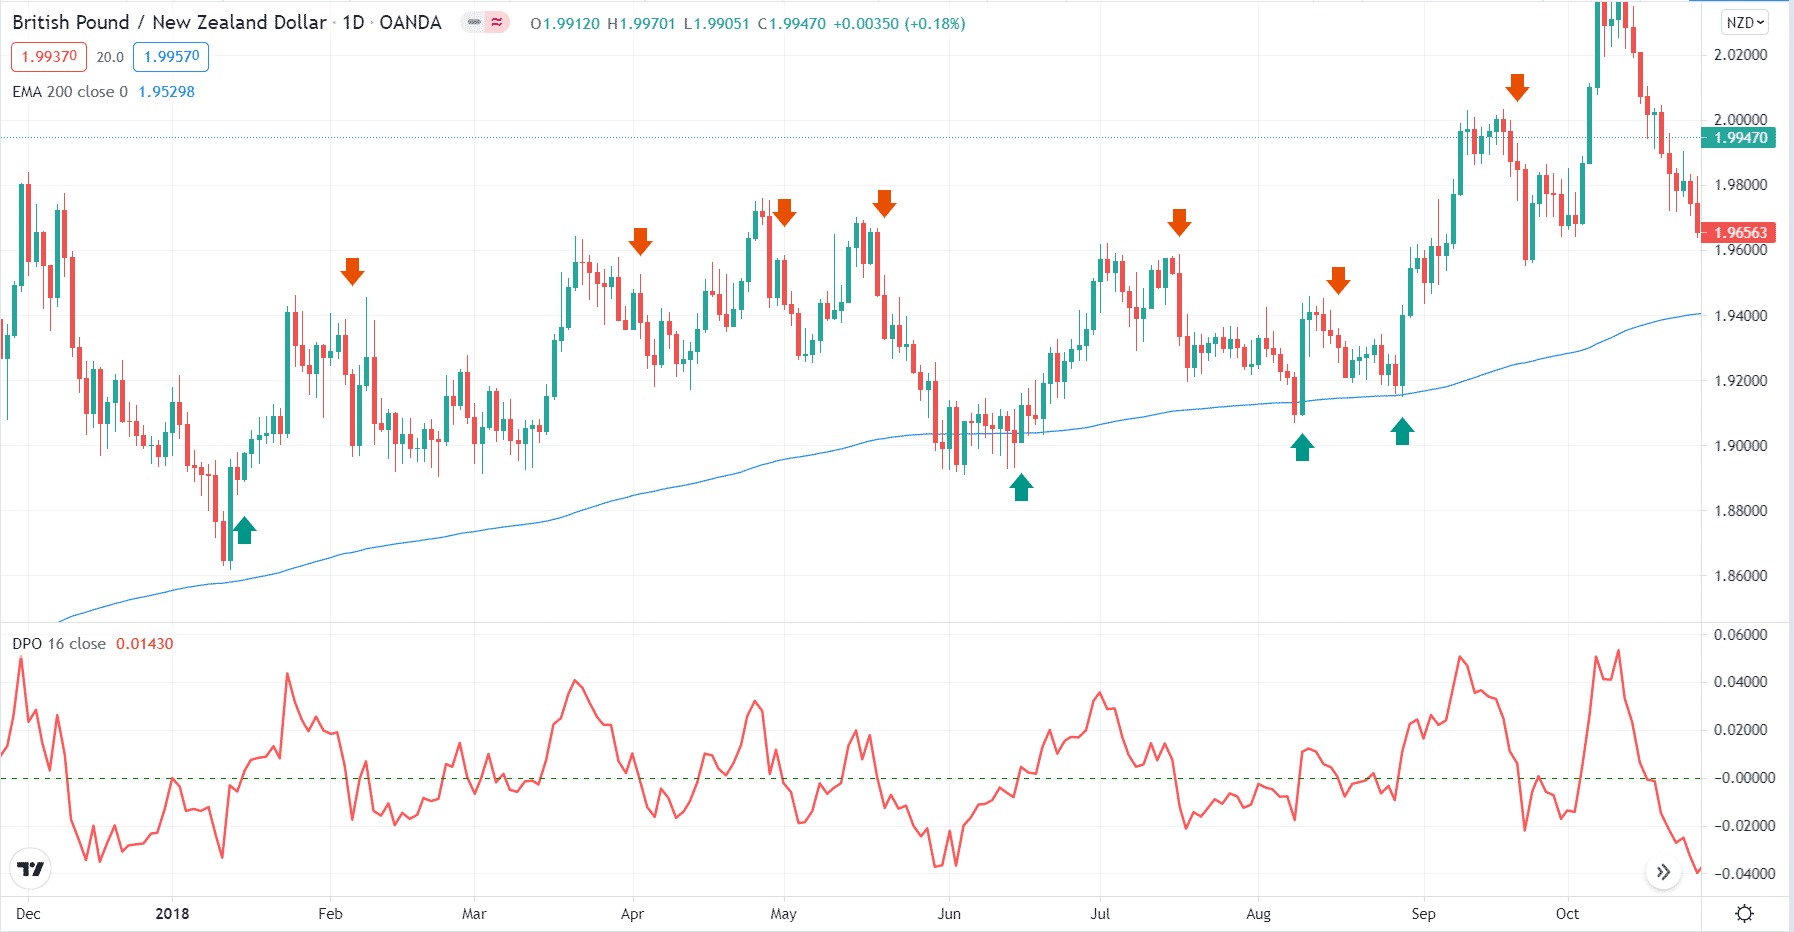
The following daily GBP/NZD chart will help explain the above entry rules. The red down arrows mark the occasions when the DPO crossed below the zero line. You will not take these signals as they do not conform to the above entry requirements.

The only times you should execute trades are those moments marked by the up green arrows. You know that the overall trend in the daily chart is bullish because the price is generally above the 200 EMA. Next, you wait for the price to pull back toward the 200 EMA.
During the pullback, the DPO may go below zero. Just wait until the price crosses above zero again, which marks the end of the pullback phase and the start of the continuation phase.
Final thoughts
As presented in this article, the DPO is indeed a powerful indicator that provides multiple signals. It might be time for this indicator to become a mainstream technical tool and join the ranks of RSI, MACD, stochastic, TDI, and other popular indicators.
Try this indicator in the demo and see if it makes a difference.


