There is an old textbook that talks about the FX market as “history repeats itself.” While price changes, it leaves footprints and creates patterns during the price movement. There are some common patterns you can often see in the FX market.
Identifying them will enable having insight into future price prediction, which increases profitability. Triangle patterns often appear at the forex assets charts, and anyone can make frequent trading positions by using them.
However, the formation and interpretation are not identical for all triangles, so it’s necessary to learn each pattern because you don’t know which one will appear in the real chart. This article will explain forming these patterns with a complete trading guide using several triangle setups.
What is the triangle pattern?
You can find triangles as a correction within a trend. It is effortless to spot in a naked chart, but you can draw the exact formation by adding a trend line from lower and higher swing levels. Moreover, it indicates ap price behavior where investors profit after a solid bullish/bearish trend. It comes within a trend and shows a possibility of breakout and finding a profitable trend.
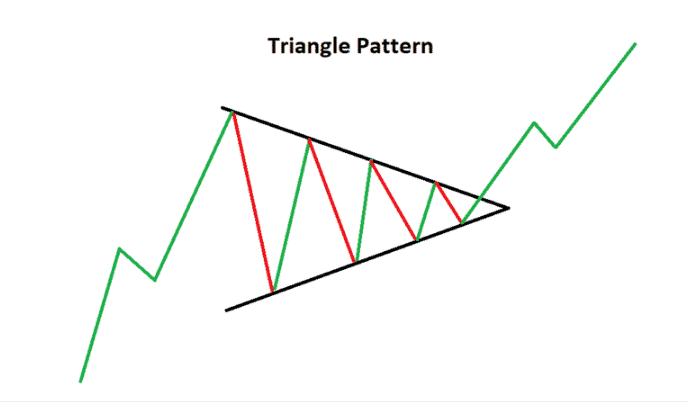
Traders seek for breakouts to occur to find out entry-exit positions through triangles. The candlestick charts show more accurate triangle formations, while it’s complicated to identify at the line charts or bar charts.
Symmetrical triangles
This pattern shows that the price is making lower lows, indicating a profit taken by bulls after a strong bullish trend. On the other hand, the higher low on the downside represents that bulls are not entirely out of the market. Instead, they are pushing the price to make another bullish movement.
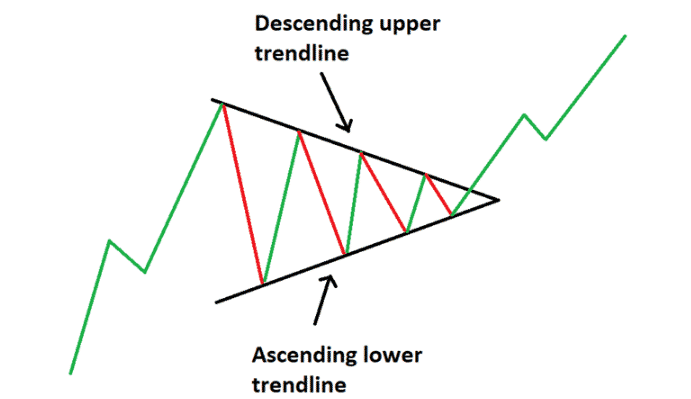
In forex trading, a retail trader’s primary objective is to find what big players are doing. Among other patterns, it has a higher possibility to provide a good result. The reason is that it can explain both bull’s and bears’ activity in the price. In this manner, it has the most accurate explanation of the price action.
Ascending triangles
They have an upward horizontal line but a moving trendline in the following section. This pattern occurs when buyers are more aggressive than sellers.
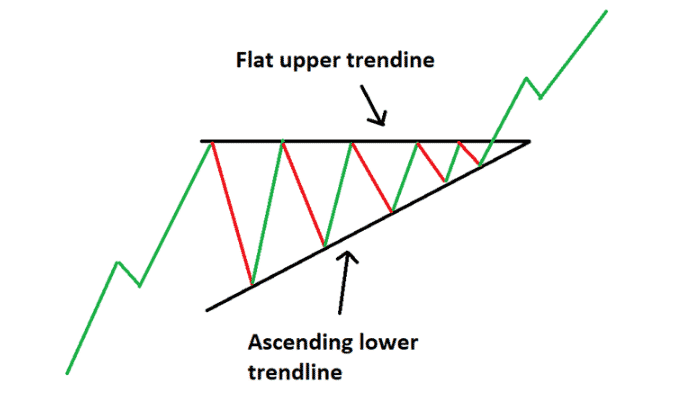
These triangles are often seen in an upward trend. Since this is a correction sign, investors should wait for the correction to end and a breakout to occur. After the breakout, the price will continue trending until it finds a solid reason to reverse.
Descending triangles
In this pattern, bears remain strong even if they are taking profits. As a result, the price does not get any higher in the absence of buying pressure. In the meantime, sellers keep pushing the price by testing the same horizontal level again and again.
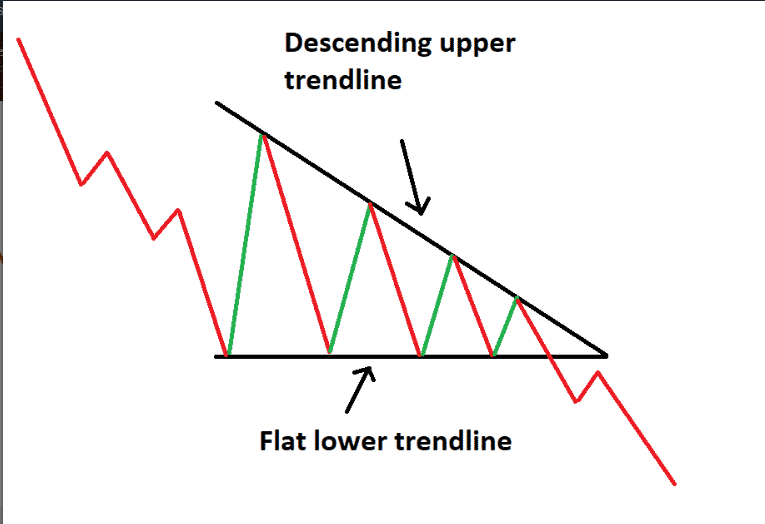
As the seller has a higher dominance over the price, a new low below the horizontal area confirms the breakout, and the trading entry becomes valid after a bearish candle.
How to trade with the triangle pattern trading strategy?
It involves some rules as below:
- Follow these patterns within a trend only.
- Use trendlines to draw triangle patterns.
- To determine the profit target level, measure the triangle carefully.
- Be aware of the false breakouts.
- Follow good risk management rules and use tight stop loss when placing any order.
Now we describe bullish and bearish triangle pattern strategy with figures. Checking on these strategies will enable you to find this pattern and make frequent profitable trading positions. These strategies work fine in any time frame chart.
We recommend using charts from hourly to higher time frames to get profitable entry positions. Practicing these strategies in upper time frame charts will help you avoid false breakouts and temporary swing positions.
Bullish trade setup
Identify the trend to confirm the current trend is bullish. Seek for a triangle pattern at the bullish movement. You will find it after a bullish move when consolidation occurs.
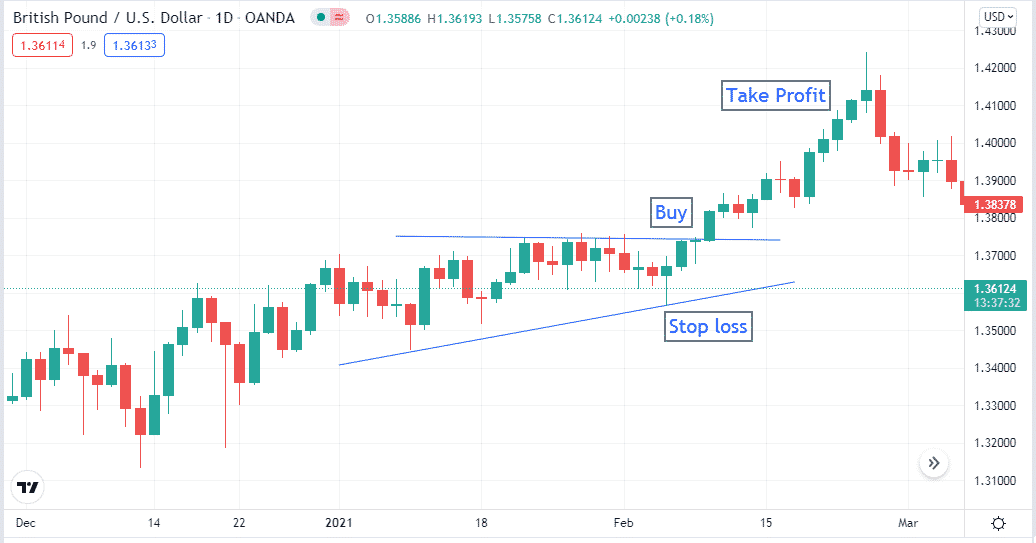
Wait until the price goes above the triangle range, which is also the end of the consolidation phase. Place buy order when price breaks above the triangle. Place an initial stop loss below the triangle with a buffer of 10-12pips. Set a profit target as the triangle size.
You can shift the stop loss into the triangle or at the breakeven point to reduce risk and as a part of trade management when price movement creates a new higher high.
Bearish trade setup
When you are seeking to place a sell order, identify that the market trend is bearish. Therefore, find the triangle breakout towards the downside and open trade when a candle closes below the triangle.
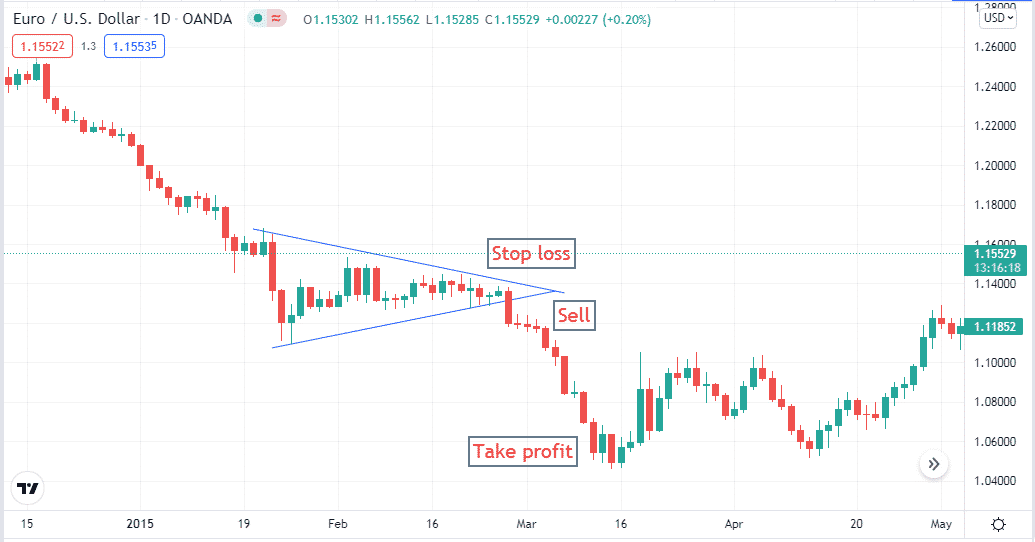
The gain corresponds to the distance of the triangle. From the beginning of the triangle to the breakout level. is the span of the triangle. After the bearish breakout, this is the appropriate area to place sell orders with an initial stop loss on the triangle with a buffer of 1012 pips. Wait for them to make a profit to be affected by the price movement.
You can change the stop loss in the triangle from breakeven to reduce risk and create a new lower low as part of your trade management after the price movement.
Is the strategy effective?
Experienced traders, upon detecting a triangle, instantly change their strategy to a system of work on this figure of technical analysis. But, beginners should not use this option for their trading because this strategy requires a piece of baggage of knowledge and experience and is quite risky, although it brings a high profit. Studying this strategy, trying it on a demo account, and only proceeding to actual triangle trading is recommended.
Final thought
Such strategies are prevalent and complete trading strategies that work fine on any time frame charts. Many financial traders choose this pattern to seek trading positions as these patterns allow frequent trading.
You don’t need to use any indicator to catch profitable trades with these tools. We suggest being careful or avoiding trade with these strategies during trend-changing events such as interest rate decisions, GDP, inflation, etc. Moreover, follow the rules of triangle patterns while making any entry with these strategies.


