The moving average (MA) is arguably the oldest technical tool used in technical analysis. While some technicians attempt to find the single best moving average by performing different calculations, others look for the best combination.
The number of combinations of MAs in various platforms is infinite. You can find several varieties using anywhere from two to five to 15 and more MAs. This is especially true when you go to tradingview.com and type something like “MA strategy.”
Plotting multiple MAs on your chart allows you to see the trend more clearly. You can avoid many false signals by simply utilizing more lines. Therefore, we can say that three MAs are better than two.
The question that begs an answer is: is the triple MA crossover golden for traders? Does it work in forex trading? You will know the answer as you read through this post.
What is triple moving average crossover?
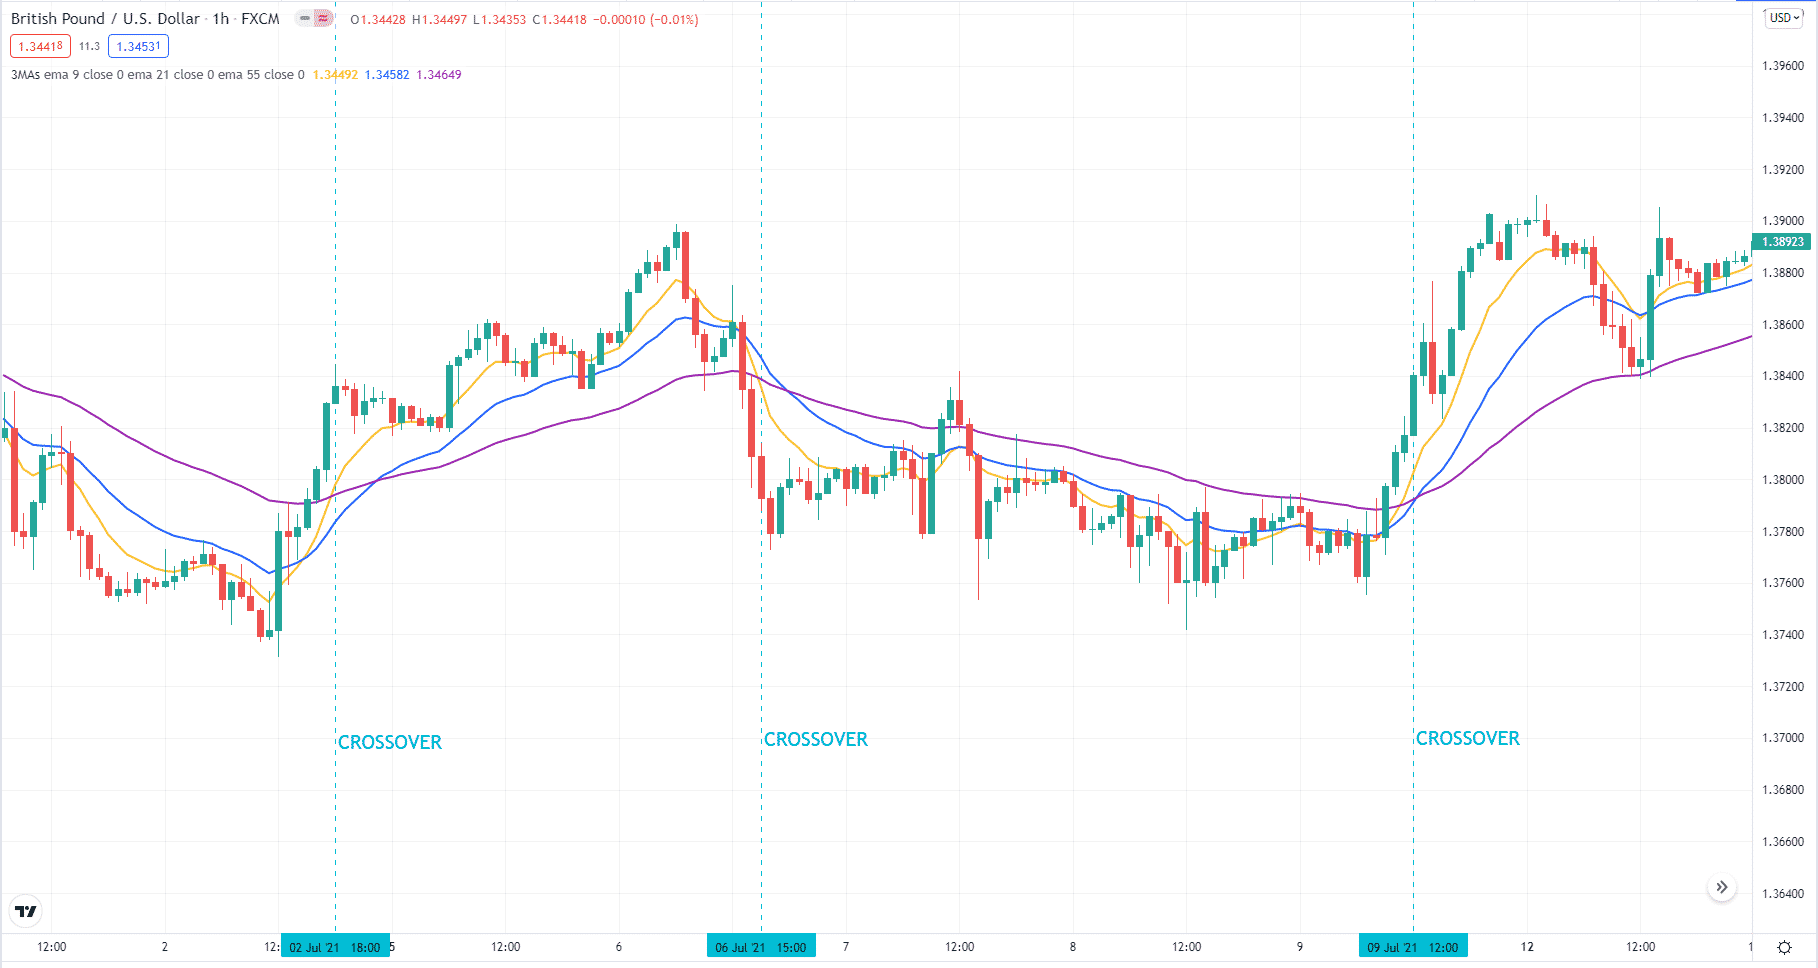
The triple MA crossover is a familiar trading system among forex traders. This method aims to trade with the trend following corrections or exploit reversals. The crossover involves the use of three averages with different periods:
- Long term
- Medium-term
- Short term
You can find various combinations used by traders anywhere online. You can use any average such as EMA, SMA, HMA, WMA, etc. In terms of period, some of the most common combinations are 400, 200, and 20, or 50, 21, and 8. Use the combination that resonates well with you.

How to trade with triple MA crossover?
There are many ways to trade the three MA crossover. Here we present a simple strategy that you can apply easily. It might work for you if you give it a try. This method makes use of the following averages:
- 55 EMA for long-term trend
- 21 EMA for medium-term trend
- 9 EMA for short-term trend
Apart from the averages, you can use your favorite chart patterns to align with the trend. You can apply this method in both pullback and reversal scenarios. To trade this system, ask the following questions in the order shown:
- Is there a trend? An uptrend exists if 9 EMA is above 21 EMA and 21 EMA is above 55 EMA. For a downtrend, follow the same logic but in reverse.
- What part of the trend are you looking at? Is the price in the trend’s beginning, middle, or end?
- Do you see a price pattern? It can be a 1-2-3 pattern, triangle, AB=CD, etc.
- Does price break outside of the pattern in the intended direction?
Bullish trade setup

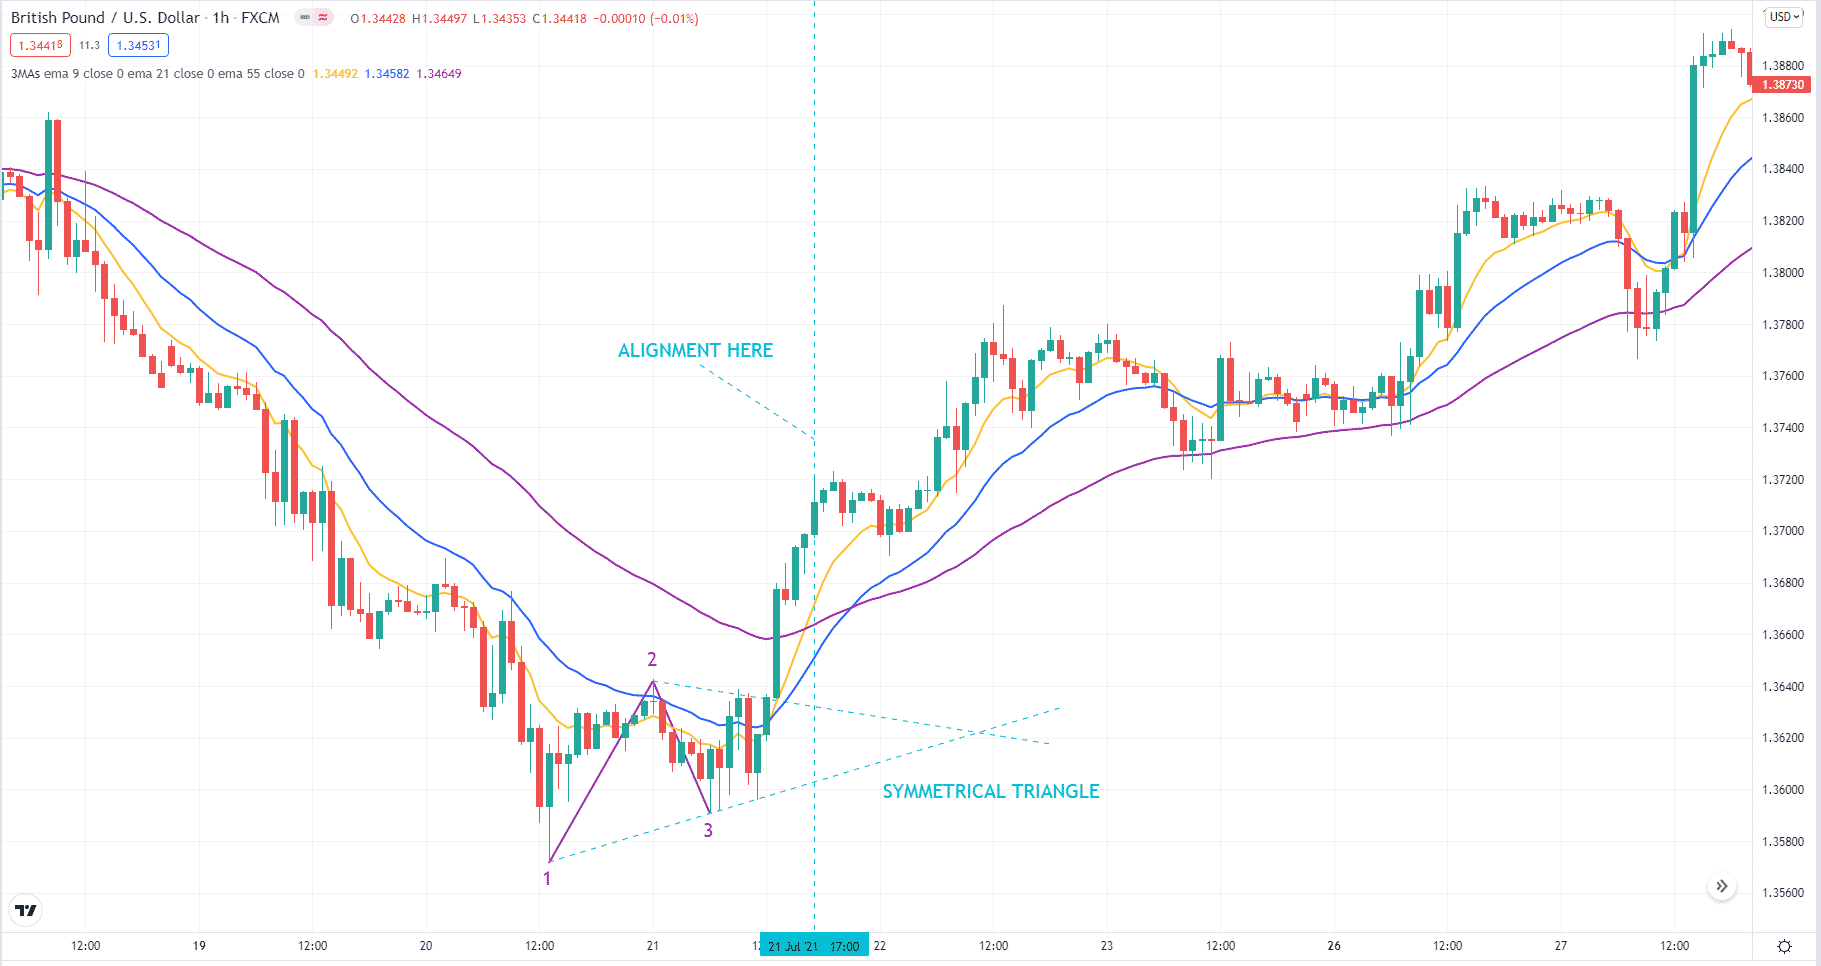
The above image shows an hourly chart of GBP/USD. The trend is down before the buy trade setup because the price is below the three EMAs. Here a potential setup forms at the end of the downtrend. The price pattern is a bullish 1-2-3 that turns into a symmetrical triangle. Since we are looking for a trend reversal, we would like the price to break above the triangle and take out point 2.
After these events unfold, the initial criteria are met, but we will not open a buy yet. We want the 3 EMAs to align first. It happens five candles after the break of the price pattern. Here we can put the stop loss at point 3 and trail the stop using swing lows.
Bearish trade setup

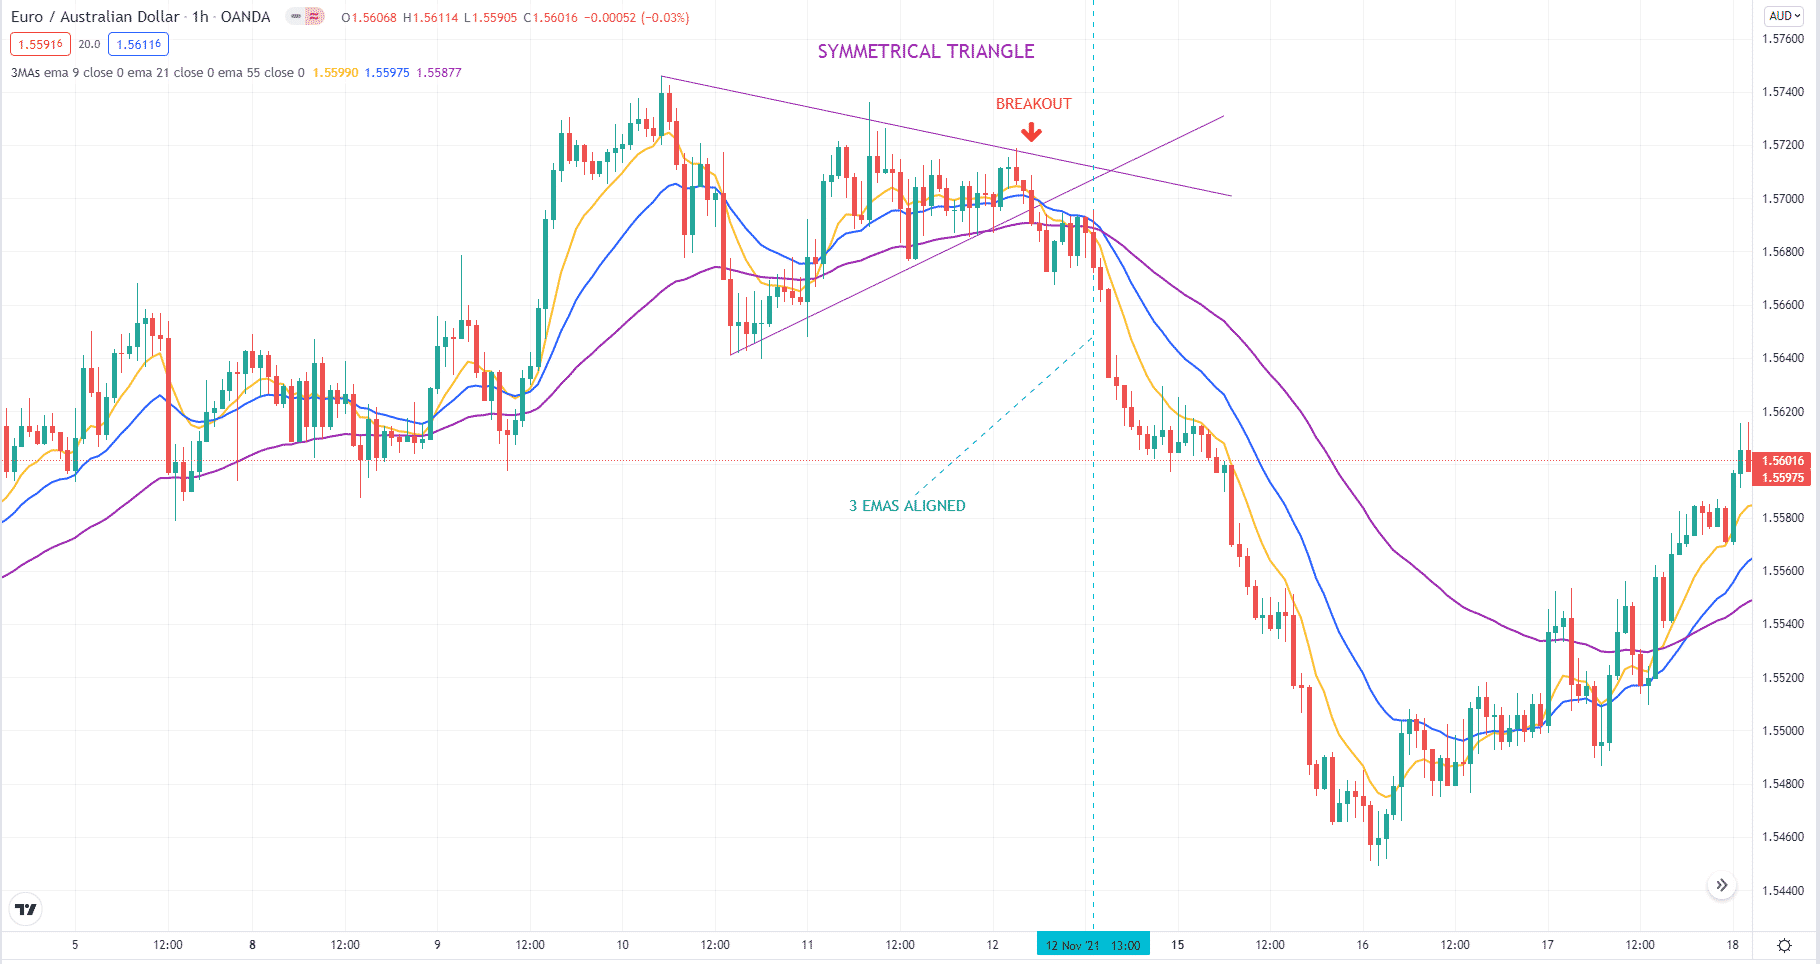
You see an hourly chart of EURAUD in the above photo. The trend is up before the sell setup because the price has increased from left to right. Here a potential setup comes up at the end of the uptrend. The price pattern is a symmetrical triangle. It can break up or down as it has a neutral tone.
After coiling inside the triangle, the price seems to be breaking to the downside. Our entry came a little later when all the 3 EMAs aligned. It happens about eight candles after the breakdown. Once we open the sell trade, we can put the sL on the swing high just before the triangle breakout. Again, we can use a trailing stop to squeeze as much market juice as possible.
How to manage risks?
There are two common ways to manage risk in forex trading.
- The first way is a stop loss, suitable for beginning traders.
- The second way is hedging, which is appropriate for advanced traders.
You can quickly implement the first option by placing an actual stop loss in your trade. The challenge is determining the correct lot size. The lot size is a factor of the risk percentage for each trade and distance from stop loss to entry. You can quickly get the volume with an online calculator by providing the preceding information.
On the other hand, hedging is a bit intricate to execute. There are many ways to implement hedging. One way to do it is using a pending order instead of a stop loss. Because of the complexity, it is better left for experienced traders to use. The challenge is how and when to get out of the trade cycle. It can take weeks or months before this can happen.
Final thoughts
As with any price averaging strategy, the method under discussion has a low win rate. This is because trade signals abound even when the market is ranging. To avoid frequent losses, you have to take high-quality setups only.
If you take every trade that comes your way, getting a low win rate is a self-fulfilling prophecy. You must use other tools to confirm a trade entry. This includes multiple time frame analyses. The higher time frame lets you see the setup in the context of the overall trend, while the lower timeframe defines the setup and the entry.
With experience, you will intuitively determine if a candidate trade has good winning chances or not. Keep learning. Do extensive hand testing and demo trading. After some time, you can dabble a small amount into a real account. This is to confirm if your demo trading is sufficient and effective.


