In technical analysis, many traders underscore the value of reading prices through chart patterns. However, not many talks about the accuracy of these patterns in actual trading. One reasonably popular chart pattern is triple top. Let us try to understand its effectiveness.
According to samuraitradingacademy.com, the triple top pattern has a 77.59 percent chance of success. This statistic derives from analyzing more than 200,000 patterns spanning ten years of market data.
If this is how effective the triple top is, why do many traders still lose money? One possible reason is that traders may lack confidence in trading the setup. Another reason is not following the trade plan. To succeed in trading, seek triple top setups on your charts and trade them as they arise.
Can you identify this pattern when it shows on your chart? The triple top seldom shows up, but it gives you a trade with a high degree of success when it does. That is what you will learn in this article. You will understand what makes a good setup, when to enter, and when to exit.
What is a triple top pattern trading strategy?
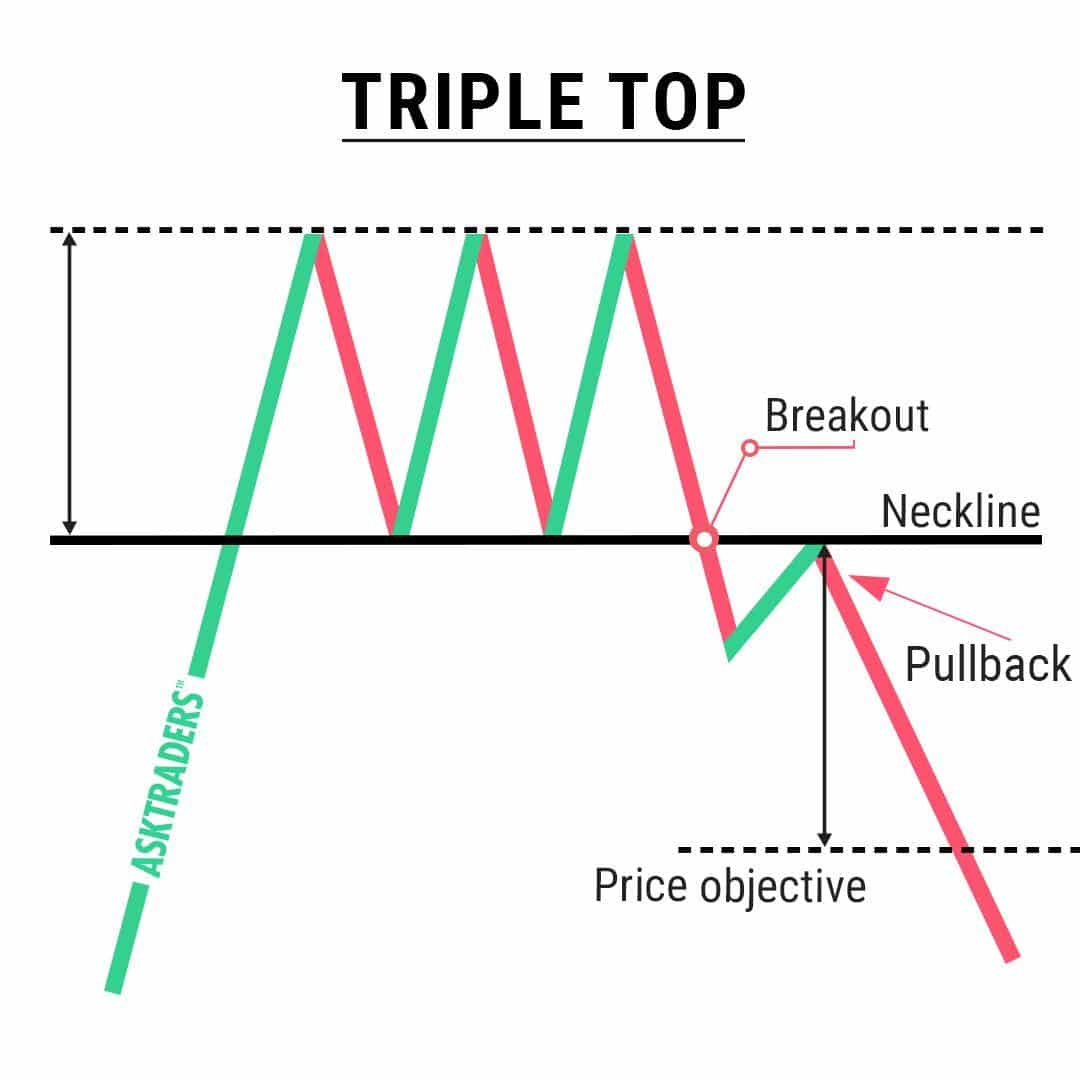
It is a type of chart pattern traded by technical traders. It is similar to the double top in terms of the manner of trading the pattern. The only difference is the number of peaks that define the pattern. As the name suggests, a triple top requires three successive tops to form at the same level or essentially so. Before you can tell that a triple top has formed, an uptrend leading to the formation must exist.
While you can find perfect triple top setups on your charts, they come very rarely. An ideal setup has price swings that form exactly flat resistance and neckline. More often, the resistance is slightly inclined, so does the neckline. Keep in mind you do not need a perfect triple top for trading.

How to trade with a triple top pattern strategy?
Three things must happen in the correct order before you trade a triple top. This series of events is outlined below:
- The price must trend upward prior to the setup.
- The price must hit resistance and fail three times.
- The price must break the neckline after the third failure to break above resistance.
As a breakout strategy, the triple top offers you two types of entry:
- Immediately after price breaks and closes below the neckline.
- Sell limit order at the backward retest of the neckline.
Concerning the stop loss, you have two options as well:
- Slightly above a congestion area that forms before the neckline breakout.
- The middle point of the vertical range from resistance to the neckline.
The take profit is identified by measuring the height of the range using a rectangle, copying this rectangle, and putting it below the neckline. The take-profit price is the lower side of the rectangle. Refer to the above diagram.
Bearish trade setup
Since the triple top pattern is a bearish reversal structure, we will only show examples of bearish trade setups. We will present two examples to cement the concept in your mind.

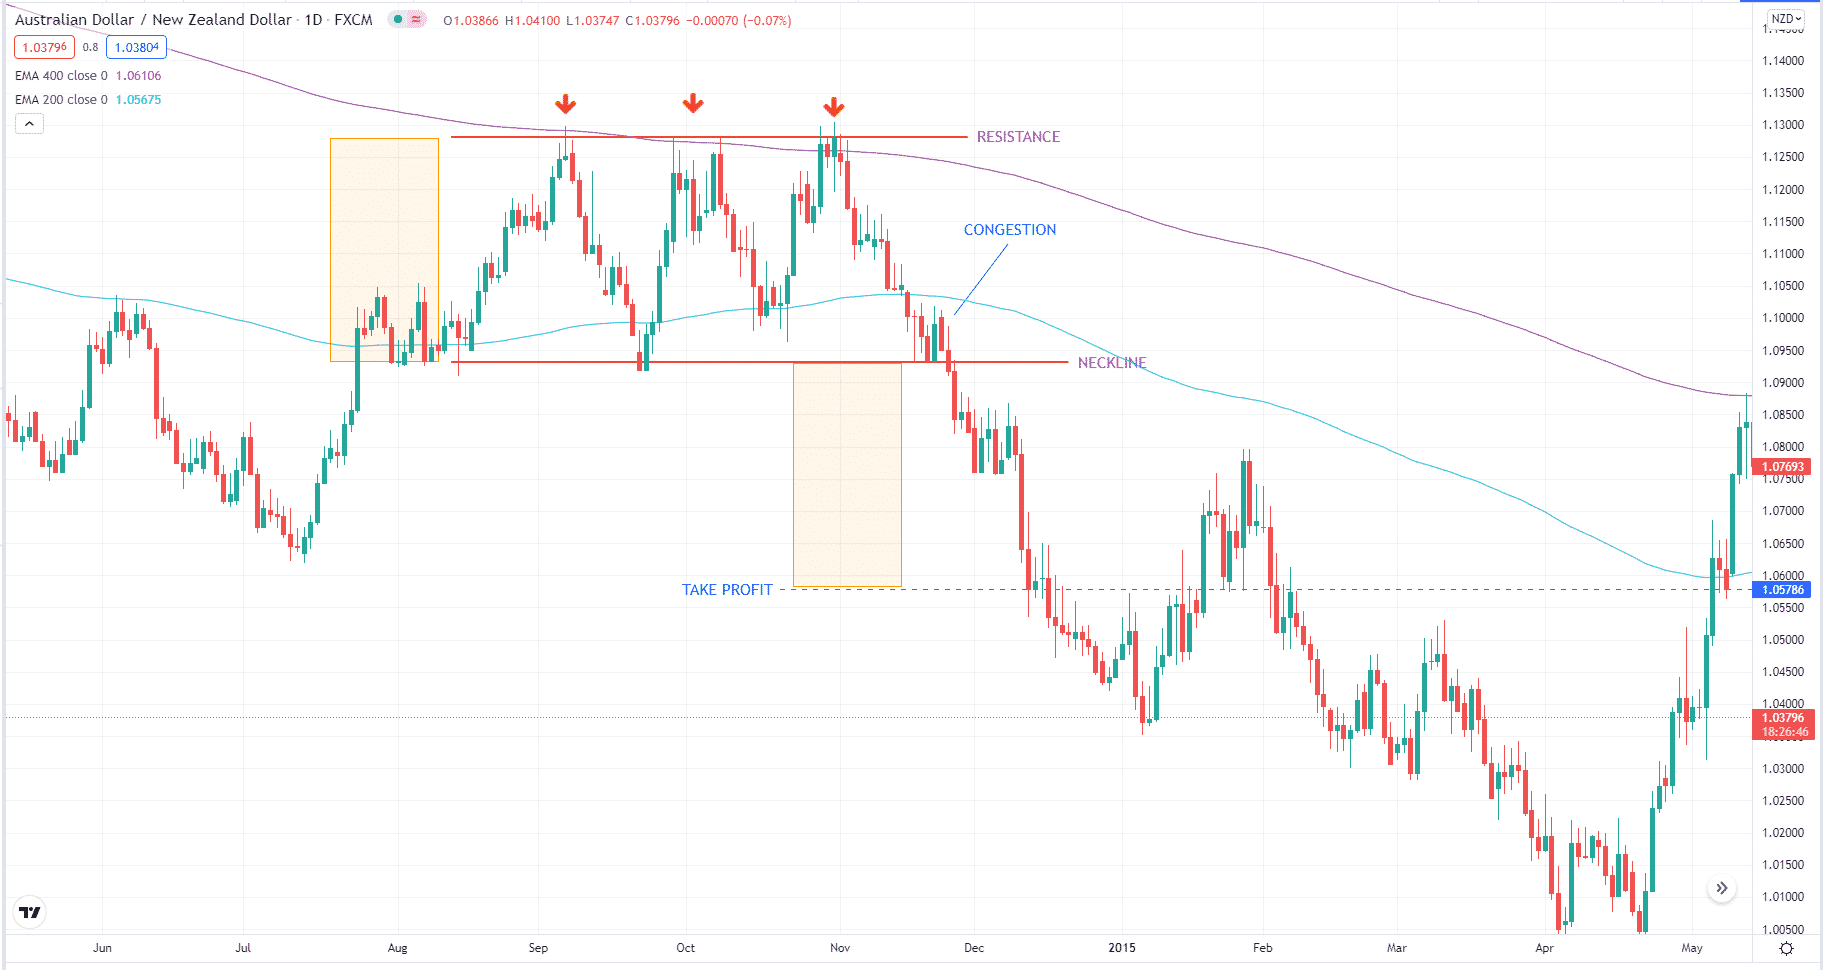
The above chart shows a sell setup. The triple top pattern is pronounced here, marked by three down arrows above. The downside of this setup is that the neckline is a bit off. We can draw the neckline here as an angled trendline to create a triangle pattern. The reason why we keep the neckline flat is because of the congestion that formed before a breakout. The upside of this setup is that it forms in sync with the overall downtrend.
The moment a bearish red candle breaks and closes below the neckline, you can execute a sell trade. The take profit is relatively easy to set. Setting the stop loss is challenging because there is no apparent structure nearby. You can put the stop loss above the congestion area or at the middle of the range formed by the resistance and neckline. You can use either the previous swing low to the pattern’s left or the range distance itself. The trade plays out quite favorably afterward.

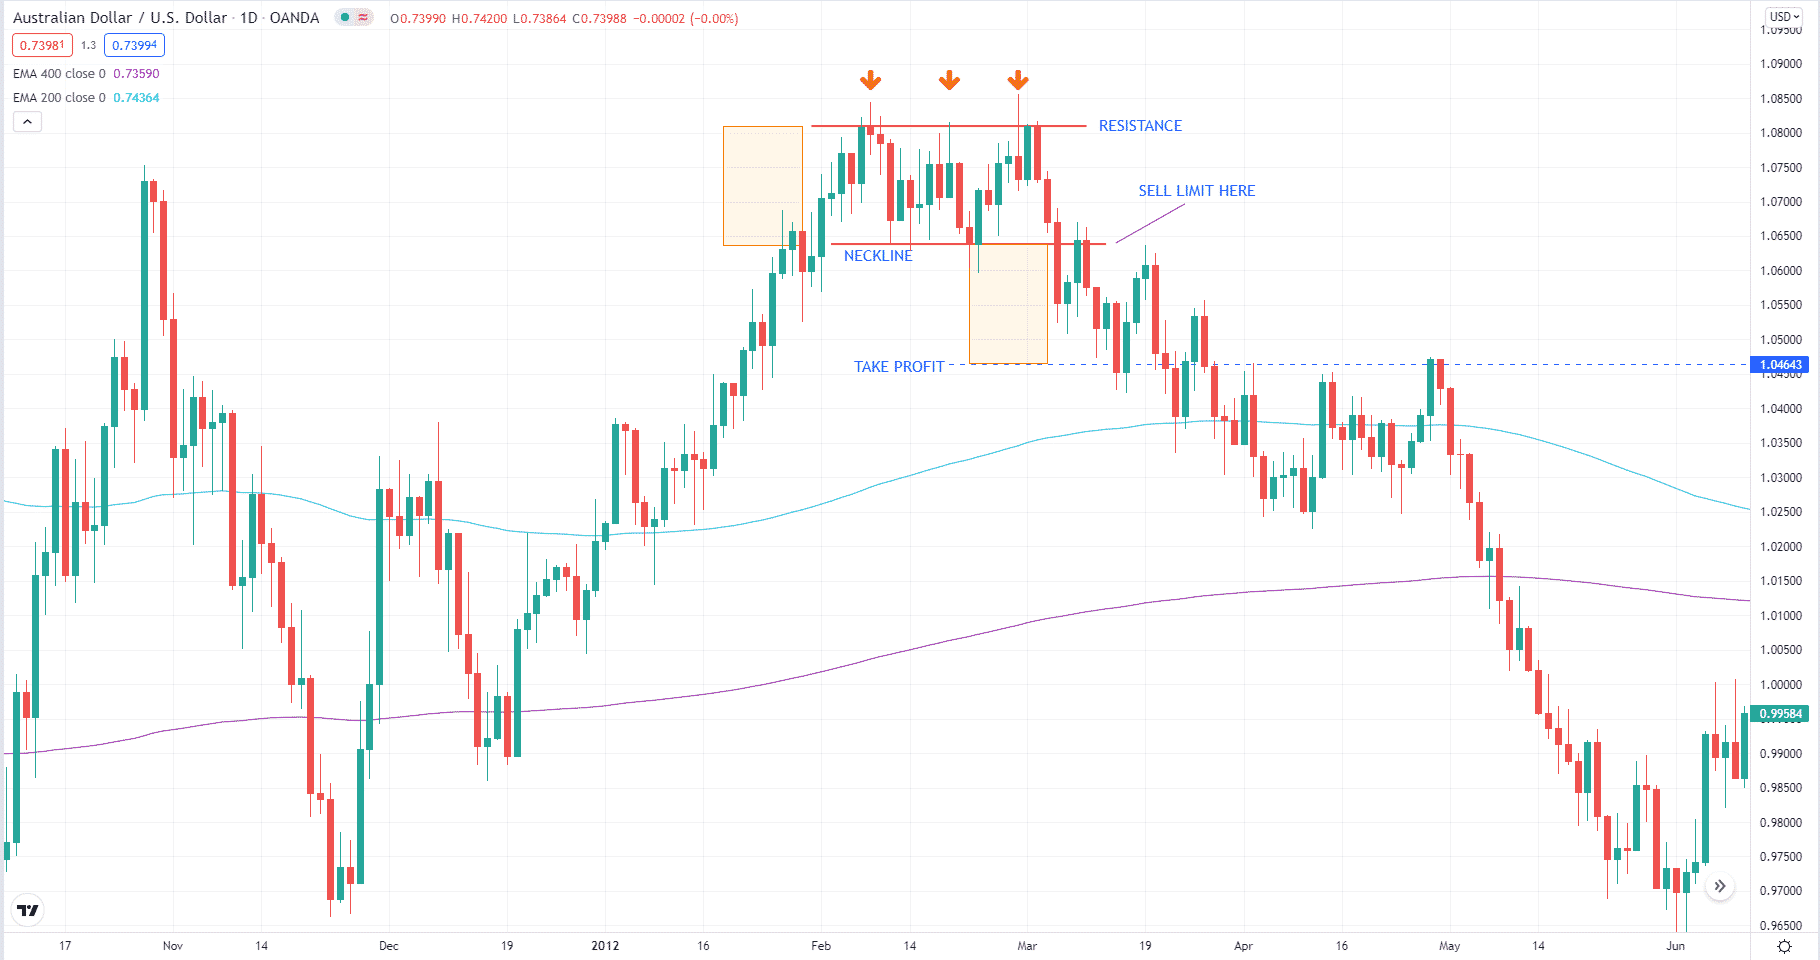
The above chart shows a triple top pattern that forms rather quickly. The formation is completed in a few candles, and the size is reasonably small. By definition, this pattern is valid. The neckline is evident as the price oscillates typically within the range. The challenges here are entry, stop loss and profit. Entering after the breakout candle has closed is not a good idea. With that entry, the take-profit target would be too small.
The best way to enter this trade is a sell limit. With this entry, the market may take off without triggering the entry. In this case, though, the price retests the breakout point and goes down immediately. You could place the stop loss at the middle of the range. Since there is a large swing to the left of the setup, you could aim for bigger targets.
How to manage risks?
The best way to manage risk when trading chart patterns is a stop loss, which defines the risk in each trade. Professional traders counsel that you should risk at most two percent of your account in a trade. This will give you the exact amount in dollars for your risk. Depending on the distance of the stop loss and entry, you can get the trading volume for your trade. This is the best way to keep the trade risk dynamic as your account size grows or shrinks.
Final thoughts
As pointed out in the beginning, the win rate of the triple top is 77.59 percent. This success rate is high enough that anyone trading this method should become successful. What you need to do is trade every triple top setup that comes your way.
Aim for at least a 1:1 reward-risk ratio in each trade. After a significant amount of trades, you should come out as a winning trader. Now it is time for you to put this idea to the test through demo trading. Once you achieve consistent success, that is the time to trade for real.


