The Wave Period Zone Oscillator (WPZO) is a powerful technical indicator calculates the market cycle. This concept applies to many trading assets, including cryptos. So it makes sense that crypto investors use the WPZO to create sustainable trading strategies.
However, when seeking to use any technical indicator effectively, it requires learning the components and following particular guidelines. In this article, we will dive down into the WPZO indicator. Moreover, we will list the top five tips with chart attachments to effectively use this indicator in crypto trading.
What is the Wave Period Zone Oscillator (WPZO) indicator?
It is a unique technical indicator for obtaining the market context. Crypto traders often use this technical indicator to determine precious trading positions. The indicator shows results in an independent window containing a dynamic oscillator line that floats according to participants’ actions and price performance.
This indicator window has a green zone on the upside and a red zone on the bottom side. The green zone starts from the +40 level, and the red area starts from the -40 level. There is a central zero level. Crypto investors usually generate trade ideas from the diversion of the dynamic line. The reading reaches above the central (0) line declaring a positive force or buying pressure on the asset price declines below it, declaring bearish pressure.
The +40 and -40 level indicates overbought and oversold levels. Meanwhile, the extreme overbought and oversold levels are above and below the +60 and -60 levels.
Top five tips using the WPZO indicator in crypto trading
Using the indicator in crypto trading requires following specific guidelines to obtain the best results. The following section will list the top five tips to use the indicator in crypto trading most effectively.
Tip 1. When entering buy trades
When seeking to open buy positions, observe the indicator window; it starts making diversions on the upside and declares a potential bullish momentum. Crypto traders often open a buy position when the dynamic line reaches above the central level.
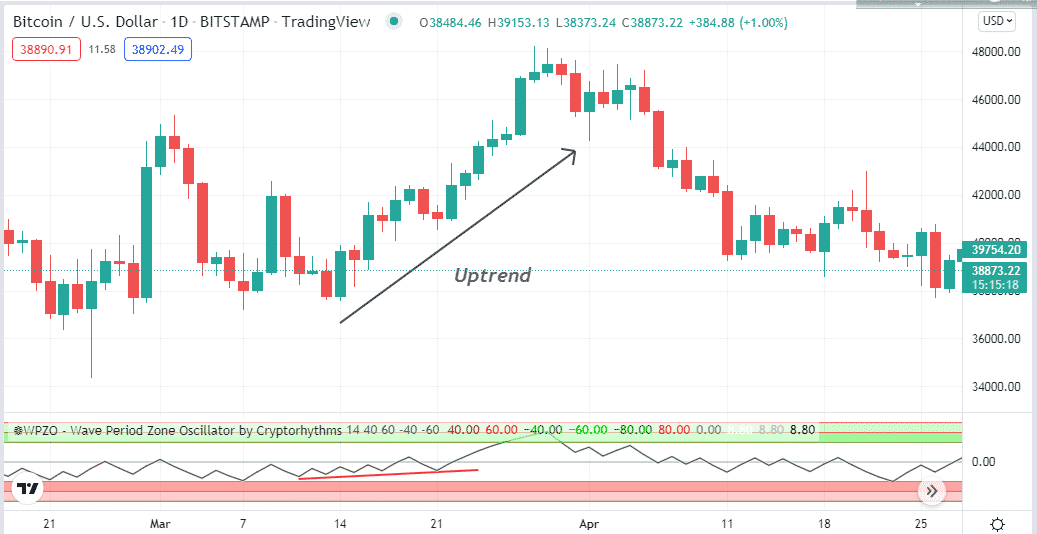
Why does this happen?
It happens as the WPZO indicator is an oscillator indicator that detects the price movements and the trend directions. Using upward diversions for entering buy trades is common among financial investors as this concept is applicable in many technical indicators.
How to avoid risk?
When the dynamic line reaches above the +40, it declares the price reaches an overbought level and indicates extremely overbought when the reading reaches the +60 level or above. Set proper stop loss below the current bullish momentum to reduce the risk on capital when entering buy trades.
Tip 2. When entering sell trades
Mark downside diversions at the dynamic line of the WPZO indicator window when seeking to open sell positions. Crypto investors often open sell positions when the dynamic line reaches below the central line as it declares potential declining pressure on the asset price.
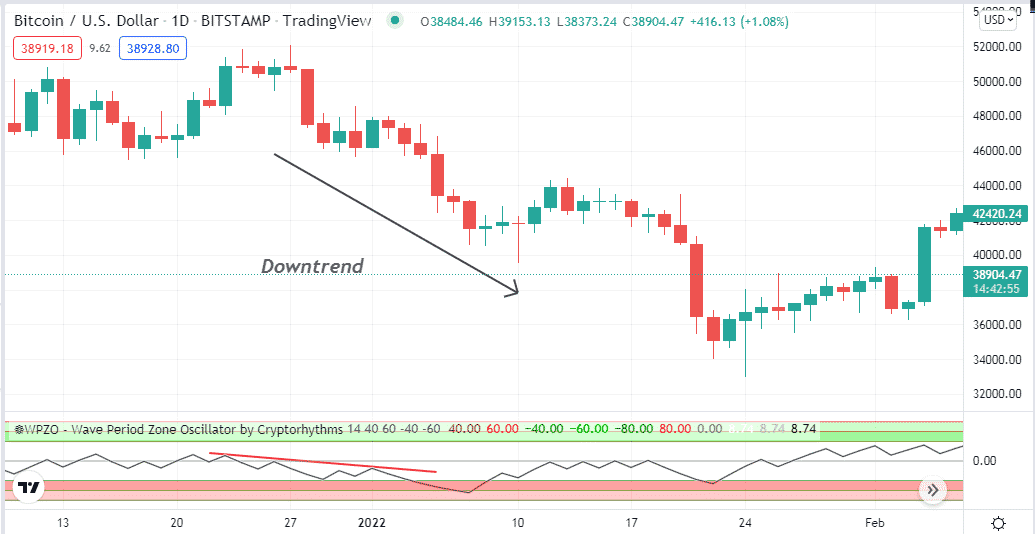
Why does this happen?
The WPZO is among the oscillator indicators, and it is common among them to determine trend directions by using deviations. Moreover, this straightforward indicator indicates sufficient sell pressure when the dynamic line reaches below the central line and detects oversold and overbought levels like many other technical indicators.
How to avoid mistakes?
Don’t enter trades early; confirm the trend direction from upper time frame charts. Moreover, use proper stop loss to reduce risks to capital. You can use other technical indicators or tools to detect more efficient trading positions.
Tip 3. Detect sideways using the WPZO indicator
You can use the sideways or low volatile phases using the WPZO indicator. When the price moves sideways, the dynamic line usually loses direction and creates ups and downs in a smaller range. Determining sideways is essential to identify the most potent trading positions or avoid entering the market.
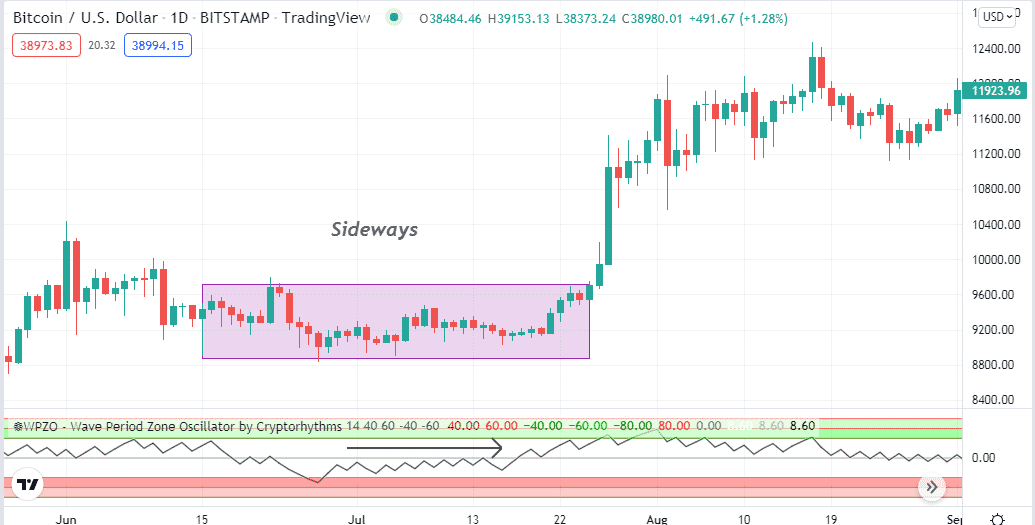
Why does this happen?
The price usually moves sideways when the volume decreases and the trend loses strength. The WPZO is an oscillator indicator that makes frequent ups and downs during the ranging/sideways price movements.
How to avoid mistakes?
It is better to avoid trading sideways, although many trading strategies enable making profits in consolidating phases. You can make entry/exit positions near support resistance levels when the range is more significant.
Tip 4. Identify breakout levels
You can easily identify the breakout levels using the WPZO indicator alongside other technical indicators like the Bollinger Band, ADX, etc. For example, use the WPZO diversion line to detect the price direction, then combine the reading with the ADX indicator to determine strength or confirmation.
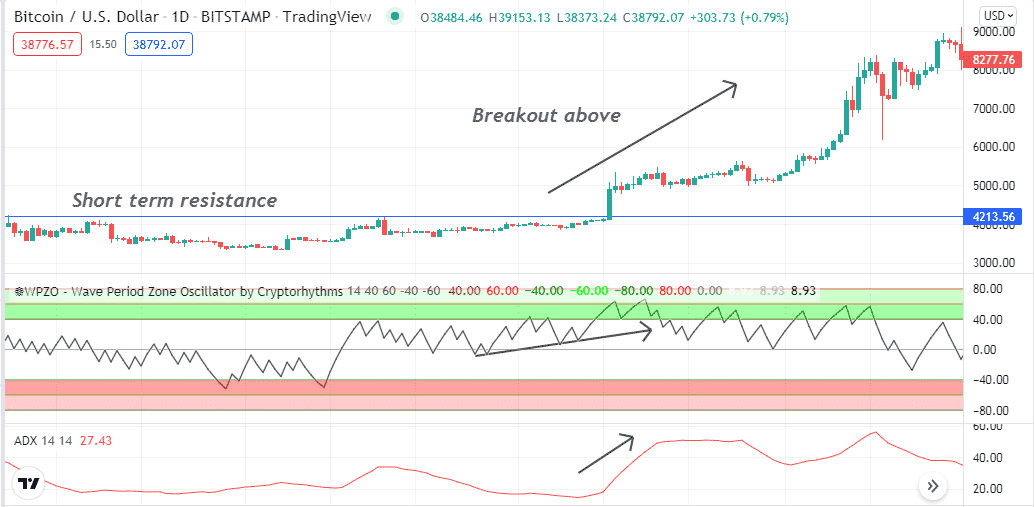
How does this happen?
It happens following simple concepts of the indicators. For example, the WPZO indicator suggests bullish momentum; then, the ADX indicator confirms the strength is sufficient for the current trend. So it makes sense that crypto investors open positions in the same direction.
How to avoid mistakes?
It is better to use both indicator readings to determine efficient trading positions. Moreover, you can conduct multi-timeframe analysis to detect more precious trading positions.
Tip 5. Combining the parabolic SAR with the WPZO indicator
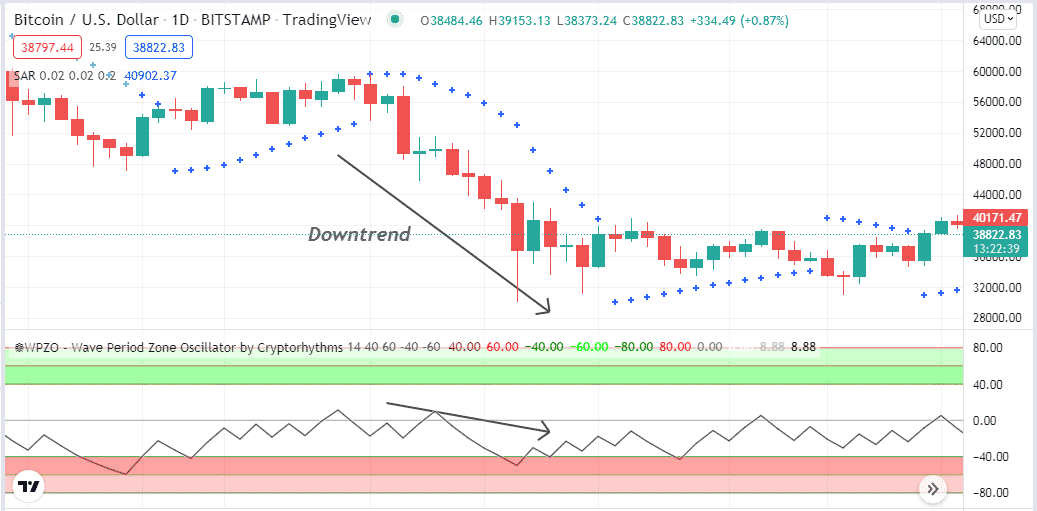
It is common among crypto investors to combine readings of two or more indicators determining precious trading positions. For example, you can combine the WPZO indicator reading with the parabolic SAR when making trade decisions.
Why does this happen?
Investors usually open positions as both indicators suggest any specific directions. For example, WPZO indicates the price remains on a downtrend, and the parabolic SAR dots also make a series above price candles which confirms the price continues to decline.
How to avoid mistakes?
Combine both indicator readings carefully before opening any trading position. Moreover, follow proper trade and money management rules to reduce risk on capital when using the WPZO indicator for trading crypto assets.
Final thought
Finally, The WPZO indicator is one of the best oscillator indicators that you can use to participate in enormous profitable trades. You can use the tips above to use this popular indicator most effectively.


