Yearn.finance or YFI can be an attractive investment option when you seek to invest in DeFi projects. This project got the attention of blockchain investors for enabling automation to maximize profits. This crypto project became so popular among crypto investors that the price spiked near 96k in Q2 last year.
However, it is mandatory to follow specific guidelines to obtain the best results when investing in any asset. This article introduces you to the Yearn.finance (YFI) alongside listing the top five tips for investing in this crypto project.
What is Yearn.finance and top five tips for trading YFI
A unique blockchain protocol allows investors to make enormous profits from yield farming using automation. This platform aims to simplify the ever-expanding DeFi space for participants who are not usually interested in approaching the marketplace in a less committal manner than expert investors. The launching period of this platform is 2020. The native token of this platform is YFI, and the maximum supply amount is 36,666 YFI.
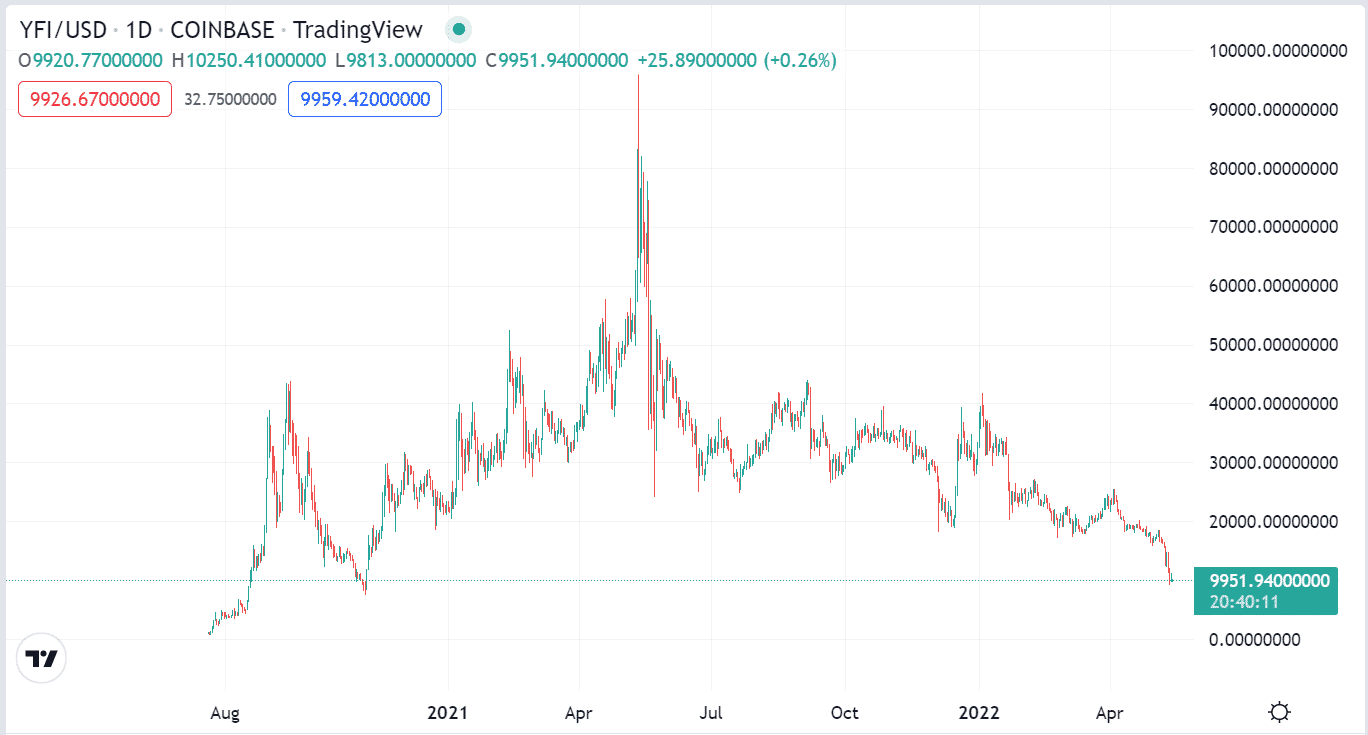
Let’s check the basic info of YFI at a glance
- Fully diluted market cap: $382,592,177
- Live market cap: $382,297,102
- Current price: $9951.94
- 24-H trading volume: $137,923,880
- Circulating supply: 36,637.72 YFI
- Total supply: 36,666 YFI
- Max supply: 36,666 YFI
- Volume / market cap: 0.3657
The following part will list the top five tips to trade YFI.
Tip 1. Understand the project
When investing in any trading instrument, it is mandatory to understand the project. It includes understanding the project’s base and offerings to predict the project’s future. Crypto investors often focus on relative information about the project, including the community behind the project, security, scalability, utilities, etc.
When you have a basic understanding of the crypto project, you can easily predict the potential future demand and be beneficial. You can find many crypto exchange platforms offering YFI pairs with stablecoins and fiat currencies as freely-tradable crypto.
Why does it happen?
Crypto investors often focus on relative information about the project, including the community behind the project, security, scalability, utilities, etc. Anyone with a basic understanding of the project can easily predict the potential future demand and be beneficial.
How to avoid mistakes?
Don’t invest too much beyond what you can afford, as crypto assets are a new product in the financial market currently in the implementation and adoption phase.
Tip 2. Determine the trend
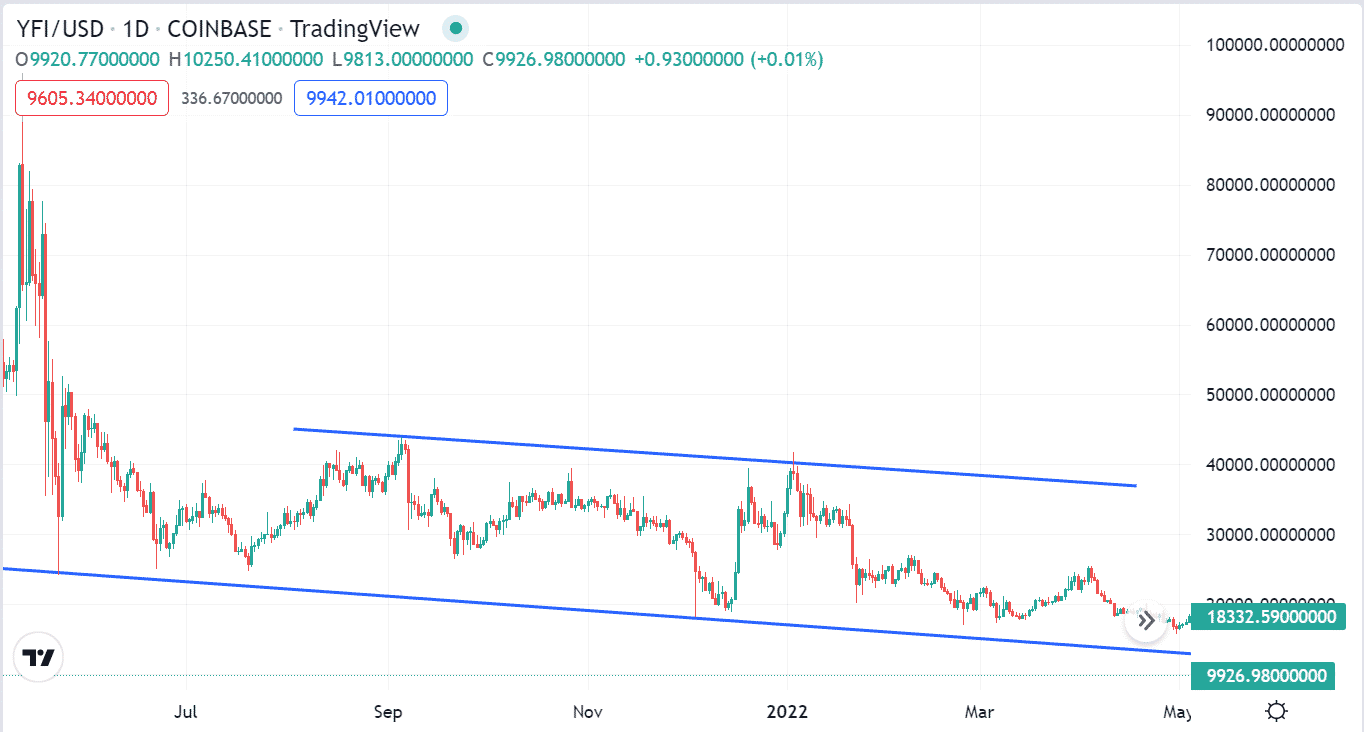
Determining the trend is always the best way to understand the primary technical market data. You can specify the current trend by using a trendline or channel. We suggest conducting a multi-time frame analysis using a trendline as upper timeframe charts show certain assets’ current and overall price trends. The YFI/USD pair remains in an overall downtrend in the daily chart.
Why does this happen?
It happens as the price always makes ups and downs during shifting. You get the current trend when connecting the upper or lower edges through trendlines or trend lines.
How to avoid mistakes?
Don’t force the edges to connect. Moreover, when drawing a price channel, try opening buy positions near the support or lower line and sell positions when the price reaches or rejects from the upper line.
Tip 3. Spot sideways
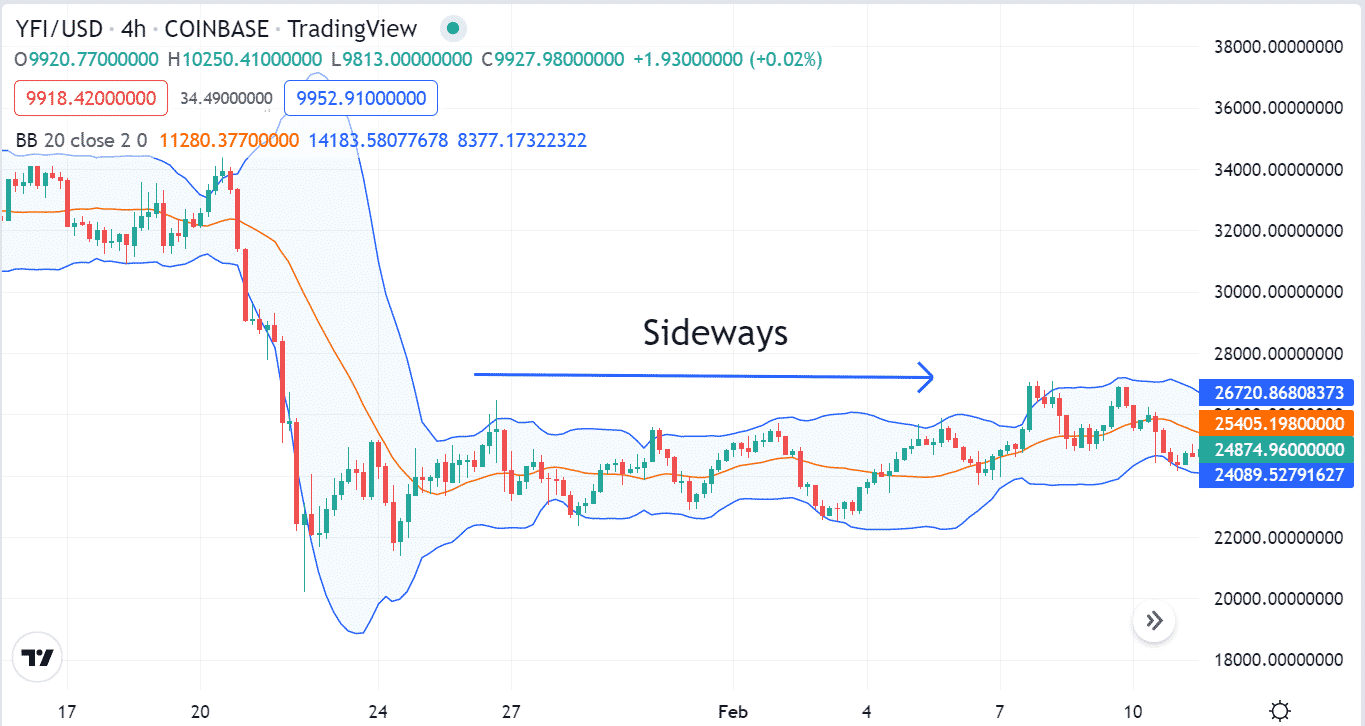
It is essential to mark sideways as consolidation comes with opportunities in many trading instruments. Using a popular technical indicator Bollinger Bands (BB), you can spot sideways. When the bands get closer, you mark a consolidation phase or less activity by the participants.
Why does this happen?
The BB indicator is popular among financial traders for its easily applicable features. The price consolidates or moves sideways when the volume decreases, and the bands of BB come closer and reflect the indecision.
How to avoid mistakes?
Investors who don’t like making frequent trades and seek to make considerable profits usually avoid these consolidation phases. They wait till a breakout occurs and open positions in the direction of breakouts.
Tip 4. Mark breakouts
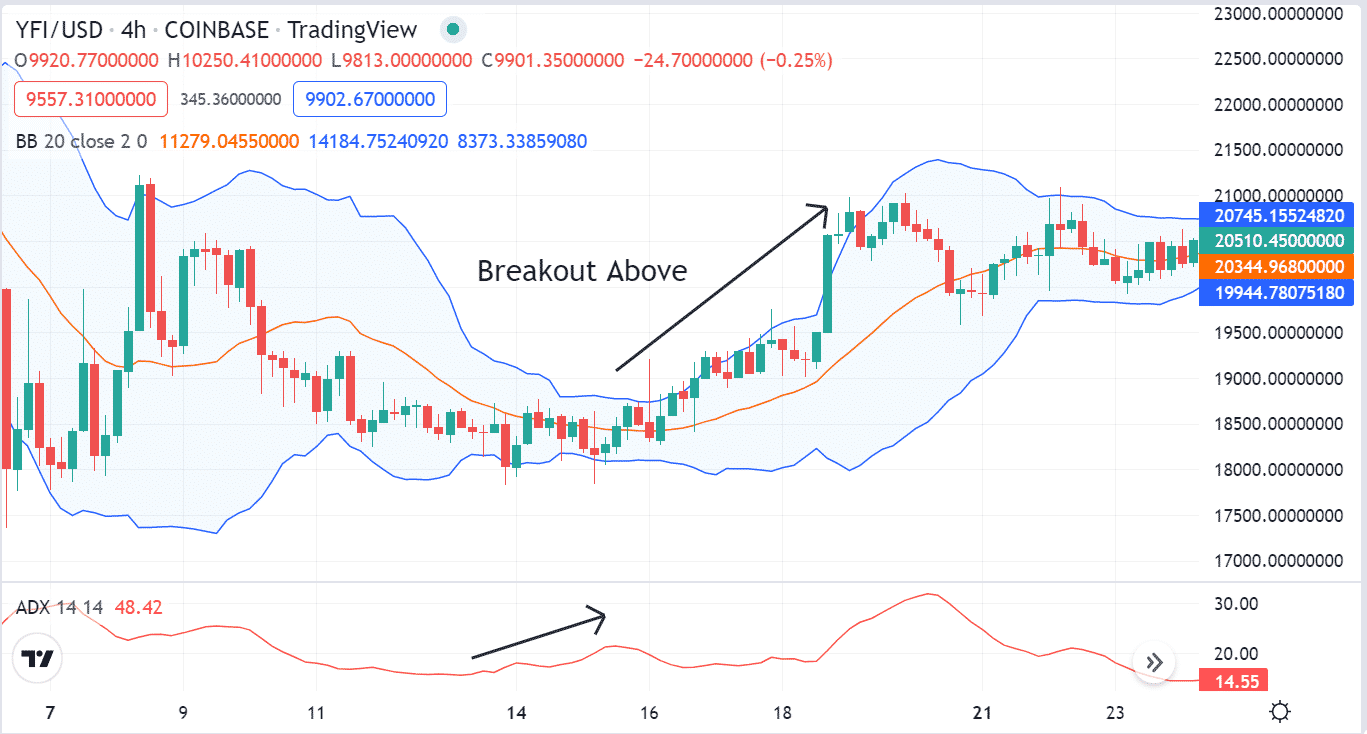
Smart crypto traders seek breakouts to obtain the market context and open potentially profitable trades by utilizing them. You can spot breakouts by combining the BB indicator with the ADX indicator. For example, the price reaches above the middle band of the BB indicator, and the band gets wider on the upside. Meanwhile, the ADX indicator reading may reach above 20, declaring a potential bullish breakout.
Why does this happen?
In this case, the BB indicator confirms the price direction, and the ADX indicator confirms the force or strength of the current trend.
How to avoid mistakes?
Don’t enter the market too early. We suggest conducting a multi-time frame analysis to sort the fakeouts and avoid them. When you observe multi-timeframe charts, it becomes easier to determine the actual trend and consistently seek to open positions in the direction of long-term trends.
Tip 5. Combining the Parabolic SAR and the RSI indicator
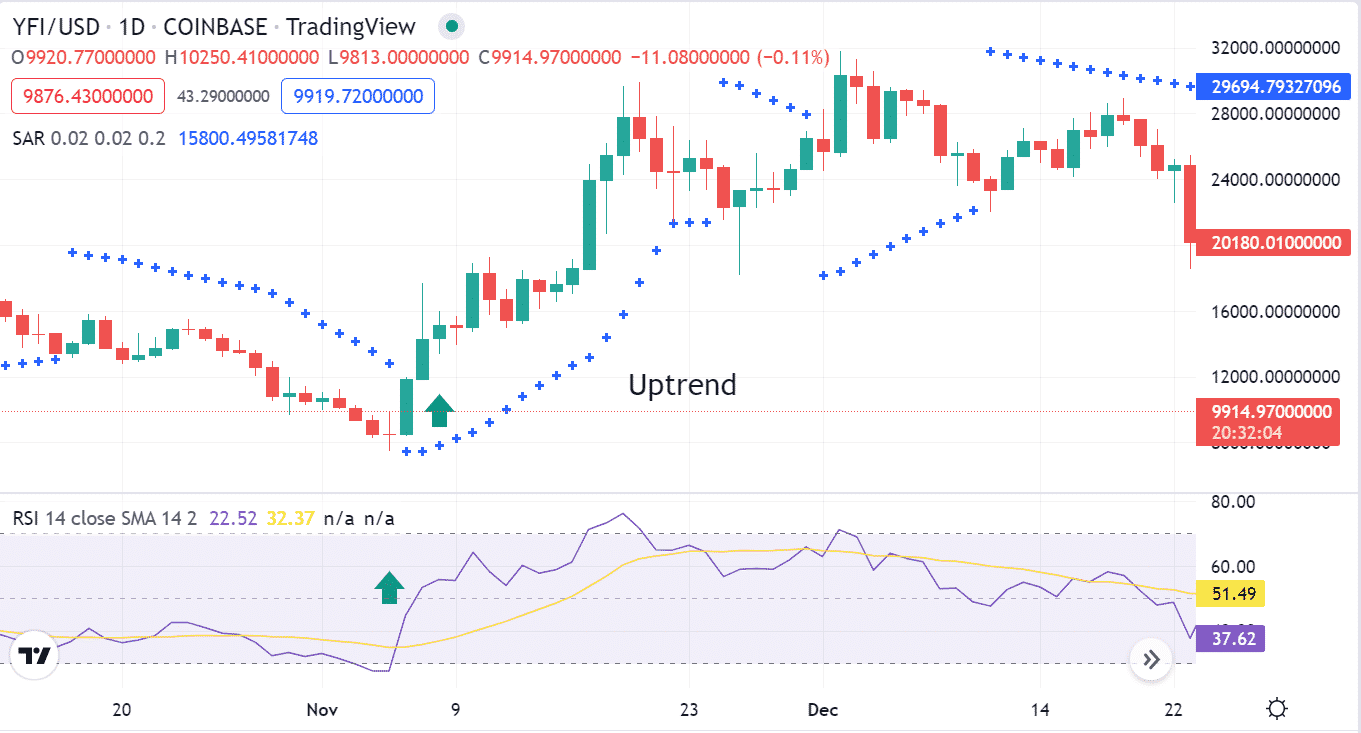
Many crypto investors use two or more technical indicators to obtain the market context. Combining different indicators enables the opening of more efficient trading positions. For example, you can combine the Parabolic SAR and the RSI indicator to identify efficient trading positions. When both indicators suggest price movement in a particular direction, open buy/sell positions to make considerable profits.
Why does this happen?
When the parabolic SAR dots take place below price candles, the dynamic RSI indicator reaches near the central (50) level, and heads upside declares initiation of a potential bullish trend and vice versa.
How to avoid mistakes?
Always use proper stop loss for your open positions. Combine both indicators readings carefully and confirm that the scenarios correctly match your target asset chart. Close the open positions when both indicators confirm an opposite pressure on the asset price than your executing trade.
Final thought
The YFI token has the potential to grow in the future as blockchain technology is emerging with various attractive features. However, this technology is still in the implementation phase, and the complete adoption may take time.


