As a trader, every participant must know when to enter and exit the market depending upon the market conditions. Apart from the various strategies you use, it is also necessary to count a few characteristics of the particular market you will trade-in.
One of the reasons why forex is so popular is its high volatility, which plays an extensive role in every form of trading. We often tend to focus on the direction of the trend, indicators, or price action strategy but do not concentrate our attention on the market volatility.
Now you must be wondering how you will measure the volatility in forex trading. You will find many indicators for momentum, trend direction, overbought and oversold, but it is hard to find an indicator that measures the volatility.
Yes, an indicator that retail and institutional traders widely use to measure any market volatility in FX before entering. The indicator is called the average true indicator. Now let us jump into the article to understand the awesomeness of this indicator.
What is the ATR indicator?
The average true range indicator, commonly known as ATR, is used to measure the volatility of any trading asset. It calculates the average statistic of the movement of an asset per unit of time.
J. Welles Wilder, a mechanical engineer, and later became an estate developer, made the ATR. He has made several indicators and is widely known for his remarkable work in technical analysis.
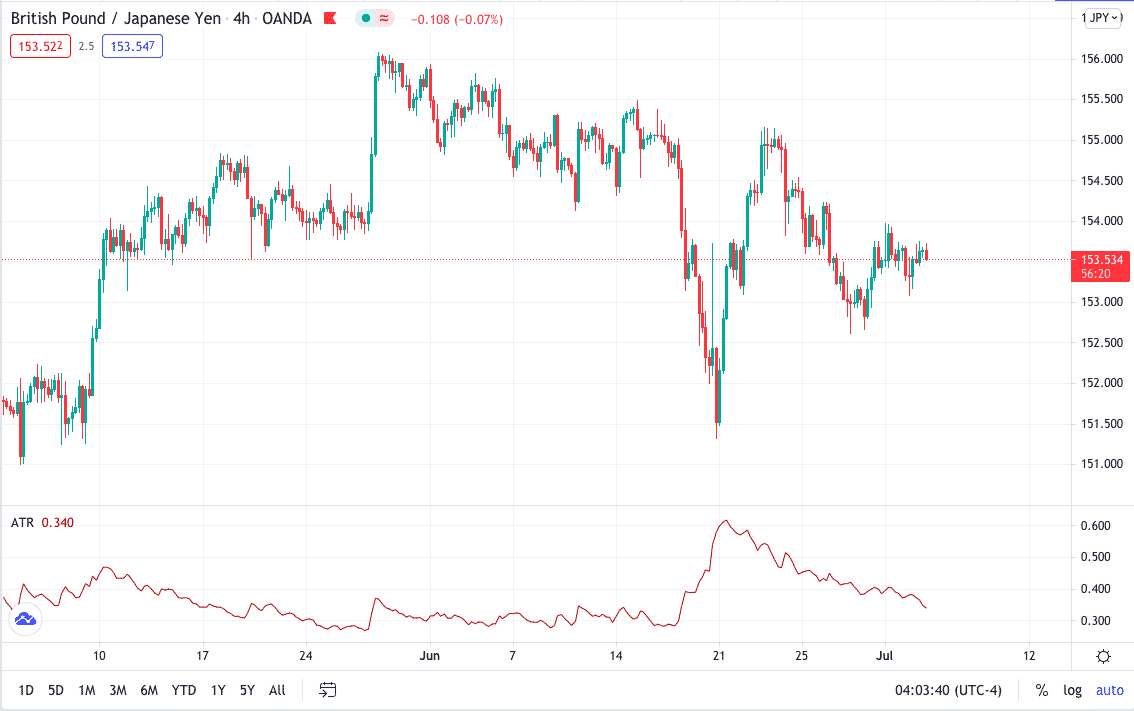
The average true indicator was made and used on commodities and indices as these instruments were the most volatile once compared to the stock market. Later, as the market evolved and forex transactions increased, traders used it in FX.
How to calculate the ATR?
The true range for a given trading period is calculated using any of these three methods:
- Current high minus the previous close
- Current low minus the previous close
- Current high minus the current low
The highest absolute value is recorded for each period, and then an average is taken.
Conventionally, 14 periods are used in the calculation. The formula used by J. Welles Wilder for successive periods after the initial 14-period ATR was completed is:
Latest ATR = ((prior ATR x 13) + current TR) / 14
Using ATR in your trading
Volatility is not constant in any market and varies from time to time, i.e. the market can be a less volatile one with less traded volume and can suddenly change into a highly volatile one and vice-versa.
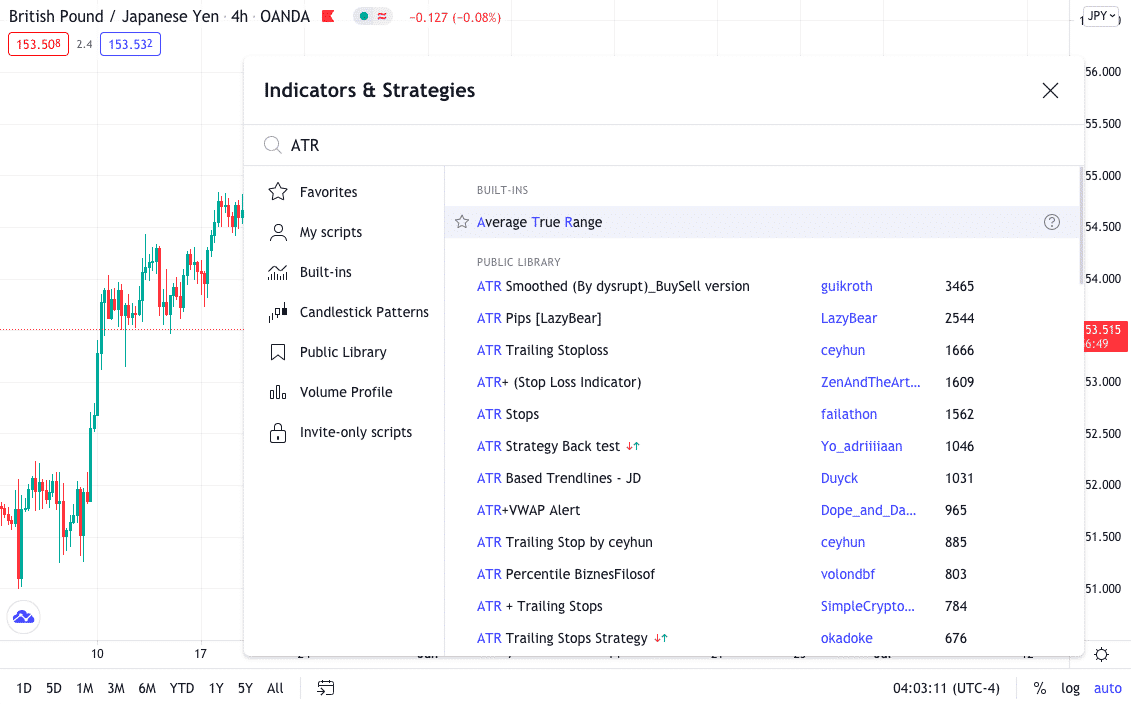
The ATR indicator moves up and down when the price movement becomes larger or smaller during the trading session.
In a five-minute chart, the ATR reading is calculated every five minutes, while in a 4hr chart, it is calculated every 4hr.
For intraday trading, you can use a 30min or 1hr time frame. The FX will show a higher spike in the ATR when the two trading zones combine, say the US and London session.
Using ATR for setting up SL
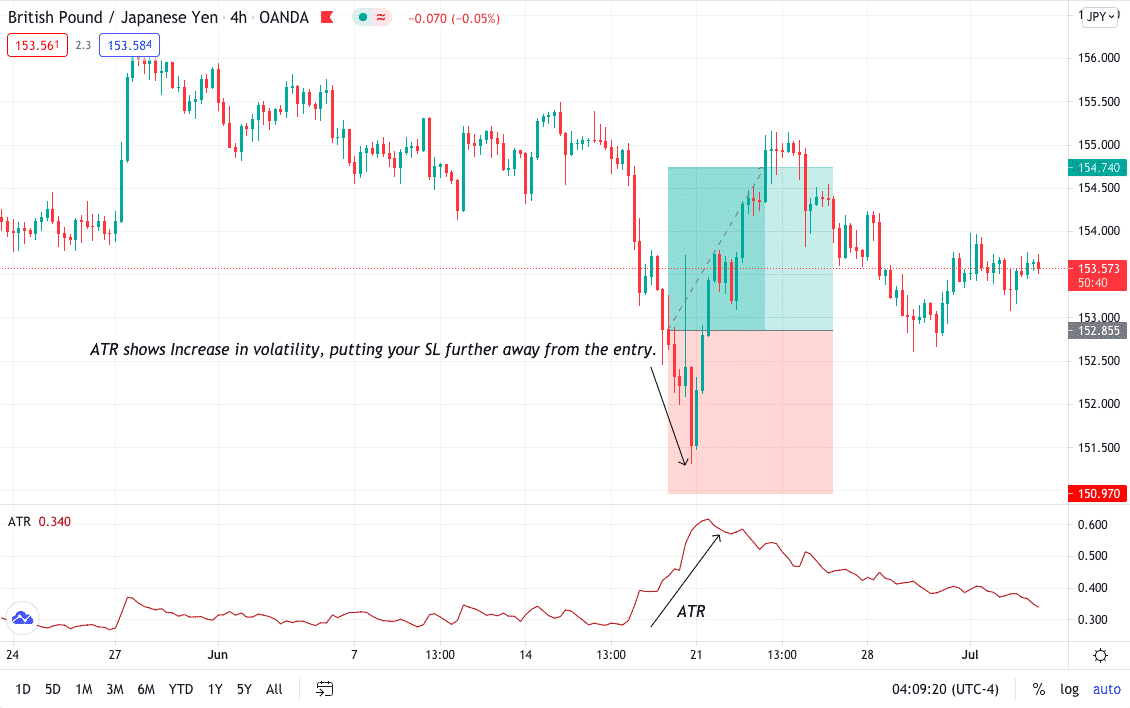
The true average range is an excellent tool to help you decide your stop loss (SL) area. If the ATR is on the higher side, it means the market has high volatility, and thus, the price movement might be more, pushing the market more in one particular direction for a while.
- In this case, you might want to pull your SL further away from the execution price as the market could reverse back quickly, stopping you out before your trade would give you a profitable return.
- In the opposite scenario, you can keep your SL close when the volatility is less.
Using ATR for taking profits
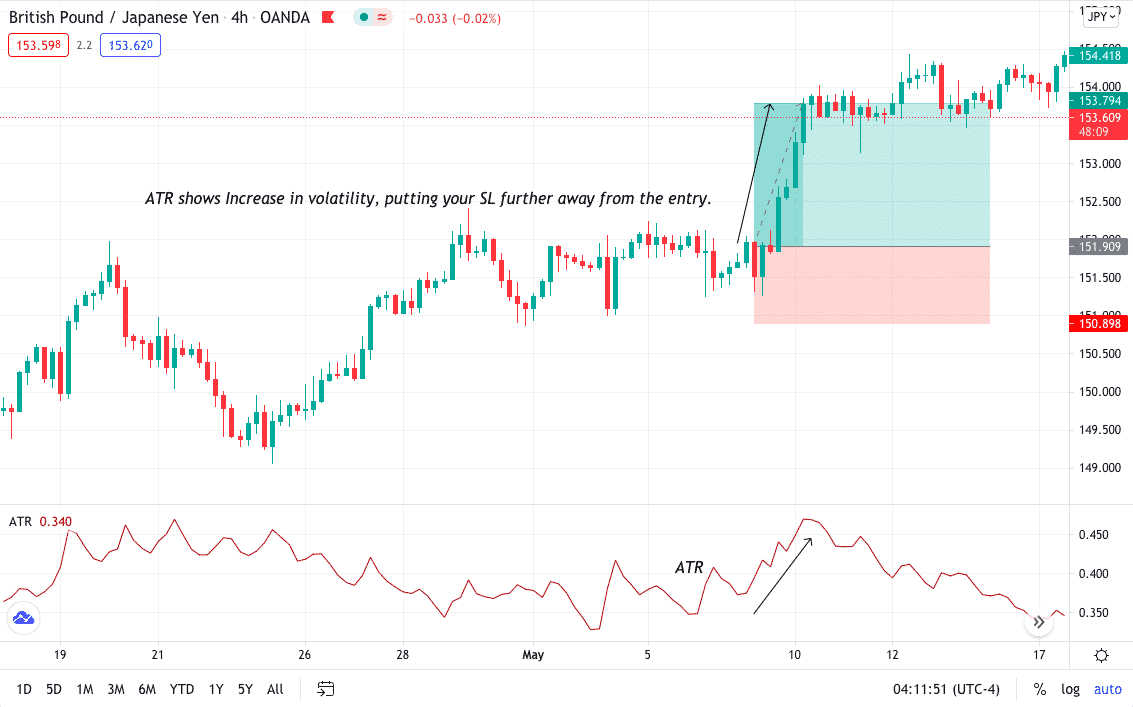
As you saw, you can reduce your losses with ATR; you could also use the indicator to place your “take profit” in the right place. With this indicator, once you have the volatility, you can have a more comprehensive take profit if the market has high volatility and a tight “take profit” if the market’s volatility is less.
Trading reversals and continuation using the ATR
You might be using different strategies to trade, but adding an ATR tool will make your trading setup more accurate. Let’s look into a strategy that will show how you can trade using the ATR tool.
- Select the ART from the indicator window.
- Add an SMA of period 200 into the ATR window.
- When you have your trade setup ready, signifying that the market will reverse or continue after the break of support or resistance.
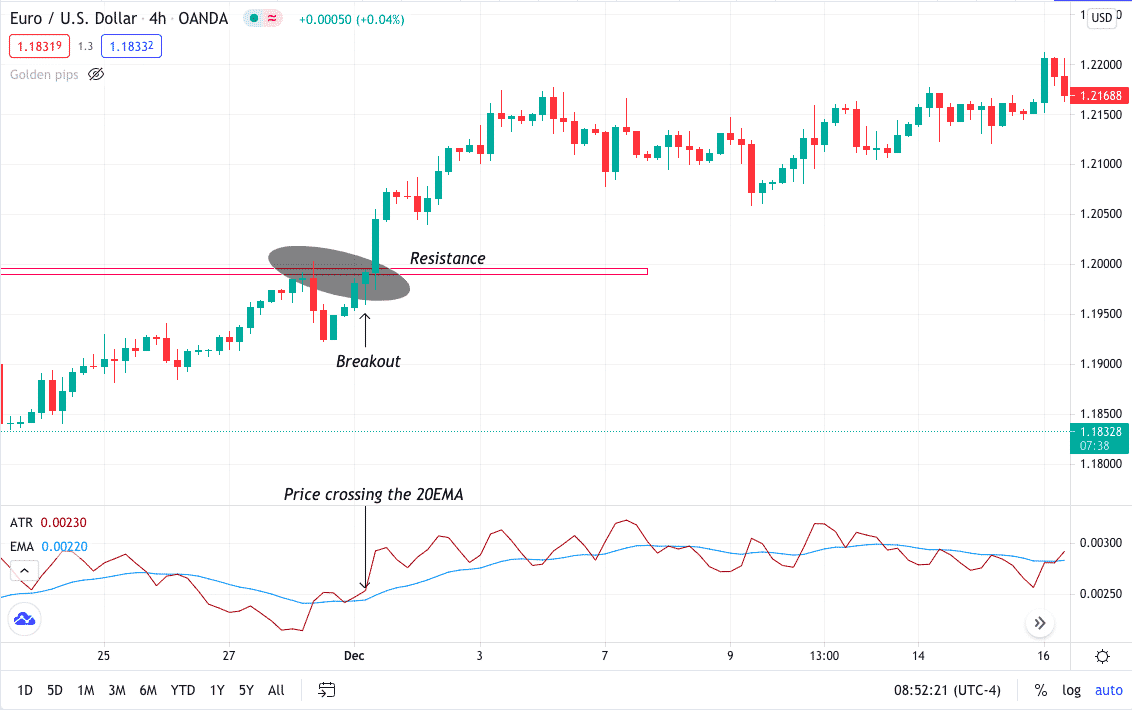
- Once you see the break is successful, you can check if the ATR is crossing the SMA showing a significant move.
Below is the trade setup of EUR/USD 4hr time frame. The price was staying under the resistance, but then there was a rise in momentum and resistance break. At the same time, you can see the ATR crossing the SMA moving up, giving you an excellent signal to buy.
Limitations of using ATR
The ATR is a phenomenal technical indicator for modifying and adapting to changing market conditions, but it also has some limitations. The true average range is open to analysis; that is, the ATR values will not tell you the market’s direction and when it is going in reverse. Also, you can only use it in addition to a strategy.
Final thoughts
ATR is a powerful tool that can be used as a simple swing trading tool and a stop loss safety precaution. The real strength of ATR lies in its ability to judge “market madness” and “market calm.”
An indicator is a versatile tool. It can be used to confirm entries and to confirm a stop loss. Large ranges accompany large movements. Major trading theories applied to this concept as well.
For example, the Elliott Wave Theory states that for every big move (impulse wave), the market has two ranges and two corrective waves. An indicator such as the ATR helps to identify them. Volatility will decrease significantly. When the new wave starts again, volatility increases, and the ATR formula will output higher values.
That’s why it was created in the first place. Traders usually use many different concepts of technical analysis to predict future prices. Thus, traders use the indicator to check the previous analysis. But if they need a tool to confirm the setup, this indicator will do the trick.
Combining ATR indication with price action will help you understand when the market could respect the support, resistance, trendline, and when it will break out.


