The moving average (MA) is probably the most popular indicator among technical traders. There are at least two reasons why this is so:
- First, the MA can quickly tell you if there is a trend or not. All you need to do is to look at the slope of the moving average. If the line is sloping up or down, the underlying market is trending. If the line is flat, then you are looking at a ranging market.
- Apart from determining the existence of a trend, the MA can also tell you the trend’s strength. This is the second reason. If price trends and stays above or below a short-period moving average, that indicates a strong trend. Later you will learn which period is best for this purpose.
One frequently asked question is which period is best. Is it the 8, 50, 100, or 200 period? The answer to this is simple. There is no one best period for MA. You can use the period that suits your trading method. If you day trade, use a short-period MA. If you swing trade, use a long-period moving average.
Best types of moving averages
You can find various types of moving averages anywhere online. The family of MA’s has gotten big, and many more are being added continuously. This article will not attempt to tell you which type of MA is best. But, again, that is a topic with no one correct answer.
Instead, we will present the most popular types. Then, you will get to know about the seven moving averages we think are best. The table below shows these seven most widely used moving averages, with their abbreviations and descriptions.
Type | Shorthand | Description |
| Simple | SMA | It gives equal weight to all candles, resulting in a smoother curve but a slower reaction to price changes. |
| Exponential | EMA | It gives more value to recent candles, resulting in a quicker response to price changes. |
| Smoothed | SMMA | It shows the trend clearly by removing short-term fluctuations. The SMMA curve is smoother than the SMA line. |
| Linear weighted | LWMA | It gives more value to recent bars, allowing it to stay close to price compared to other moving-average types. It is more responsive than the EMA. |
| Hull | HMA | This type responds quickly to price changes but maintains a smooth line. It is closer to the price than the LWMA. |
| Arnaud Legoux | ALMA | The line looks exceptionally smooth, even smoother than the HMA. It is best used for trend reversal, that is, when the price crosses above or below the line. |
| Tillson | T3MA | This is an improved version of EMA. It is smoother but closer to the price than ALMA. |
The best type of MA depends on the trader. It is a personal decision. Some may say the HMA is best, while others claim that ALMA is better. Only you can decide which one is best as you begin to use them in your trading.
Two powerful moving averages
Now we will talk about two different periods of moving averages whose tandem is potent.
The first one is 20 period, and the second one is 100 period. Each one is effective in its own right. However, when you combine the two, you can create a robust trading system.
20-period moving average

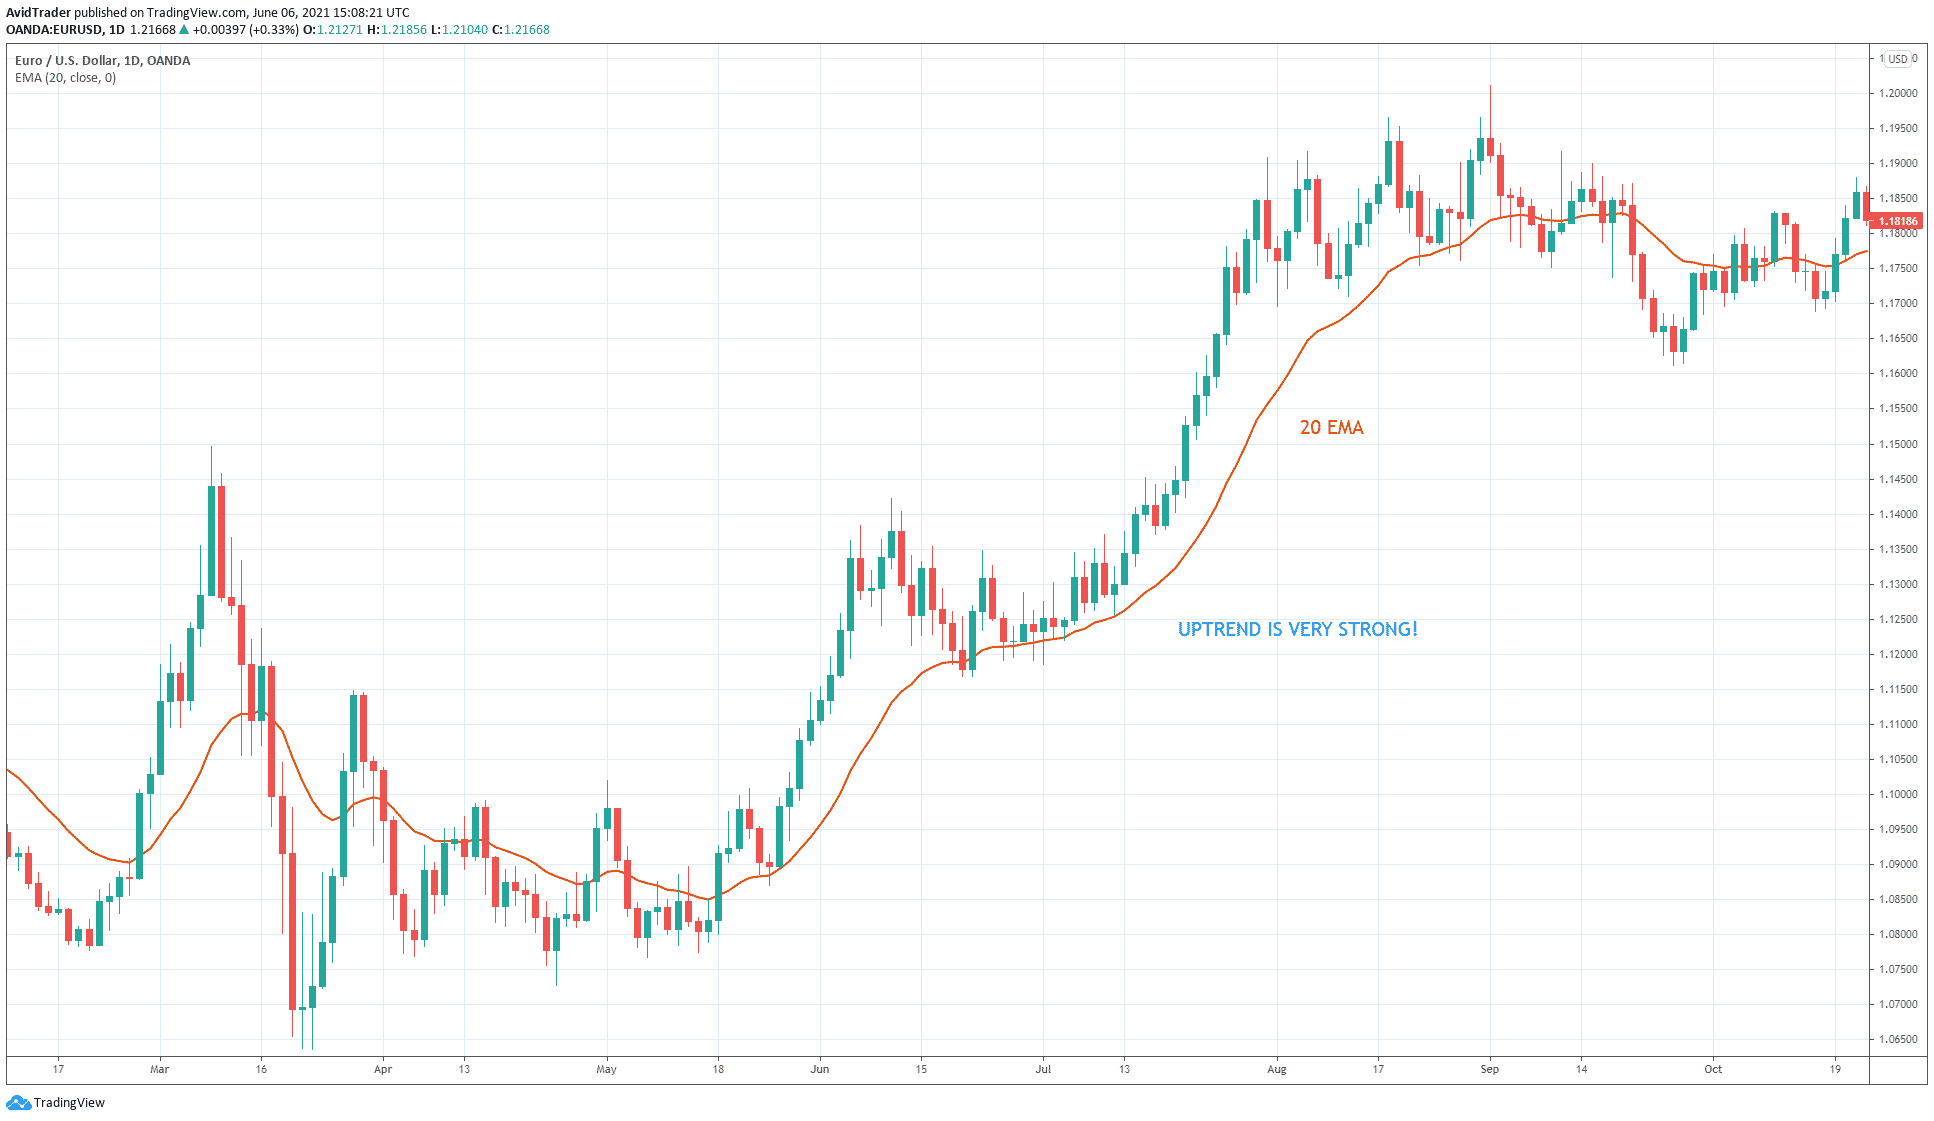
The 20-period MA can gauge the strength of a trend. If the price moves in one direction and does not violate the 20 MA, it means the trend is powerful. In this market condition, you can ride the trend by entering a position whenever the price touches the 20 MA.
Consider the above EUR/USD daily chart. So starting from the middle of the chart, the trend is strongly bullish because the price stayed above the 20 EMA. Seeing this trend, you can muster a strategy that will allow you to join the decisive rally.

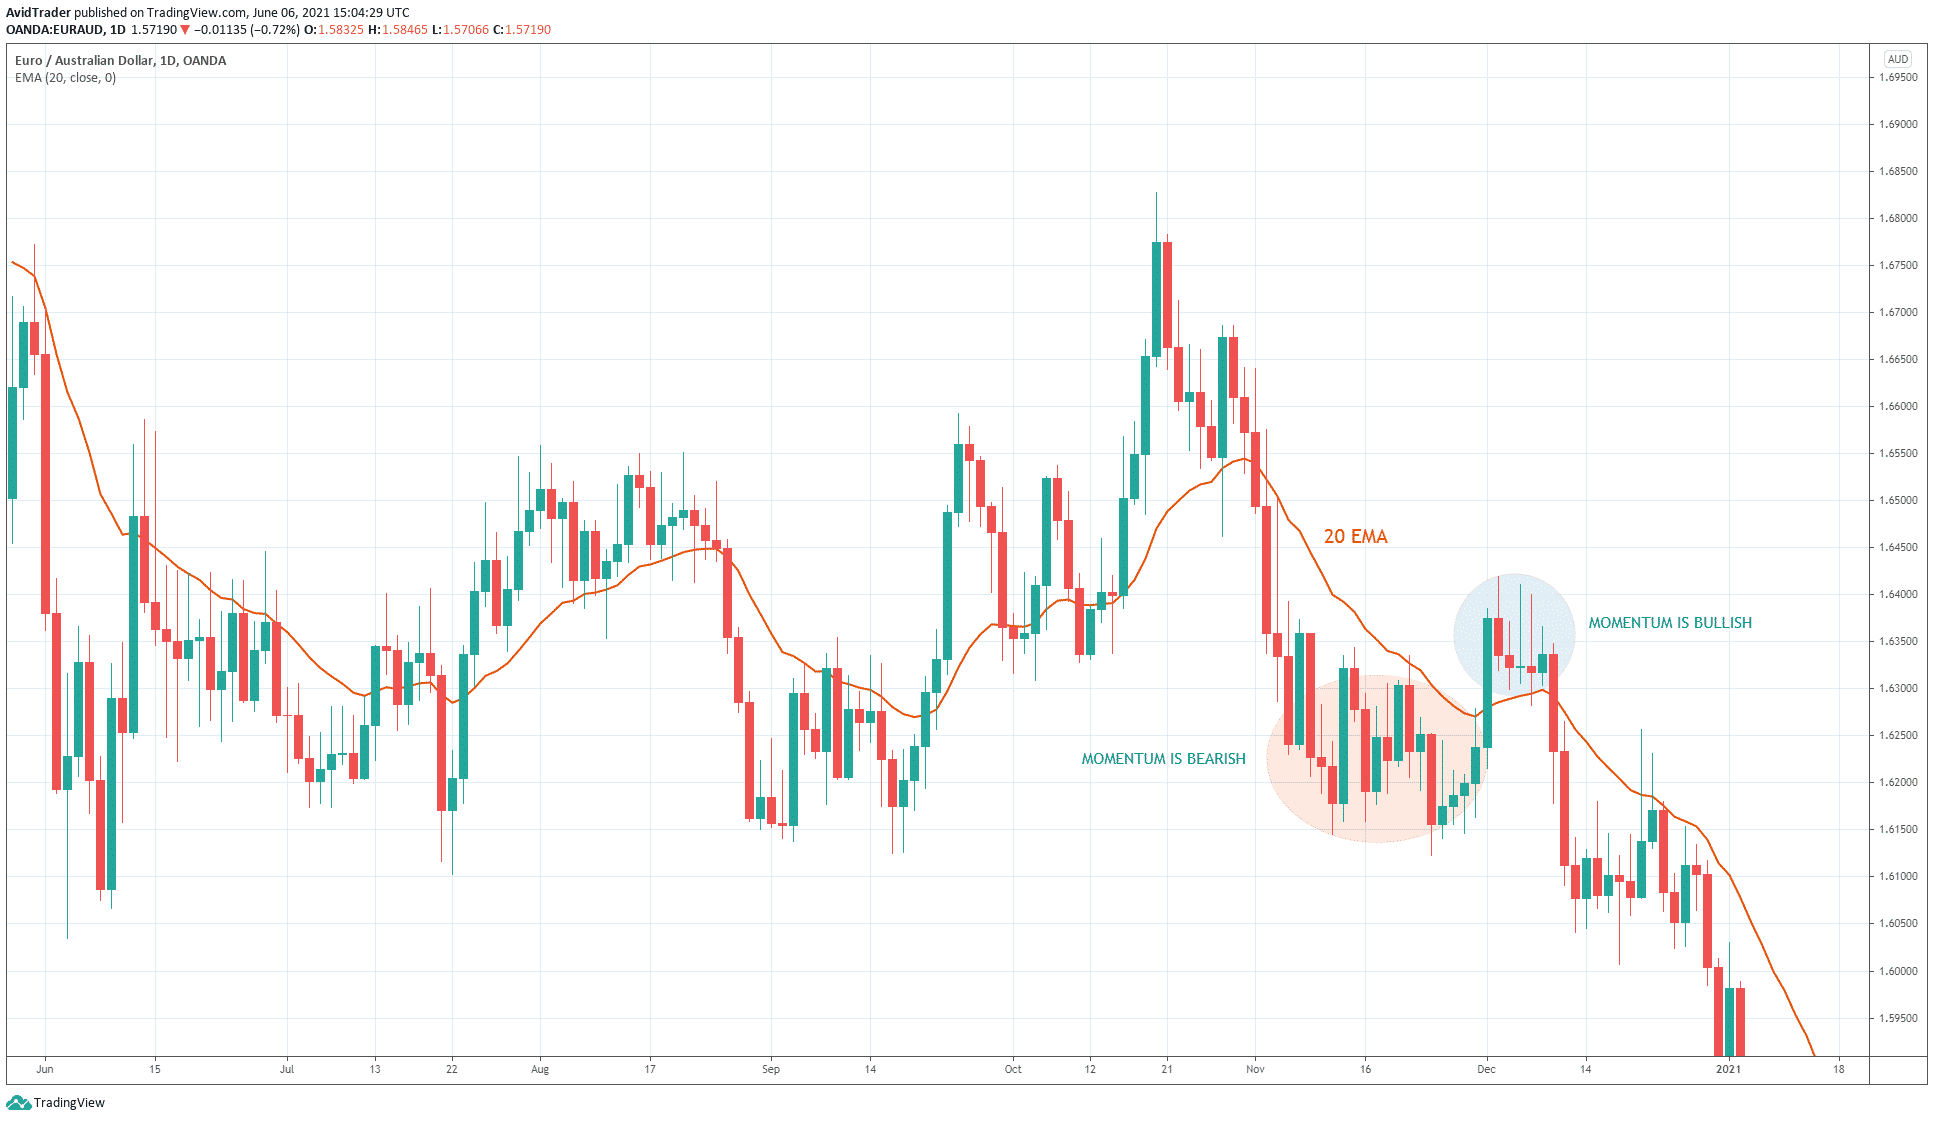
You can also use the 20 MA as an indicator of momentum:
- If the price is below the 20 MA, consider the momentum bearish
- If the price is above the 20 MA, consider the momentum bullish
Refer to the above EUR/AUD daily chart for guidance.
In this part of the discussion, think of momentum as a distinct concept from a trend. Then, of course, you might say they are the same thing. But for this discussion, consider the two ideas different from this point onward.

100-period moving average
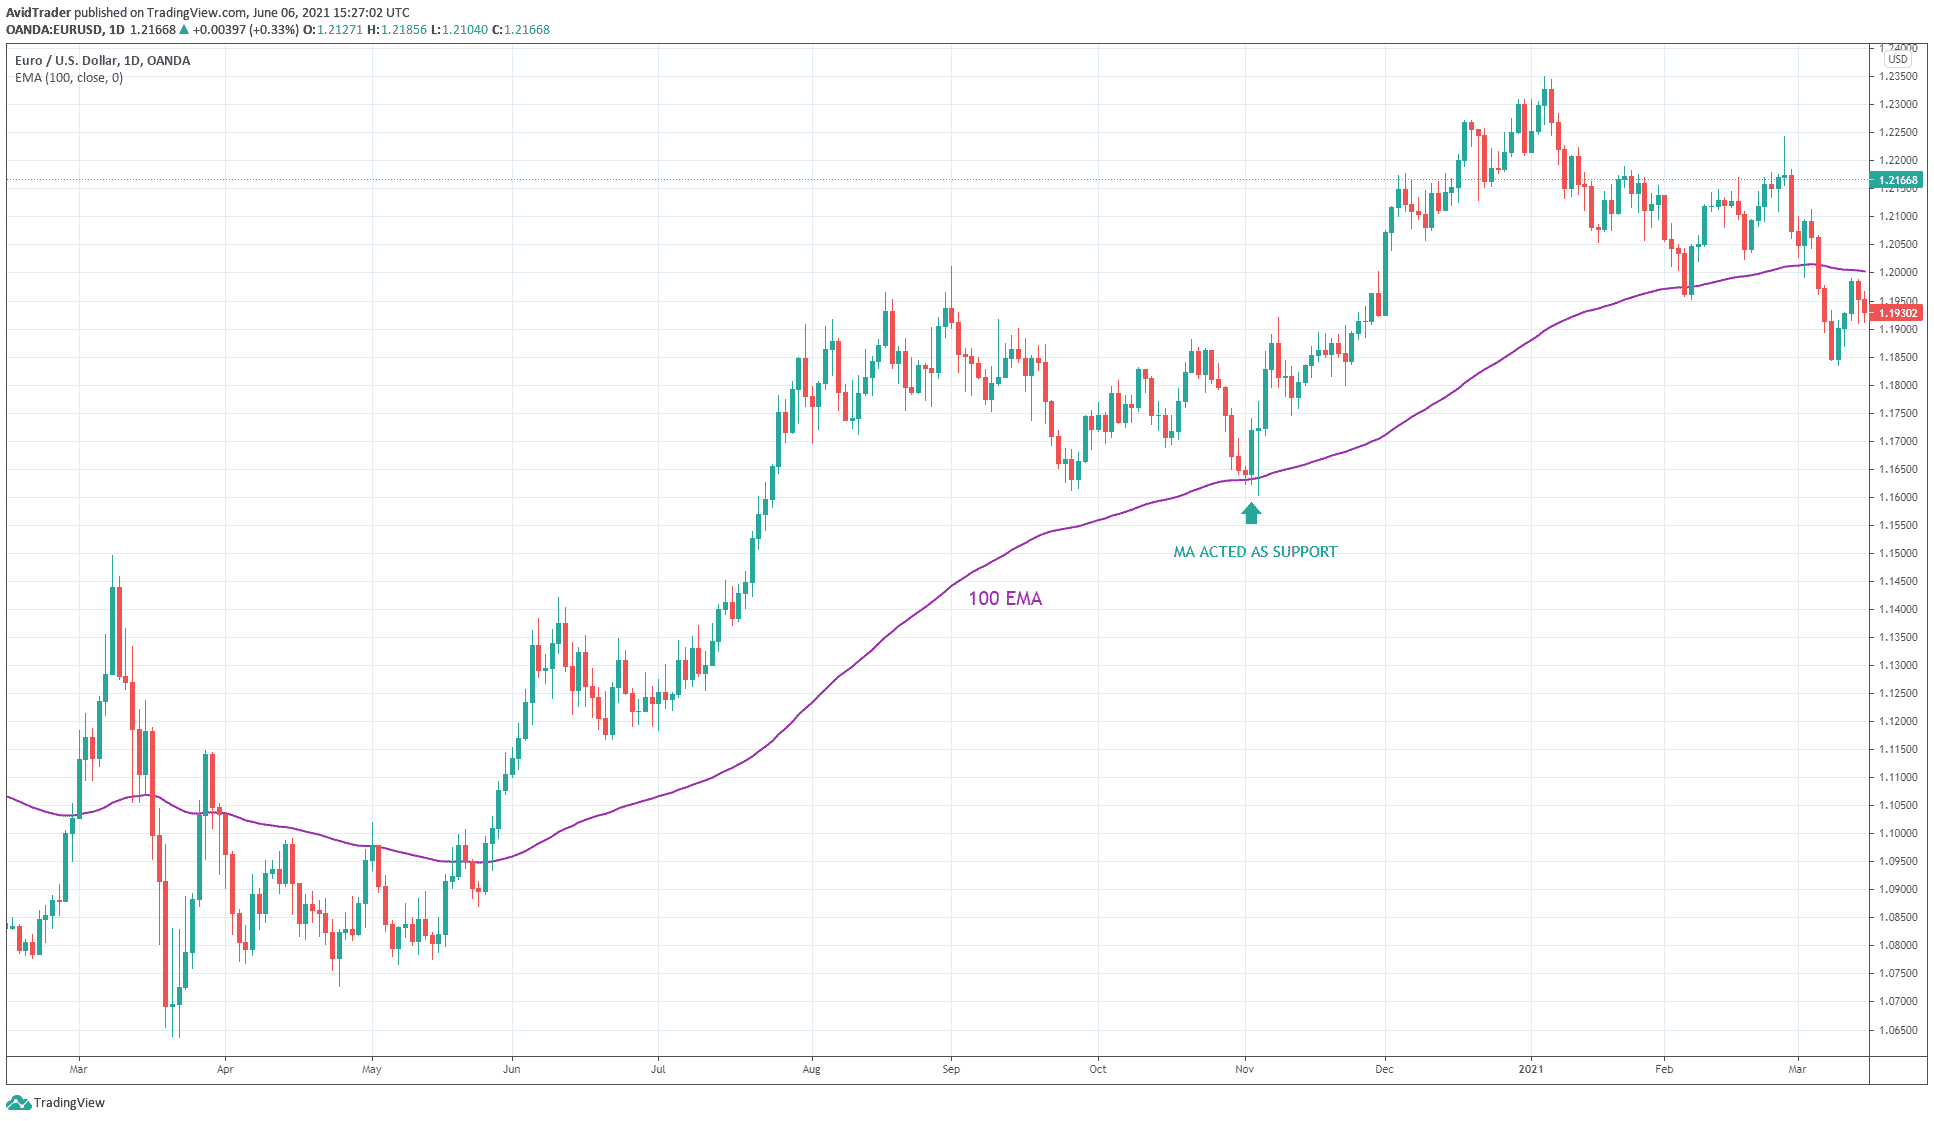
You can use the 100 MA primarily to define the dominant trend of any timeframe:
- If the price is above 100 MA, the trend is bullish
- If the price is below 100 MA, the trend is bearish
In addition, 100 MA can be used as dynamic support and resistance. For example, if the price is above 100 MA and goes down to test the 100 MA, the moving average may act as support. As a result, the price may bounce and continue the uptrend. This is precisely the situation in the above EUR/USD daily chart.
Best moving-average tandem
As already mentioned, the best moving-average duo is the 20 period and 100 period. You will learn why shortly. We will share with you a powerful strategy utilizing this combination. In this strategy, we will use 20 EMA and 100 EMA. You can use any type of MA, such as simple, smoothed, etc.
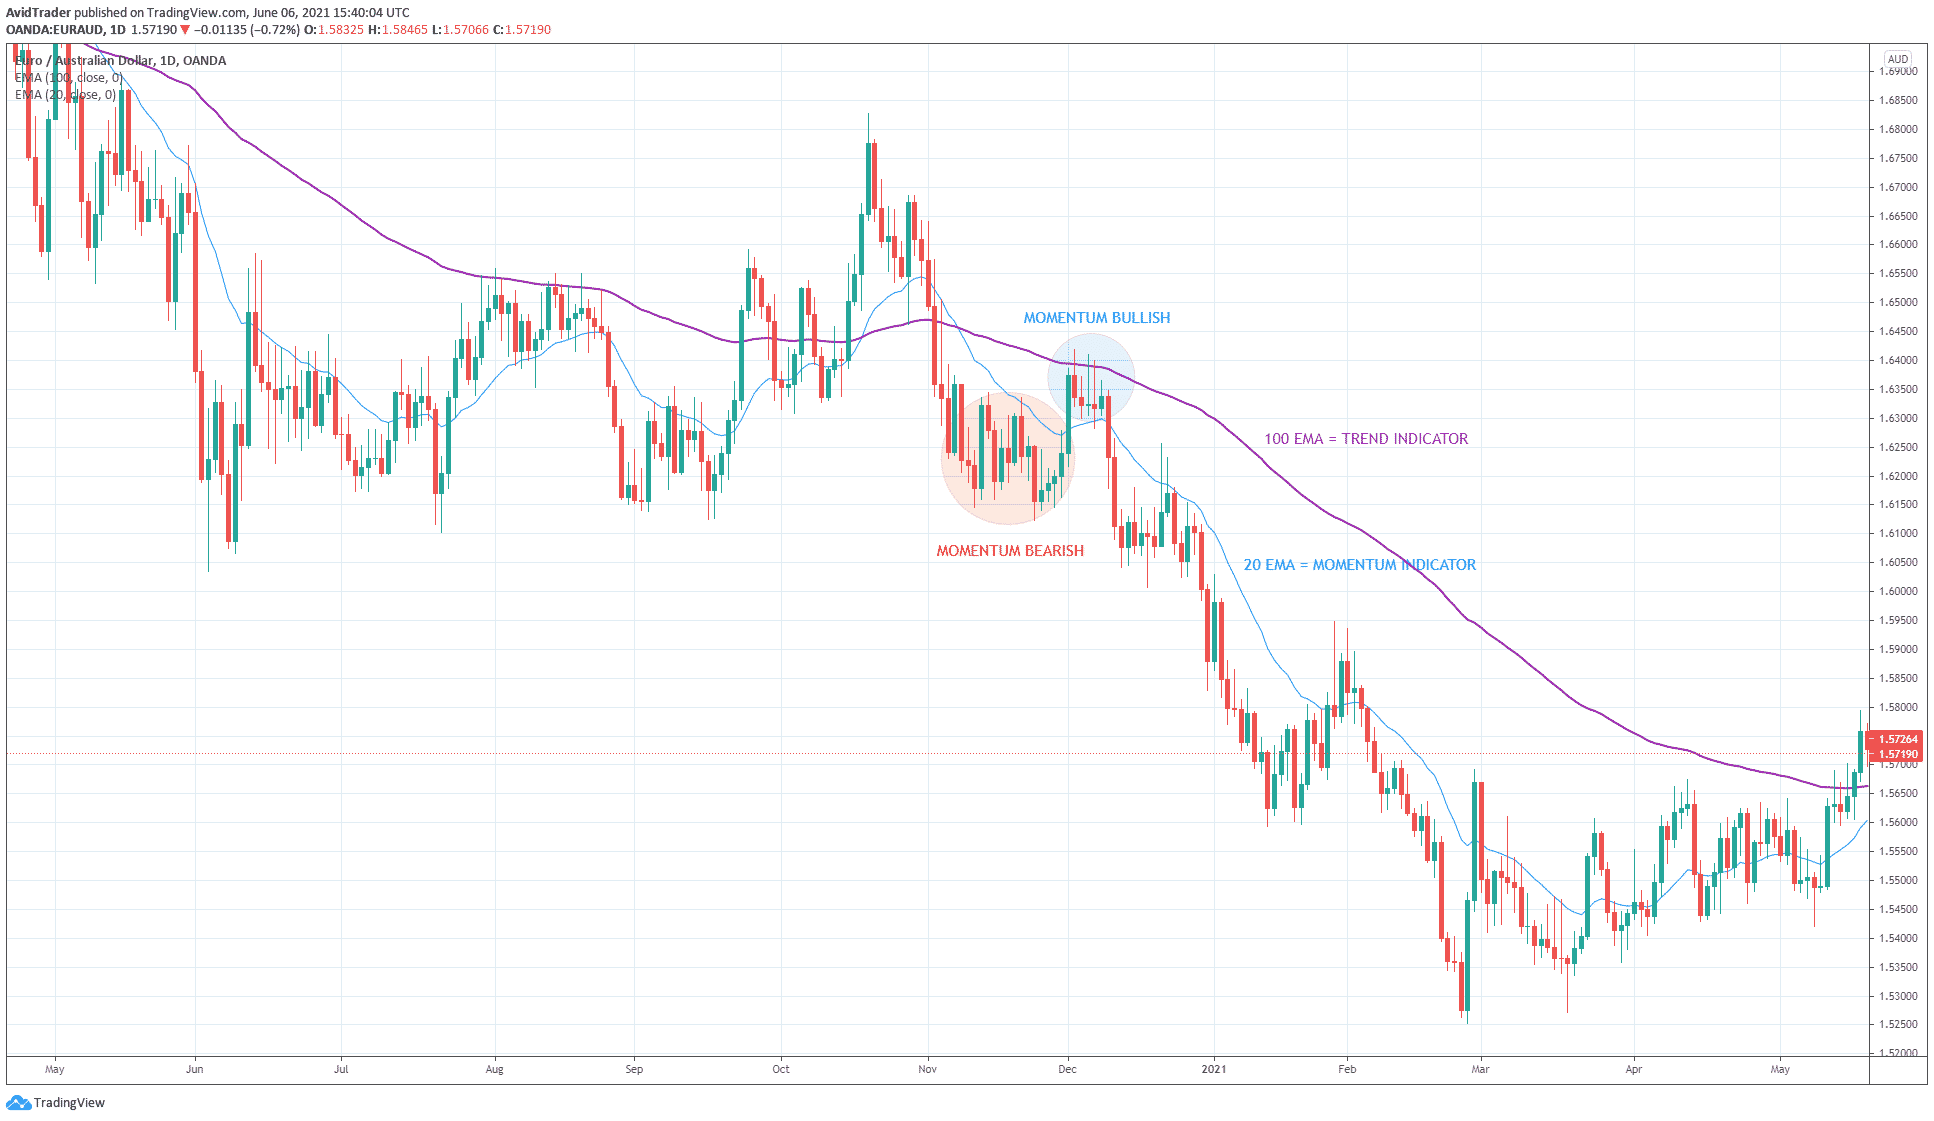
We will use the 20 EMA as a momentum indicator and the 100 EMA as a trend indicator. This strategy is straightforward. We will open a trade when the two indicators give a signal pointing in the same direction. To improve the trade success, we need the price to make a pullback first.

Let us use the EUR/AUD daily chart above to illustrate the strategy.
- In the part of the chart shaded in orange, momentum is bearish, and the trend is down.
- However, we will not open a sell trade yet because we do not have a pullback.
- Next, the price entered the chart area shared in blue. At this point, the trend is down, but momentum is bullish.
- Therefore, no entry is taken because the two indicators are not aligned.
- The sell entry came when the price breaks and closes below the 20 EMA.
- A sell entry is taken since the momentum is now bearish, and the trend is bearish.
In addition, the price made a pullback already. You can find a lot of setups like this in your charts. You can use the same technique in taking buy trades.
Final thoughts
This is how you can use the MA both as a momentum and trend indicator. Just use different periods. The sample trade above is the classic pullback strategy. It is a simple strategy that you can apply straight away. To avoid significant losses, make sure you test out this strategy in a demo account or even a small live account.


