Among the most well-known technical tools is the Donchian Channel (DC). It acts as a powerful indicator for futures traders and commodities traders alike. Using Donchian channels for trading is explained here, along with how they are calculated.
Traders can identify specific retracements and breakouts using DC as technical indicators.
You can also utilize DC through candlestick charts alongside line trading graphs. Consequently, the DC gives away facts, and a specific signal of trading can be taken advantage of quickly as a result.
What is the Donchian Channel trading strategy?
The breakouts and retracements within these channels allow us to identify certain potential trends. Computation over moving average consists of three-channel lines, part of a technical indicator used to predict asset price trend ups and downs.
Richard Donchian is the developer behind the tool for recognizing the pricing actions in futures/commodities markets in the 1950s.
Candlestick charts give away a clear or s simple display for the traders. However, the trading indicator can generate mixed signals by monitoring the prices of assets, including currencies, shares, and commodities.
How to calculate Donchian Channels?
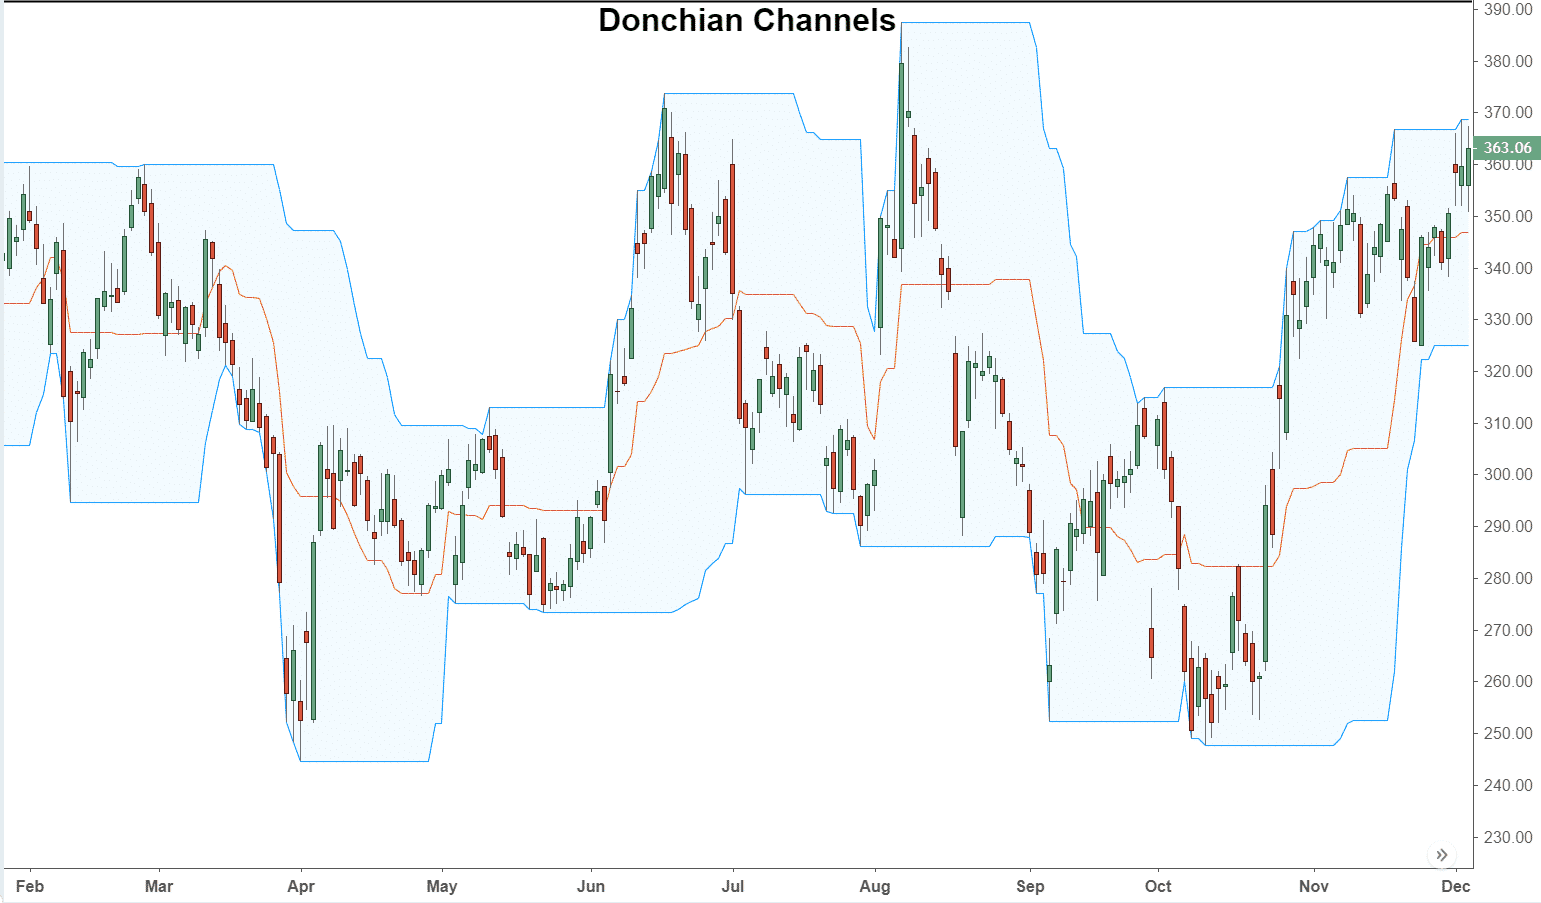
A calculation of the Donchian Channels is fundamental to determining the upper, middle, and lower bands. MT4 and MT5 trading platforms allow you to formulate DC with just a click.
But if you need to calculate bands by yourself, the following formula works:
- Upper band: highest high in last n bars
- Lower band: lowest low in last n bars
- Middle line: ((upper band – lower band)) ÷ 2)
Typical abbreviations for “N” are minutes, hours, days, or months. It would help if you considered the time frame when determining the N.
As a reference point for computing DC, some traders use a maximum of 20 days as a period.
How to trade with Donchian Channel?
This channel works by showing market momentum in three bands. For example, the top band shows the highest high from the previous period. Meanwhile, the bottom band marks the lowest low of the prior period. In other words, the central band is the ratio between a specific trading period’s low and high.
Investors use DC to map the momentum of underlying markets, and they enter a short or long position depending on the signals the channel provides.
Low volatility may be affecting the market. There may be no evident bullish or bearish trend in an asset trading around the centerline.
Traders might open a buy position if the market trends upwards after touching the lower band and profit from the price increase. A trader who wishes to profit from a fall in the market value will open a sell position when the market momentum is trending downward.
Bearish trade setup
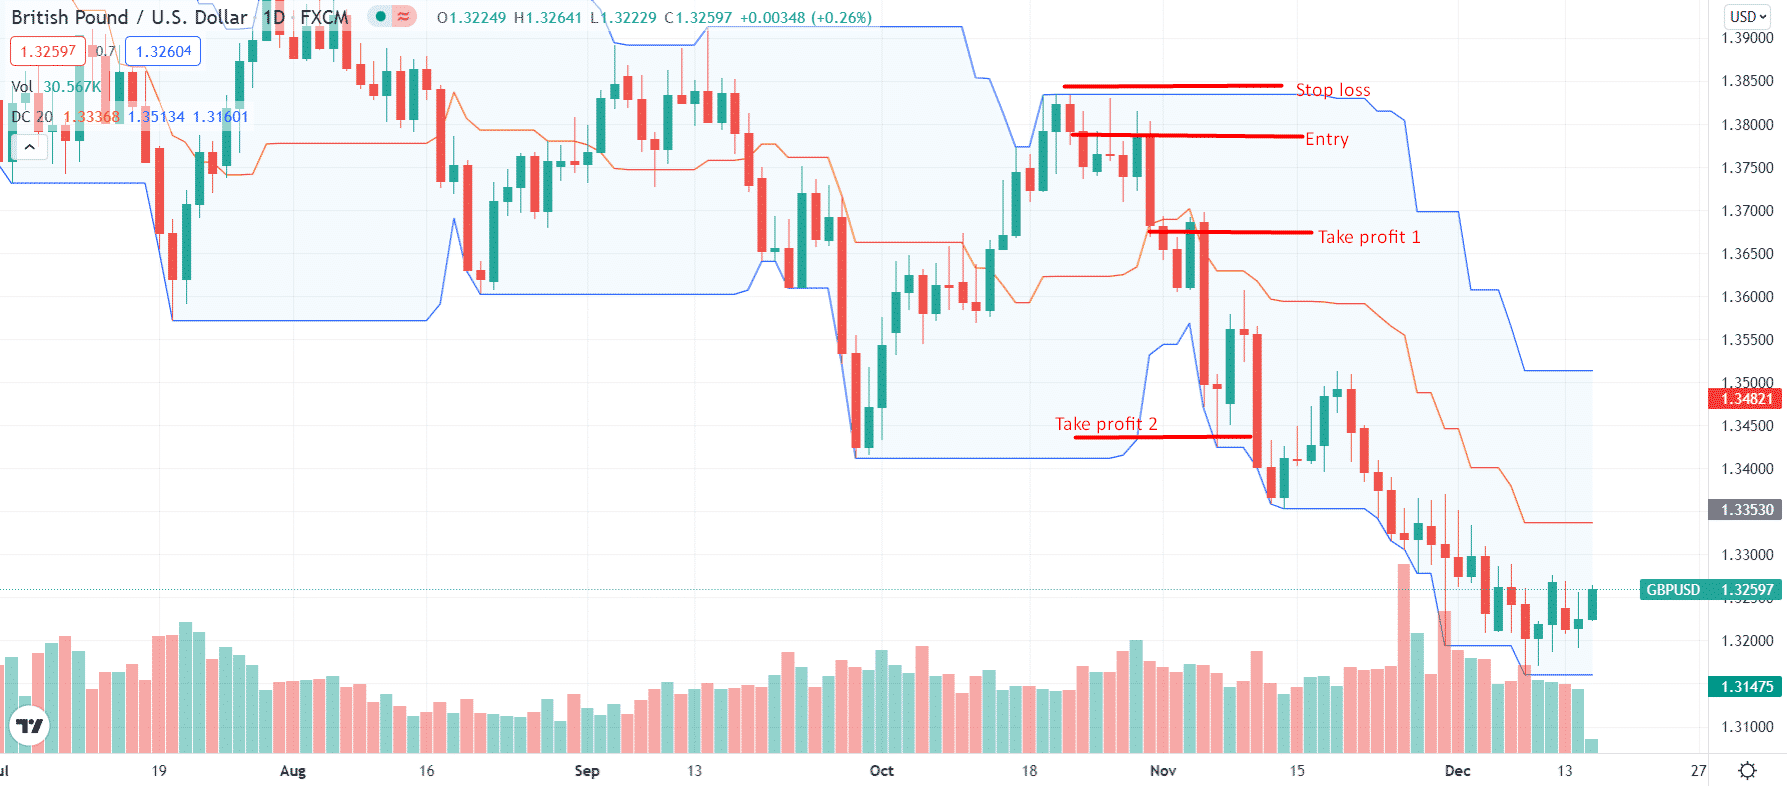
Let’s take a look at the bearish trade setup using the momentum tool.
Entry
Look at the chart above. It shows the entry point when the price hits the upper band and gets rejected. Always enter when a bearish candle appears and closes near the upper band.
Stop loss
Place the SL just above the upper band. For example, if there is a strong rejection candle, then better to place the stop loss above the high of the candle.
Take profit
You can place the take-profit order at the middle or lower bands. It depends on your risk appetite.
Bullish trade setup
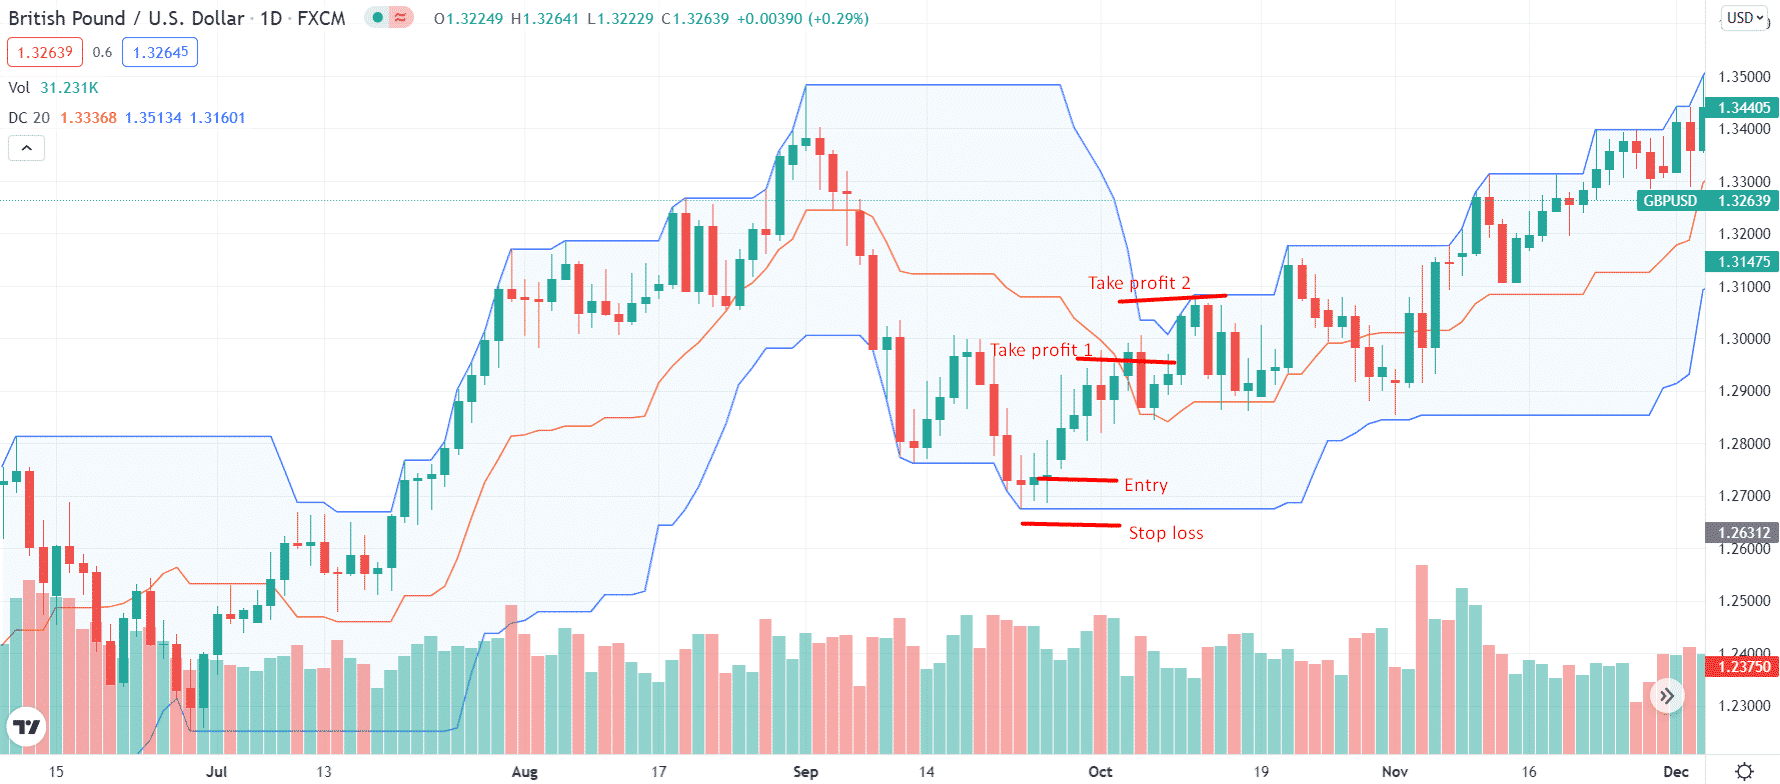
Now let’s explore a bullish trade setup using the momentum tool.
Entry
You can enter a position when the price hits the lower band, fins rejection, and move upwards. Always wait for a bullish candle to close. In the case of a pin bar, you may enter on the bearish candle close provided, the candle has a long wick on the downside.
Stop loss
Place the SL slightly below the lower band or below the recent local lows.
Take profit
Place the take-profit order at the middle or upper bands.
How to manage risks?
Let’s explore managing risk while using the DC in trading.
Pay attention to the time frames
It is more suitable for intraday and day trading on 15-minute, 30-minute, and hourly time frames. However, higher timeframes are also suitable but only for the swing traders. Hence, the risk and reward should comply with the applied time frame.
Wait until the price starts to crawl alongside the upper line
To trade the channel, you must wait until the price moves towards the upper line of the channel. Make sure the price does not drop below the median or centerline during this period. It is apparent from the price’s adherence to the upper side of the channel that the bullish momentum is strong.
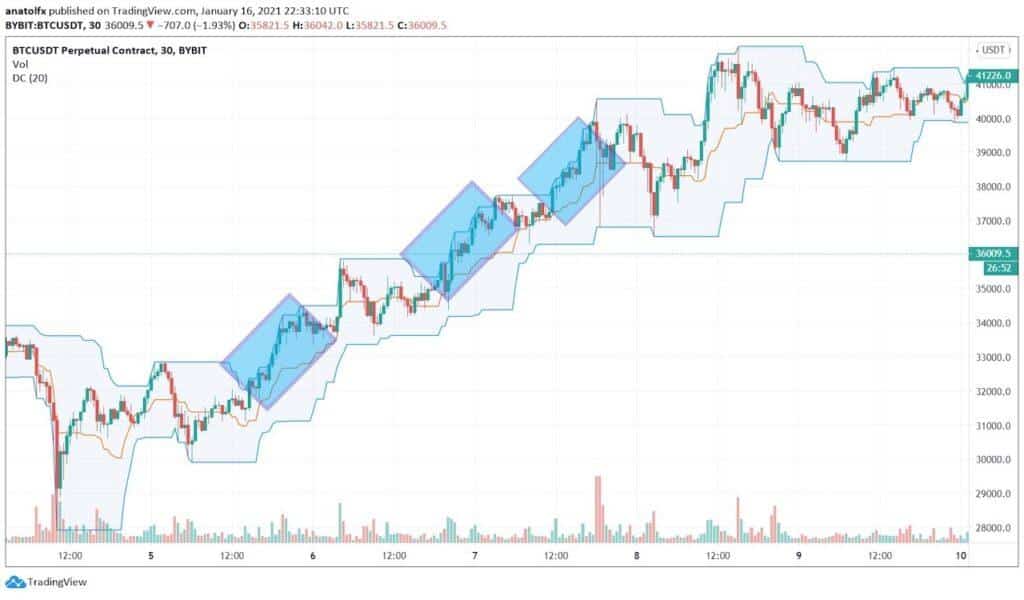
Setting up the stop loss
Placement of stop-loss orders is an important risk management step. If the price moves against you, you can prevent further losses. You can place stop losses using the upper and lower bands.
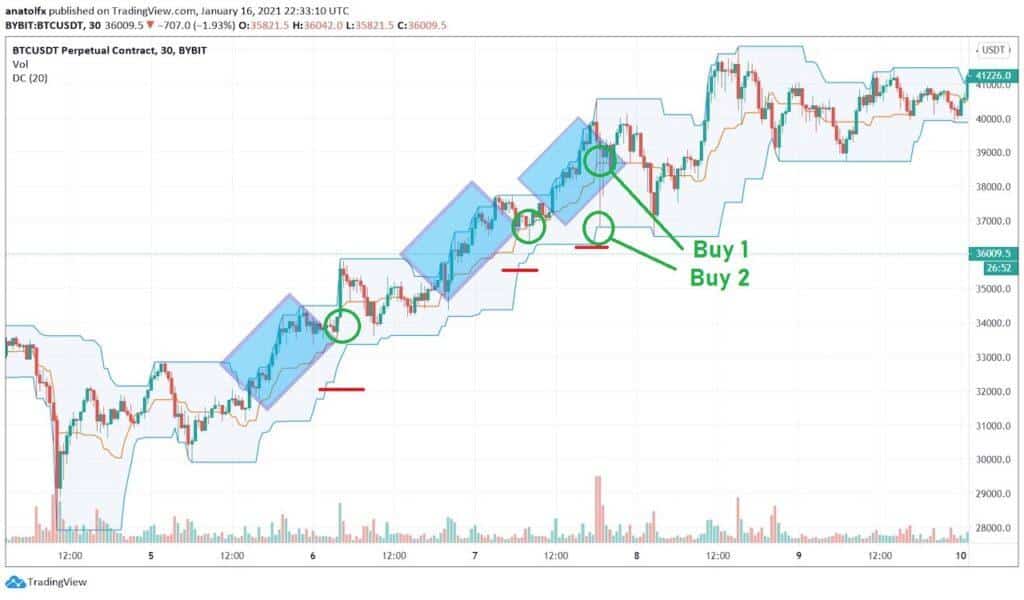
Managing positions
You can open a long position whenever the price starts to pull back towards the central line. Once the price retreats further towards the lower band, you need to open a second long order.
Final thoughts
After reviewing this overview, it is clear that the Donchian trading strategy is a unique system to identify intraday trading trends based on significant risk to reward ratios.
Trading this strategy is also a form of intraday strategy, in which it highlights some simple rules to gain some excellent profits from trading. It also includes a few universal trading truths that traders can incorporate into their current trading strategies.
