Let’s draw an analogy and compare making a house to trading.
You won’t use screws and hammers, nor would you use a shoe to hit nails.
Every task has a specialized tool for a particular environment. Similarly, trading has a sure technical indicator that fits a specific situation.
So, the more tools you learn, the better you become adaptive to different market environments. But, even if you master a few tools, it’s still great. For example, it’s good to have an expert plumber to install pipes and water systems.
Similarly, as there are several variant ways to catch some pips, it’d be cool if you are a BB specialist.
What are Bollinger Bands?
John Bollinger developed a technical indicator to measure the market’s volatility and identify the market’s potential oversold and overbought condition.
The tool tells you whether the market is loud or quiet:
- Band’s expand when the market is loud
- Band’s contract when the market is quiet
The Bollinger Bands are displayed over the price on the chart. That’s why it is categorized as a chart overlay indicator. For example, look at the chart below.
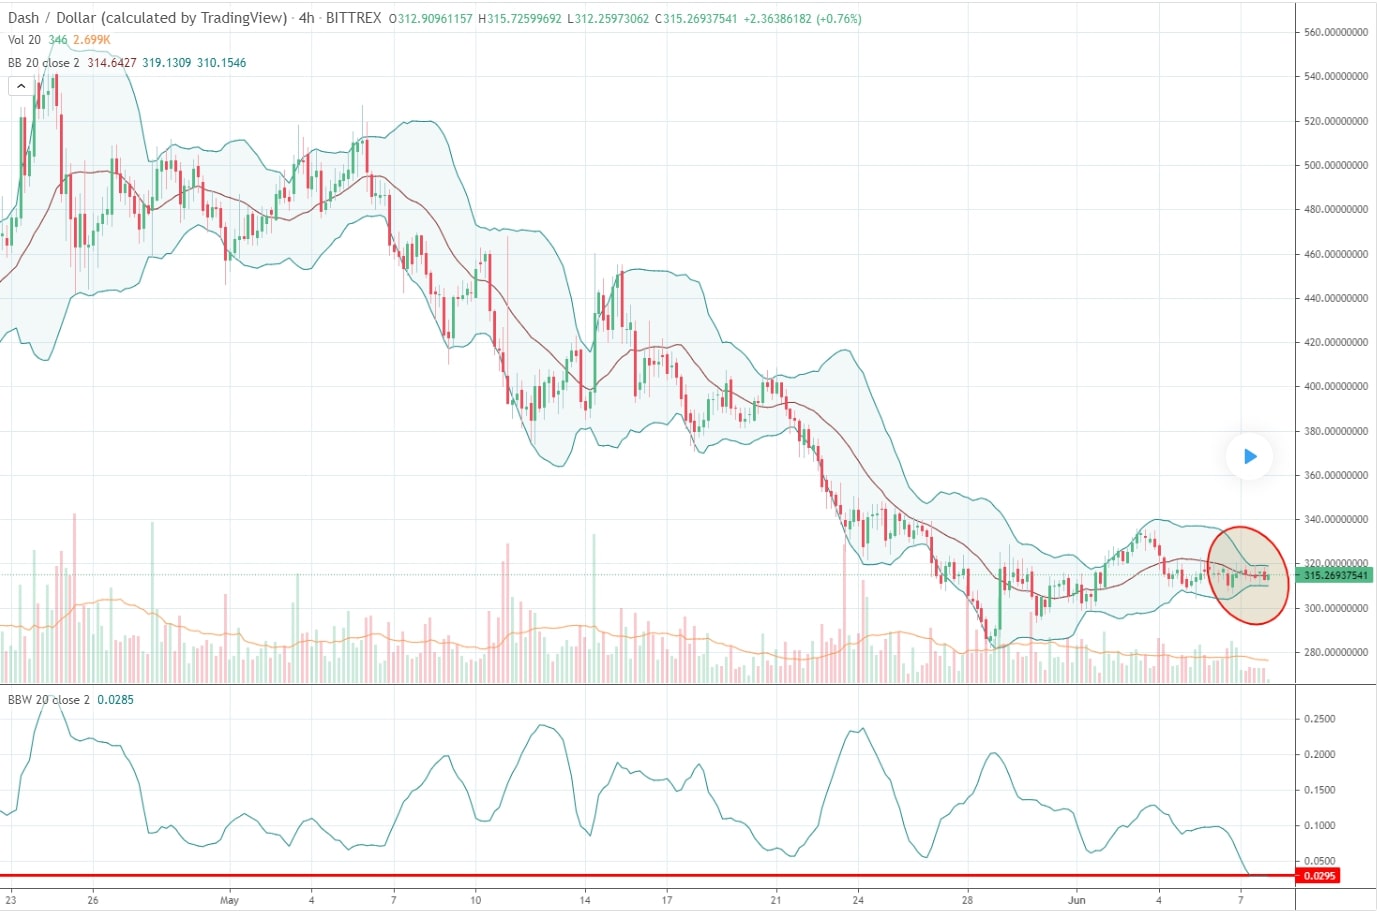
Just observe, the bands squeeze when the price is quiet, and the bands spread apart sharply when the price finds an uptrend or a downtrend.
The lower and upper bands measure the volatility or extent of variation of price concerning time. Since this indicator measures volatility, the bands automatically adjust themselves according to the market conditions.
History and calculation of Bollinger Bands
John Bollinger developed the indicator using a formulaic method in the 1980s for financial traders. The purpose was to help traders in making decisions as part of their technical analysis.
The indicator chooses two independent input parameters to run on the historical price data. BB uses N-period moving average while the upper and lower bands use D times the standard deviation.
Typical formula to calculate the Bollinger Bands
| ML = SUM (CLOSE, N) / N = SMA (CLOSE, N) | TL = ML + (D * StdDev) | BL = ML – (D * StdDev) |
| The top line (TOPLINE, TL) is the exact middle line shifted up by a certain number of standard deviations (D). | The bottom line (BOTTOM LINE, BL) is the middle line shifted down by the same standard deviations. | SUM (…, N) — sum over N periodsCLOSE — closing priceN — the number of periods used for the calculationSMA — Simple Moving AverageSQRT — square rootStdDev — standard deviationStdDev = SQRT (SUM ((CLOSE – SMA (CLOSE, N)) ^ 2, N) / N) |
The basic principle of Bollinger Bands
Typically, the BB indicator has three lines:
- An upper band
- A middle line
- A lower band
The midline of BB shows a Simple Moving Average (SMA). By default, the value of SMA is 20 periods. However, you can customize the value and experiment with the tool.
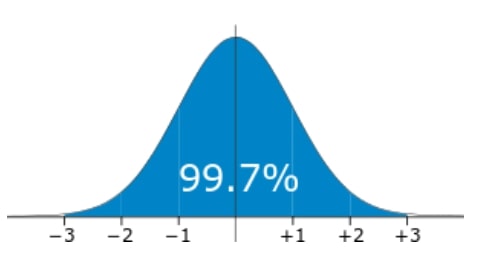
The lower and upper bands of the indicator are based on standard deviation (SD). The standard deviation measures the degree of spread out of numbers.
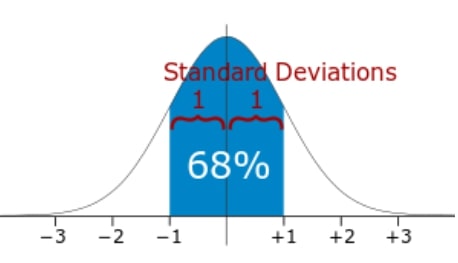
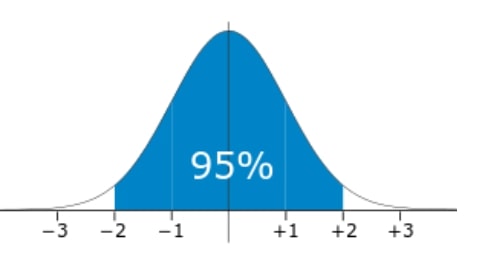
| If the lower and upper bands had SD 1, 68% of the price movement that recently occurred remained within the bands. | Similarly, if the lower and upper bands have SD 2, 95% of the recently occurred price movement remained within these bands. | You can see that the higher value of SD helps in capturing more prices within the bands. You can try different values of SD once you are familiar enough with the tool. |
 |  |  |
How to use Bollinger Bands in trading?
Let’s discuss a couple of trading strategies using BB.
The Bollinger Bounce
The price usually tends to return the midline of the indicator. This is the main idea behind Bollinger Bounce’s trading strategy. Have a look at the chart below and try to predict where the price will go.
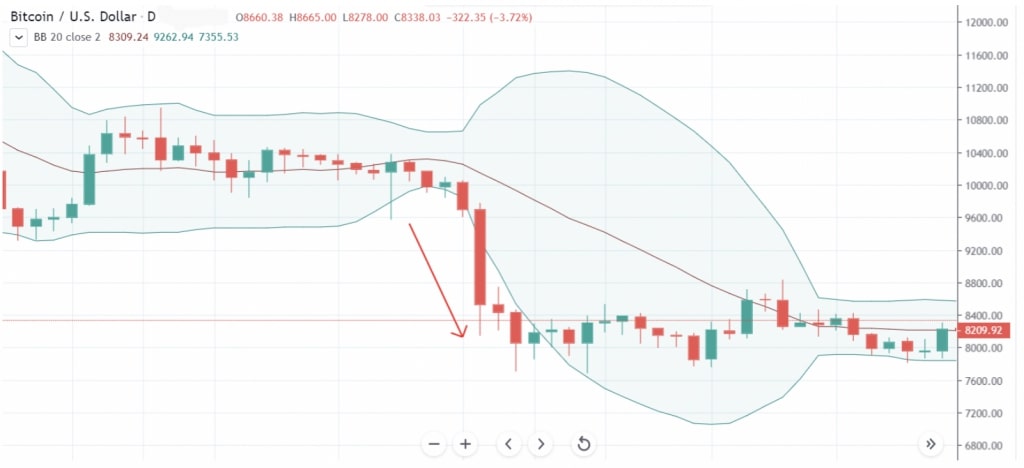
If you said it down, you are correct then. You can see the price is near the lower band and trying to bounce down.
This indicator acts like dynamic support and resistance. Using the longer time frames means more robust support and resistance provided by the bands.
| Entry rules | Exit rules |
| Look for the market when it is ranging and has no clear trend. The contraction of bands indicates it. Enter the long position when the price reaches the lower band while entering the short one when the upper band price approaches. Do not take an entry if the width of bands is expanding because it indicates a trending market. | Exit the position when the BB starts expanding. You can place a stop-loss slightly below the local low or above the local high. You can place the “take profit” near the midline. |
The Bollinger Squeeze
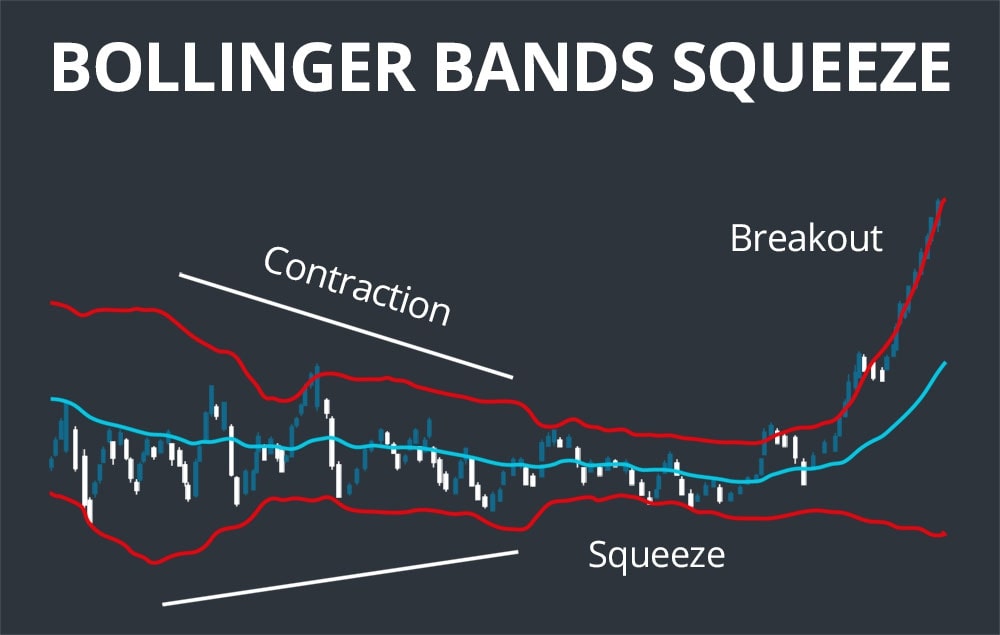
The Bollinger Squeeze is quite a self-explanatory trading strategy. When the bands start contracting, it indicates that a breakout is under preparation. Conversely, if the bullish candle starts cracking above the upper band, the next move is most likely an up move.
Similarly, if the bearish candle starts breaking the lower band, most likely, the price will move to the downside.
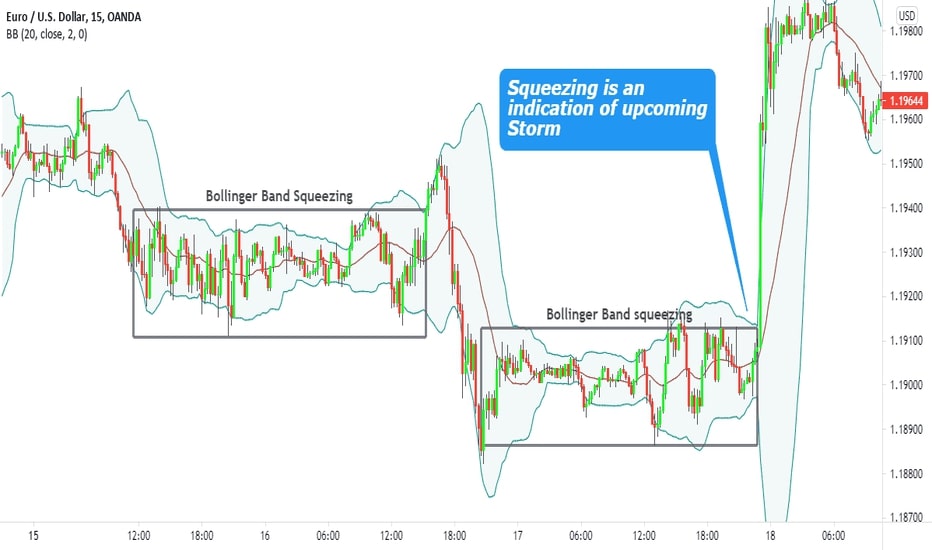
Take a look at the above chart. So you can see squeezing bands. The price tries to crack the lower band. In the given situation, what do you think about the next direction of the price?
If you said it down, you are right again. This is an example of a classical Bollinger Squeeze. The strategy aims to capture the next move as quickly as possible. You will not often see such setups on charts, but you can find a few classic setups o a 15-minute chart in a week.
Entry rules | Exit rules |
| Look for the BB to squeeze.Wait for the upper or lower band to be broken.Enter the long position if the top band is broken. Similarly, enter the short position if the lower band is broken. Do not enter if the price tends to reverse from the bands. | You can place the stop-loss above or below the midline. If you are a conservative trader, you can place a stop-loss above or below the upper or lower bands. You can place “take profit” near the next horizontal level, or you can calculate the stop-loss distance and keep the take profit at the same distance (in the opposite direction). |
Limitations of Bollinger Bands
Like any other tool, BB also comes with certain limitations. First, the indicator is reactive and is not predictive. Therefore, it keeps changing as a reaction to price movement and does not necessarily help traders predict the market. The indicator is lagging. Secondly, the indicator uses a Simple Moving Average. It means that the indicator does not give more weight to the recent data.
Bollinger Bands is a great tool and quite a famous one. You can smartly use it in your favor. However, you may need to test your strategies on historical data or on a demo account to gain more insight into the indicator. You can also add other indicators to add a higher probability of success in your trading.
