Many traders use lagging indicators for finding price courses. Bollinger Bands (BB) is one of them, and many pro traders recognize it. In 1983, John Bollinger introduced and developed the indicator.
The BB shows trend information by combining a moving average with the volatility. You can also use other technical indicators with BB for more accurate signal confirmation.
In this guide, we’ll dig deeper into BB’s trading strategy and its bullish and bearish setups.
What is BB’s trading strategy?
The whole focus of the strategy lies in volatility. The bands depict lines on a chart, illustrating MAs and price moves. The area between the upper and lower bands forms an envelope.
You can see on the chart that there are three lines or bands of BB indicator: upper, middle, lower. The middle band also relies on MA.

It reflects the upper and lower bands’ relative center and gauges the current volatility. You can use the upper and lower bands as a volatility channel to look for the market.
In addition, traders pay close attention to the BBs squeeze, which happens when both the upper and lower bands overlap or come together, often after a trending period.
A squeeze or contraction of the BBs indicates that the FX pair is experiencing low volatility.
How to trade with BB strategy?
When low volatility starts in the market, it is followed by periods of high volatility, giving a good opportunity from the coming or predicted move. A squeeze is thus a period of price consolidation preceding a breakout.
You can use the trendlines to identify market highs and lows. For instance, a price rise above the consolidation’s high would be considered an upside breakout, while a price move close to the consolidation’s low would be considered a downward breakout.
You can also use BBs to filter these breakout trading scenarios.
- A price closing above the resistance trend line and the upper BB might indicate a bullish breakout.
- A price closing below the support trend line and the lower BB may signal a bearish breakout.
Bullish trade setup
If the trend follows the path of an upper band, it’s a bullish signal in a continuation trend. So you can take long positions or exit the short ones. If the price pulls down inside the uptrend and remains above the middle band before returning to the top, it signals a lot of strength.
In general, an uptrend price should not touch the lower band, and if it does, it is a warning indication of a reversal, and you must act accordingly.
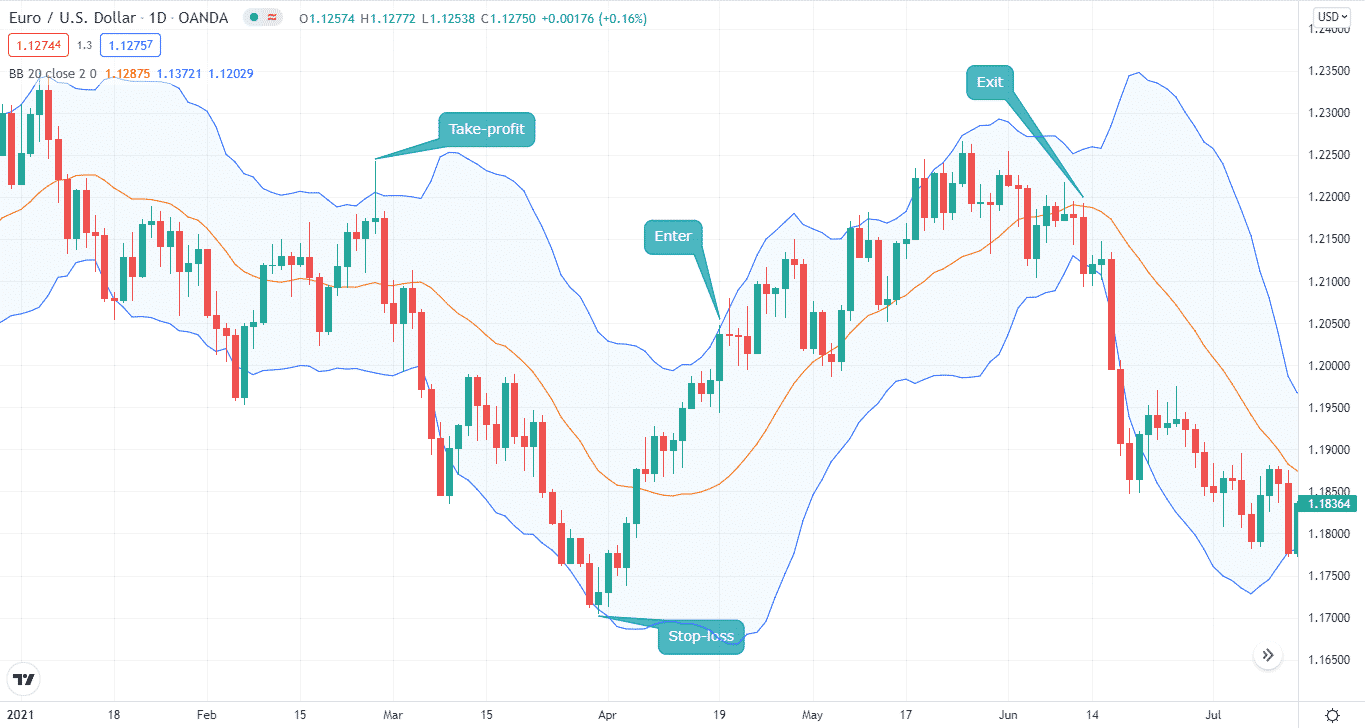
In the chart below, you can see that the price follows the upper band. The trend did slip below the middle band but did push upwards strongly. You can notice that when the price did dip below the lower band, the trend started drifting down. So, this is where we exit the position.

Entry
You can enter the trade when the price moves above the upper band. You should wait for confirmation for a trend to continue moving upwards and then enter the trade.
Stop-loss
You can place an SL below the recent low. However, it is ideal for placing an SL at the lower band.
Take profit
You can set a TP at the recent high when the price moved above the upper band.
Bearish trade setup
The price will run along with the bottom band in a strong downtrend, indicating that selling is still active. However, if the price does not contact or move along the bottom range, it indicates that the downtrend is losing momentum.
The downtrend is very strong when there are market pullbacks, and the prices remain below the middle band before moving back to the lower band.
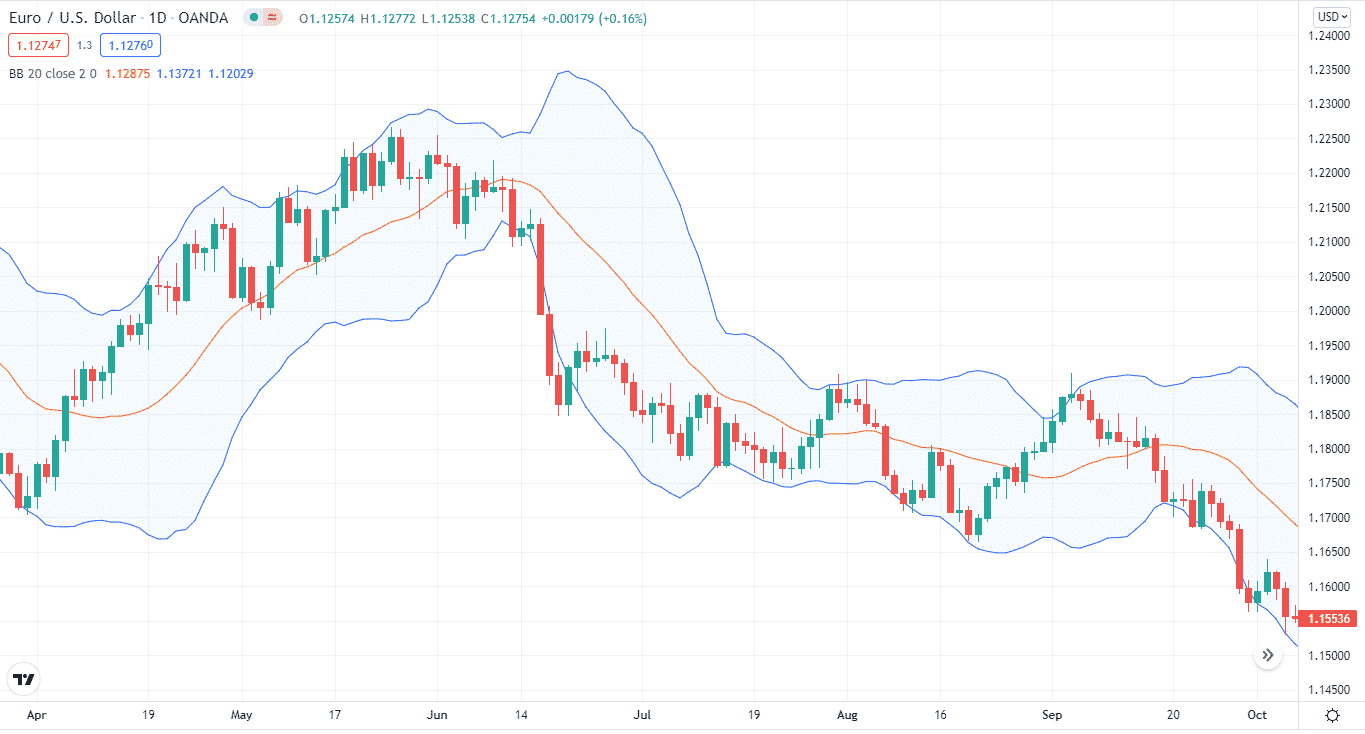
In the chart below, you can see how the price moved along the lower band, and when the price started to move above the upper band, we exited the trade.
Notice we set our take-profit below the lower band but exit on the lower band also. This is because our TP got hit, and we exited the trade. We would exit the trade if our TP was hit when the price moved beyond the upper band.

Enter
You can enter a short trade when the price moves along the lower band.
Stop-loss
You can place an SL at the recent high or when the price breached the upper band.
Take profit
For TP, you may choose a point when the price moves below the lower band.
How to manage risks?
Like most technical indicators, BBs are a lagging indicator. So, to minimize the risk, you need to have a proper plan. Here are some of the ways to manage risks by using BBs.
Stop-loss
Setting an SL with any trading strategy is a must-have. You can limit your risk exposure by placing an SL at the recent low when going long or a recent high when going short.
Time frame
The indicator produces fewer false signals when choosing a higher time frame like hourly, 4H, or daily chart. For short-term strategies, you can look for the potential signals on the higher time frame and then take positions on the lower time frame accordingly.
Use other indicators
You can also use other indicators to go with BBs, which will act as a confirmation. For example, RSI, MACD, and others.
Final thoughts
BBs are an effective tool for finding the trend direction. You can apply them for any strategy like scalping or day trading. A key point to note is BBs are price reactive; they act according to the price and do not forecast it.


