Over the years, harmonic trading has become popular among traders. Market participants always talk about harmonic setups in TradingView. One popular harmonic pattern is the Butterfly. To trade it, you must understand the Fibo measurements.
There is something in the Fibo sequence that stuns scientists for years. While it is not universal, the sequence is pervasive, such as the number of petals in flowers, formation of tree branches, etc. Some traders believe the markets flow similarly.
Many Butterfly setups occur on your charts every single day. You can find them in any time frame, from one minute to a month. Of course, you cannot trade all of them. What you can do is focus on higher timeframes, such as hourly and four-hour charts. This will still give you enough to get busy with every single week and month.
While you can trade any Butterfly setup that forms on your chart, there is one optimal way to deal with this pattern. Sure, you can trade one that appears at the end of a trend. But there is a better way. We will share this secret with you in this article.
What is a Butterfly pattern?
It is one of the patterns used in harmonic trading, a subset of price action. You often see this pattern at the end of a trend. This is because market participants who trade reversals closely watch extended markets.
It is composed of four swings and five points:
- X
- A
- B
- C
- D
Due to this, the pattern takes time to form. It can form within the day, week, or month depending on your watching time frame.
The Butterfly is one of the harmonic patterns presented and discussed by Scott Carney in his harmonic trading volume. He outlines the specific measurements for each point of the five-point structure. However, the essential points are B and D. Since markets are not perfect, the price may not reach or go beyond the specific measurements by a few pips. As long as the pattern is identifiable, such a setup is still tradable.
How to trade with Butterfly pattern?
To trade it, you have to be familiar with the Fibo measurements.
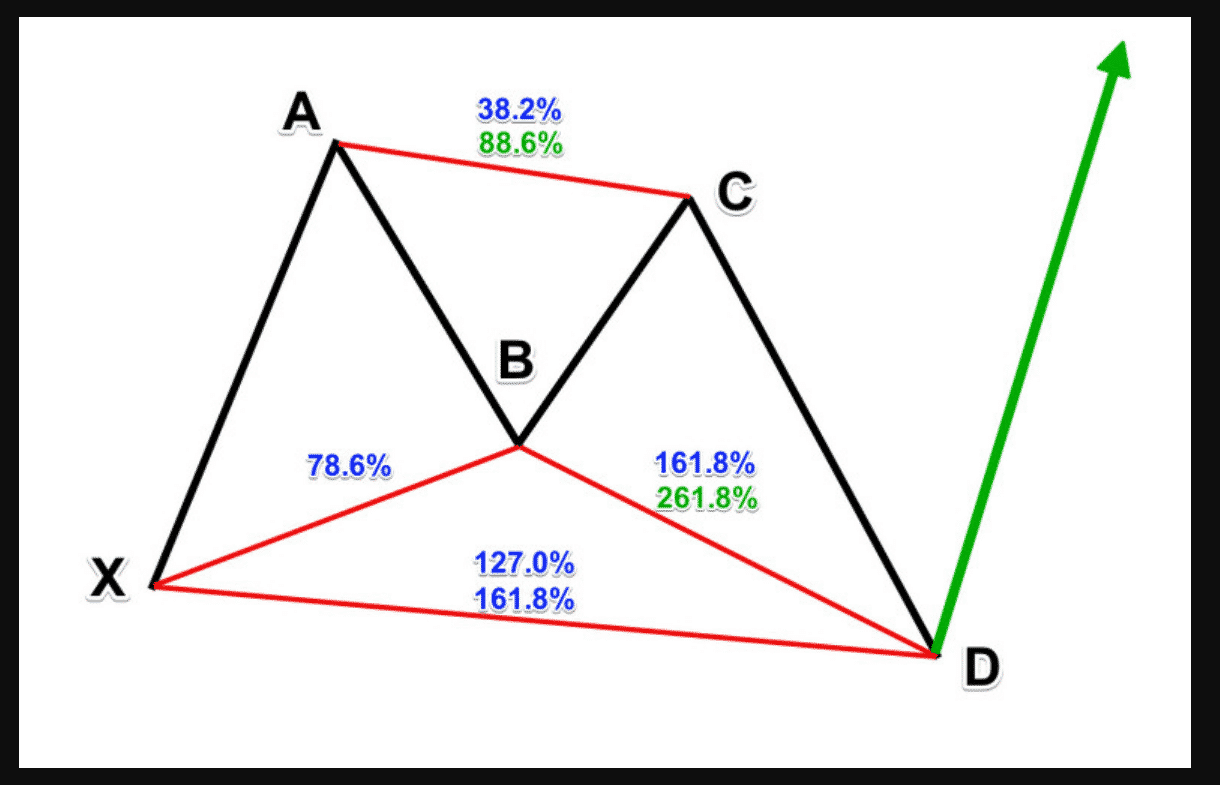
Note a schematic diagram of a bullish Butterfly pattern on the picture below. There are at least five points you must understand when it comes to trading this method.
- Point B should be about 78.6% retracement of the impulse swing XA. It does not have to be exact, but it should be close.
- Point D should be about a 127.1% extension of the XA swing. Price may end short or beyond the completion point, but not too much.
- You must see an AB=CD structure in the last three swings of the structure. The AB=CD pattern does not have to be perfect. Typically, the CD leg is longer than the AB leg.
- Point D must go beyond point X. That is an essential difference between an extension pattern like the Butterfly and a retracement pattern like Gartley.
- While you expect a major price reversal from point D, it does not happen all the time. The most conservative target is point C.

Understanding the precise measurements is just half of the battle. You have to recognize the market context before you take a Butterfly setup. Does the pattern form in a downtrend or an uptrend? In that case, you will be trading against the trend. While you can get many winning trades with this approach, there is a better approach. This is the secret that we want to share with you in this post.
It would help if you traded Butterfly setups occurring in the context of a trending market. That is the secret. This means that you should find these patterns in the middle of a trend, not in the end. When you do that, you are entering a trade at a pullback point. The setup calls the end of a pullback and becomes a precursor of trend continuation.
Bullish trade setup

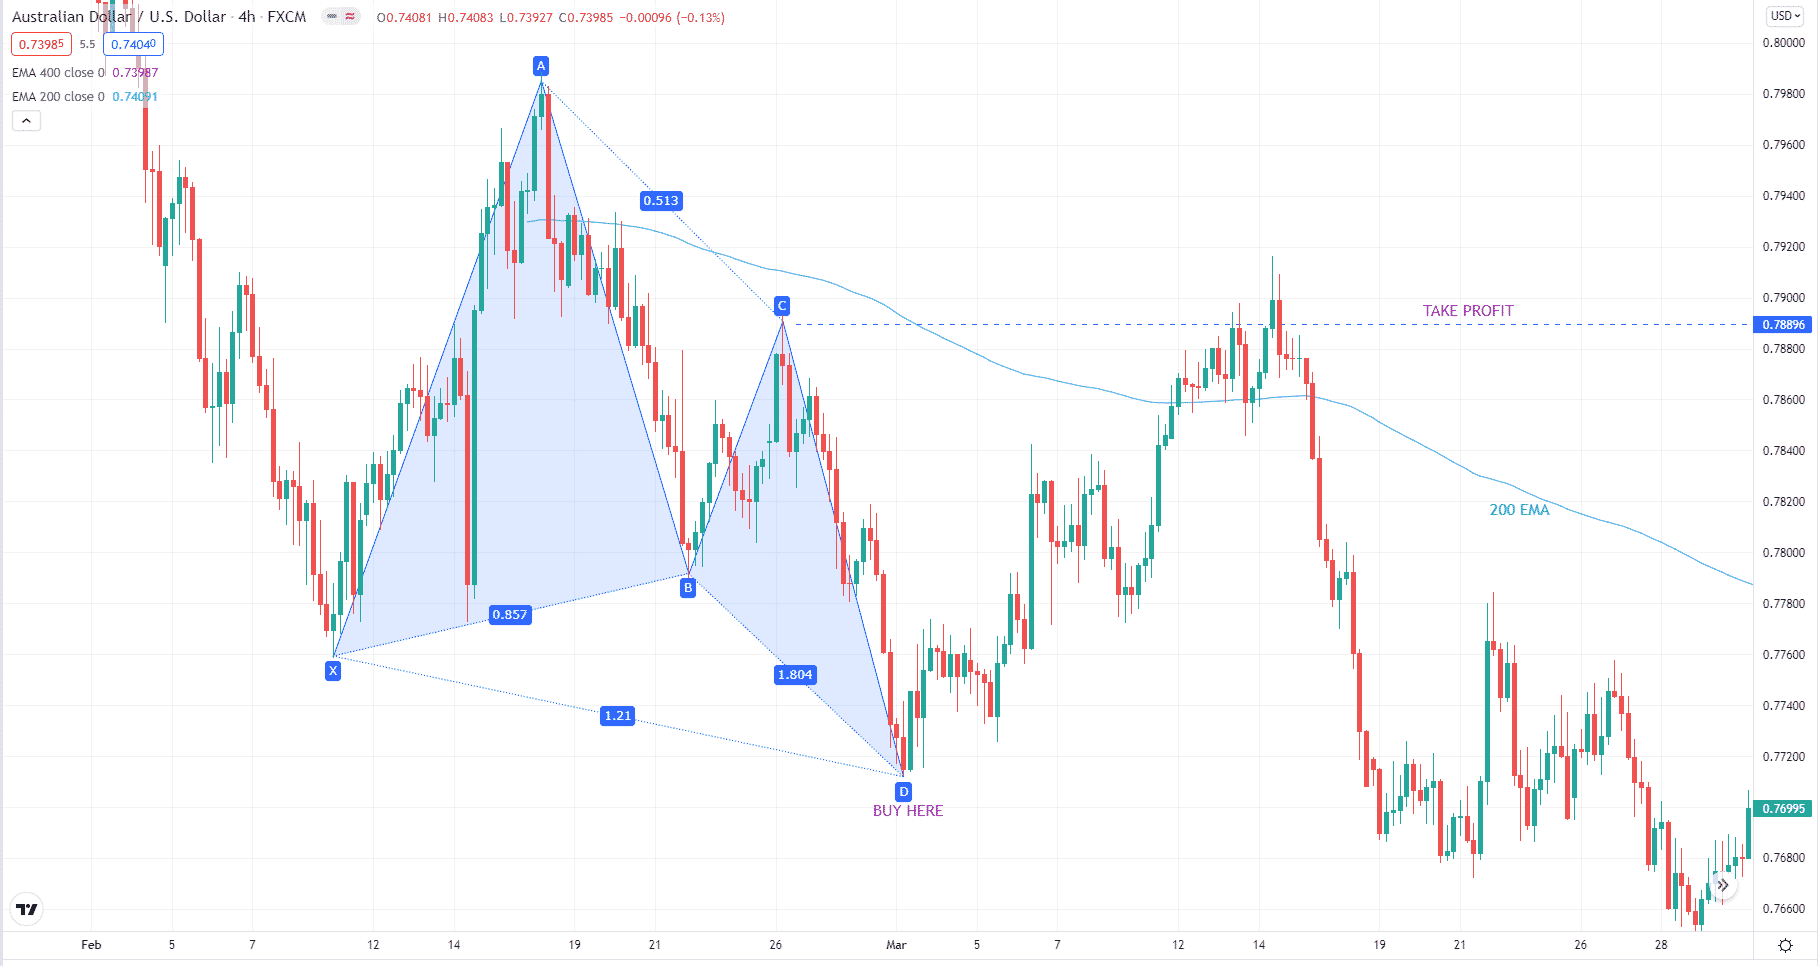
Let us use the above AUD/USD four-hour chart to discuss a buy trade. As you can see, a buy setup occurred on 01 March 2018. While the B point is not exactly 78.6%, it is very close. Meanwhile, the D point is right on the mark. You can enter the buy trade after the green engulfing candle forms. Then you can set the take profit at the level of point C.
This buy setup forms in the context of a downtrend. After the entry, the price managed to hit the target, but it struggled to do so. As a result, the rally is short-lived and serves as a pullback. After price hits resistance at point C, it continues the sell-off with much strength and takes out point D.
Bearish trade setup

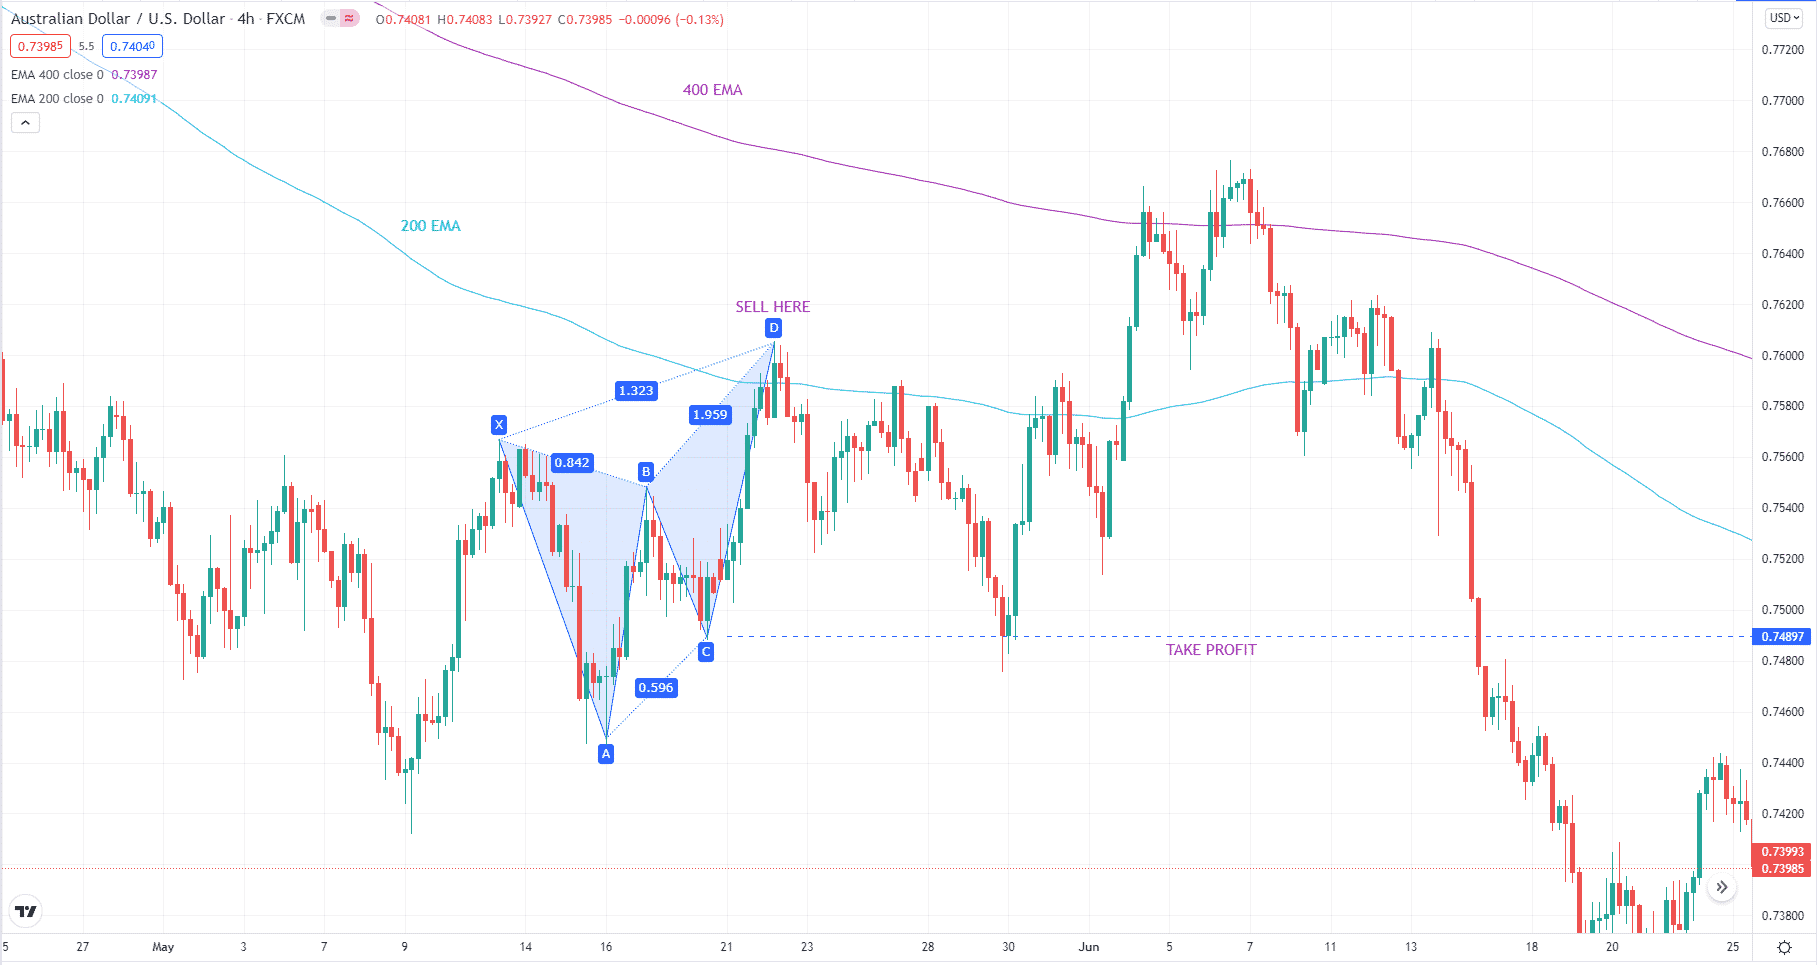
We use the same AUD/USD H4 chart to present a sample sell trade. On 22 May 2018, a bearish Butterfly setup forms. The pattern is not perfect, and the measurements are slightly off. Still, the setup looks like a Butterfly pattern. You can start looking for entry when the price hits the 1.27 extension. The sell entry here could be the second bearish candle from point D. Then the take profit is point C.
This setup is a lot better than the previous one. This is because it forms in a downtrend. The trend and the setup are aligned. This setup is one of the best you can find. While price fails to continue the downtrend immediately after the bearish pattern, it happens shortly after.
How to manage risks?
Use a stop loss. To do so, you can make use of patterns. In the first example, a bullish one is our entry trigger. Therefore, the stop loss goes to the low of the engulfed candle. In the second example, an inside bar formation triggers the trade. The stop loss should go to the high of the mother candle.
Final thoughts
One benefit of trading this pattern is the high reward-risk ratio. In both examples above, you could have gained more than two times the risk in each trade. The target (point C) is far from the entry, while the stop loss distance is relatively minor.
Take note that you can take a trade setup forming against the trend. However, the more successful trades occur at the pullback phase. Consider this when you start looking for Butterfly trade setups.


