Financial traders frequently use many technical indicators to obtain the market context. Using such indicators enables traders to observe the market from various angles as various indicators use different formulas and work with different market data.
However, no one can expect to use the indicator ideally for trade executions without learning the procedure and understanding components. This article will introduce you to the Choppiness Index indicator. Moreover, it contains procedures besides explaining trading strategies with chart attachments using this indicator for better understanding.
What is a Choppiness Index indicator strategy?
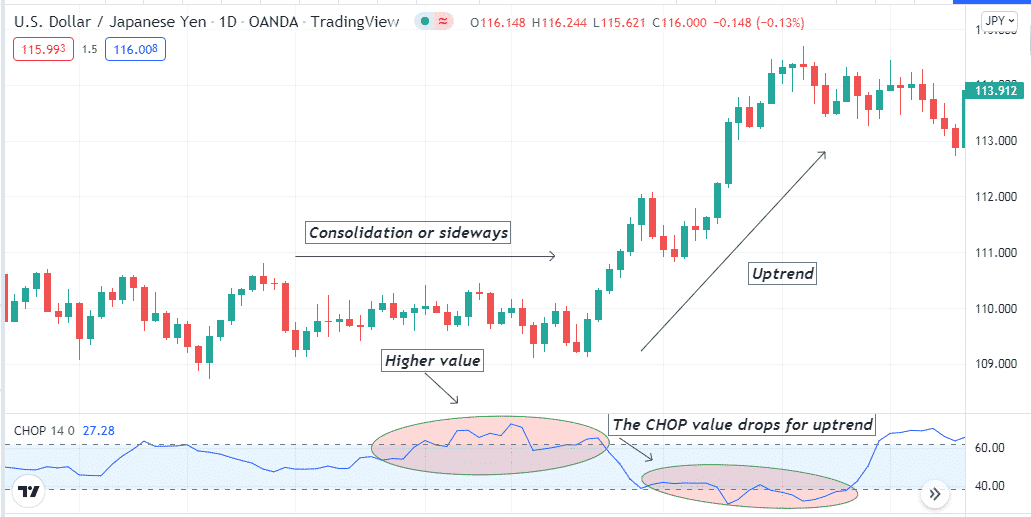
It is a trading method that uses the Choppiness Index indicator to suggest trading positions. This indicator doesn’t predict the future movement but determines that the price remains on which phase. More specifically, in a consolidating phase or not.
The developer of this indicator is Bill Dreiss, an Australian commodity trader. The primary goal was to define if the price was on a trend or in a range. The default setting of this indicator is 14 periods. Traders frequently use the Fibonacci values to determine trendy or choppy markets. A value above 61.8 indicates consolidation, and below 38.2 declares a trend.
The Choppiness Index Indicator uses the formula:
Choppiness Index = 100 * Log10 { Sum(TrueRange,n) / [ Maximum(TrueHigh,n) – Minimum(TrueLow,n) ] } / Log10(n)
Where:
- Sum True Range for the past n periods.
- Divide by the result of the following two steps:
- Calculate the lowest TrueLow for n periods.
- Subtract from the highest TrueHigh for n periods.
- Calculate Log10 of the result, then Multiply by 100.
- Divide the result by Log10 of n.
Although the Choppiness Index indicator detects the status of the current trend, it often lags the current trend.
How to trade with a Choppiness Index indicator strategy?
The CHOP indicator shows reading on an independent window between 0-100. The concept is simple, increasing value declares choppy, or consolidation phase on the asset price, and a decreasing index declares trendy situation. In other words, when the dynamic line of the CHOP indicator window remains closer to 100, it declares a consolidation or sideways movement.
Meanwhile, for any trendy movement, the dynamic line remains closer to 0. If you draw a central line on the indicator window with a value of 50, the CHOP line above 50 indicates sideways, and below 50, the price may remain on any trend.

You can use this indicator to confirm the market condition as other technical analysts do. Many financial traders believe that more consolidation occurs before the price movement enters a more trendy movement. You already know that this indicator only shows the current direction of the price movement, so it is complicated to use it as a standalone indicator to create any successful trading method.
We use the MACD indicator alongside the CHOP indicator to create a sustainable trading strategy. The MACD will identify the trend, and the CHOP indicator will confirm the market context whether it is potential to enter a trade or not.
Bullish trade setup
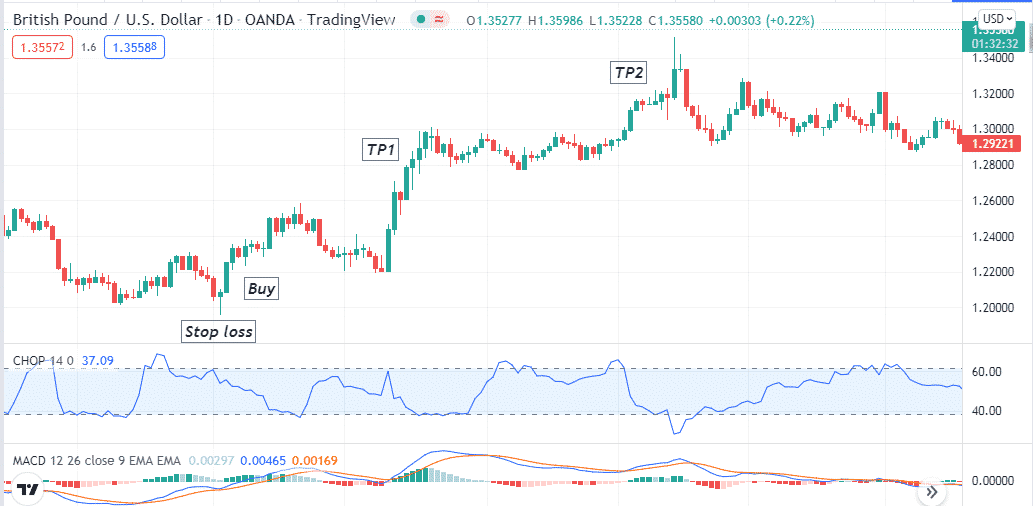
Seek opening buy positions when a bullish momentum initiates. This method declares potential bullish pressure when:
- The dynamic blue line crosses the dynamic red line on the upside at the MACD indicator window.
- MACD green histogram bars take place above the central line.
- The CHOP reading declines below the middle (50) level.

Entry
When these conditions above match your target asset chart, this method declares sufficient bullish pressure on the asset price and suggests opening a buy order here.
Stop loss
The initial stop loss level will be below the current swig low of the bullish momentum.
Take profit
You already know the CHOP indicator only defines a ranging and trending market. So it is not wise to close positions by only looking at this indicator reading cause the price often consolidates within the current trend. Close the buy position when:
- The CHOP indicator reading rises above the upper line near 100.
- MACD red histogram bars take place below the central line.
- A bearish crossover occurs between the MACD dynamic lines.
Bearish trade setup
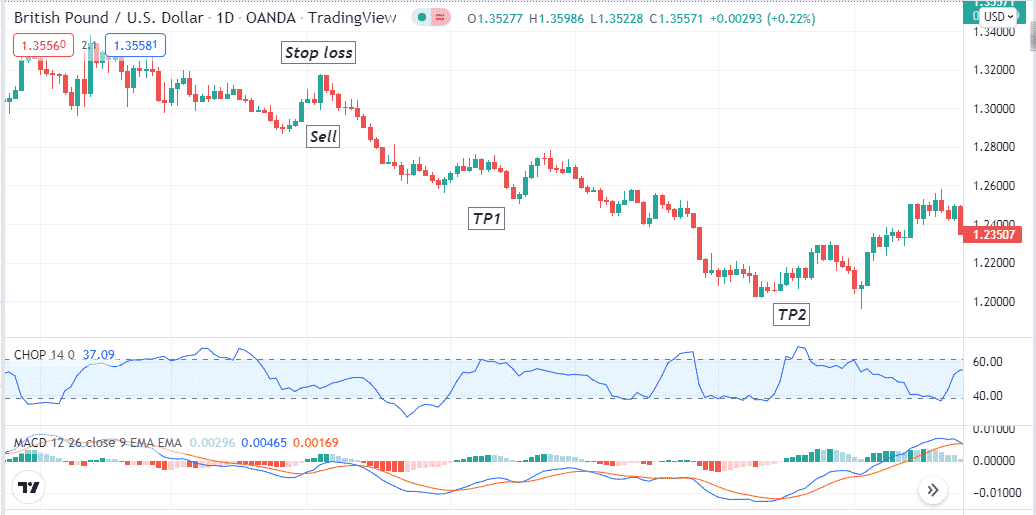
Seek opening sell positions when a bearish momentum initiates. This method declares potential bearish pressure when:
- The dynamic blue line crosses the dynamic red line on the downside at the MACD indicator window.
- MACD red histogram bars take place below the central line.
- The CHOP reading declines below the mid (50) level.

Entry
When these conditions above match your target asset chart, this method declares sufficient bearish pressure on the asset price and suggests opening a sell order here.
Stop loss
The initial stop loss level will be above the current swig high of the bearish momentum.
Take profit
You already know the CHOP indicator only defines a ranging and trending market. So it is not wise to close positions by only looking at this indicator reading cause the price often consolidates within the current trend. Close the sell position when:
- The CHOP indicator reading rises above the upper line near 100.
- MACD green histogram bars take place above the central line.
- A bullish crossover occurs between the MACD dynamic lines.
How to manage risks?
Risk management is a vital part of financial trading. The top risk management tips for this trading method are:
- Check on fundamental info before opening any position. Avoid trading with this method during any significant news release or relative trading asset.
- Use multi-timeframe analysis to get a birds-eye view on the asset price movement and avoid fake swing highs/lows of smaller time frame charts.
- You can shift your stop loss according to market context. For example, you open a buy position, and the price goes in your direction, shift your SL to the breakeven when the price creates a new higher high if you continue the trade after that.
Final thought
The Choppiness Index indicator is a straightforward indicator of the current market context. You can easily make constant profitable trading positions using this indicator alongside other technical tools and indicators.


