Expert crypto traders frequently conduct crypto chart patterns analysis to generate successful trade ideas. It enables participation in both short-term and long-term trades. Various crypto chart patterns are available to use and execute constantly profitable trades in any price movement direction. Crypto investors often combine these chart patterns with other technical tools or indicators and create sustainable trading strategies.
However, it requires a certain level of understanding and skills to identify, execute, and avoid risks while using any chart pattern to make trade decisions. This article contains the top five tips to execute successful trades using crypto chart patterns.
What is the crypto chart pattern strategy?
The crypto market is complex, and price changes constantly with investors’ interests. So successful traders adopt trading methods that can deal with this ever-changing nature of crypto assets. Chart patterns represent price formations or a graphical way to illustrate participants’ actions during price changing. Three common phases of the price movements are:
- An uptrend
- A downtrend
- Consolidation/sideways
These phases come with different shapes, intensities, and sequences. In the meantime, price always remains in any of these phases in various time frame charts. You can consider the chart patterns as connectors between these phases. For example, a downtrend ends and starts to move in the opposite direction, and in that case, a reversal chart pattern connects these phases.
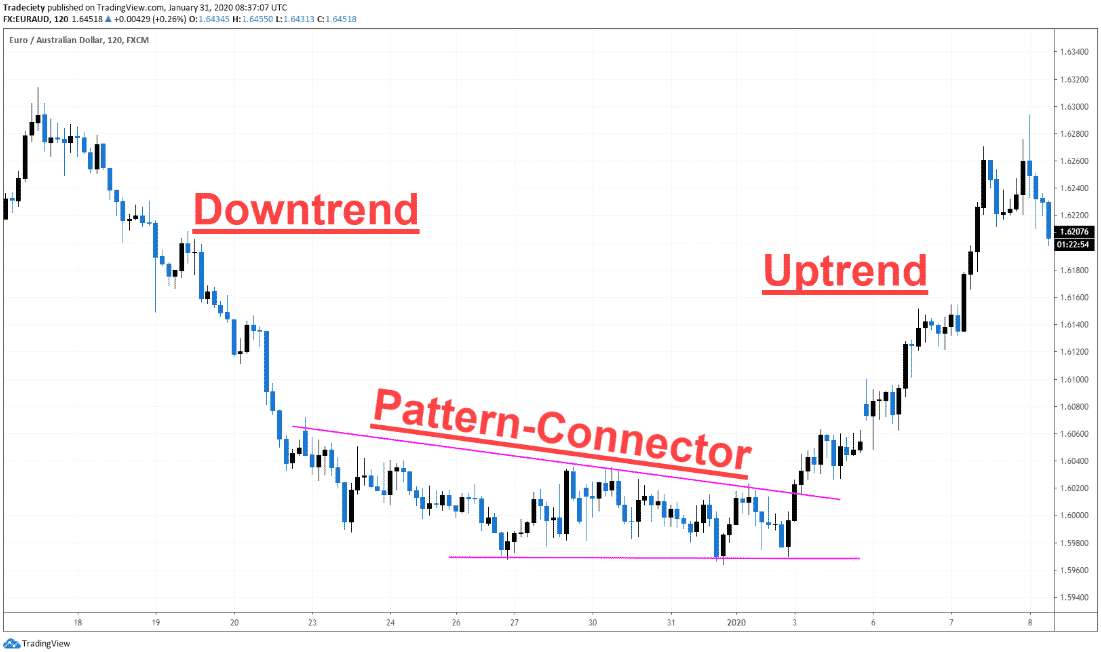
Again, price changing may push for a while and start to move again in the same direction. A continuation pattern connects these phases of price movements.
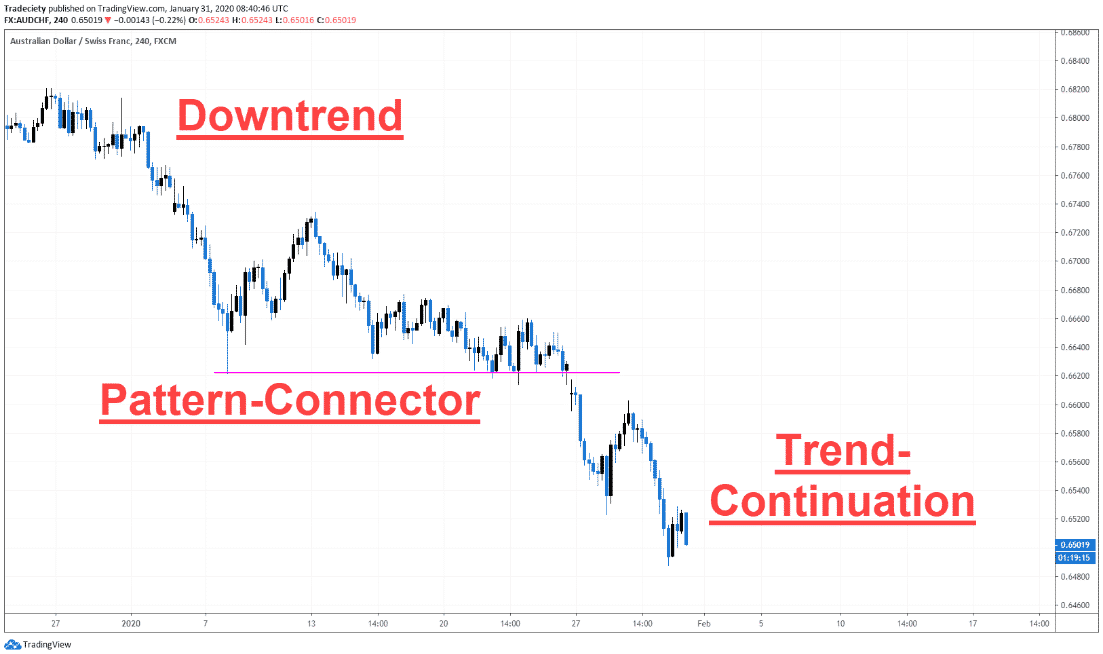
Any crypto trading method that uses concepts of chart patterns belongs to the list of the crypto chart pattern trading strategies.
Tip 1. Try to trade into the outline
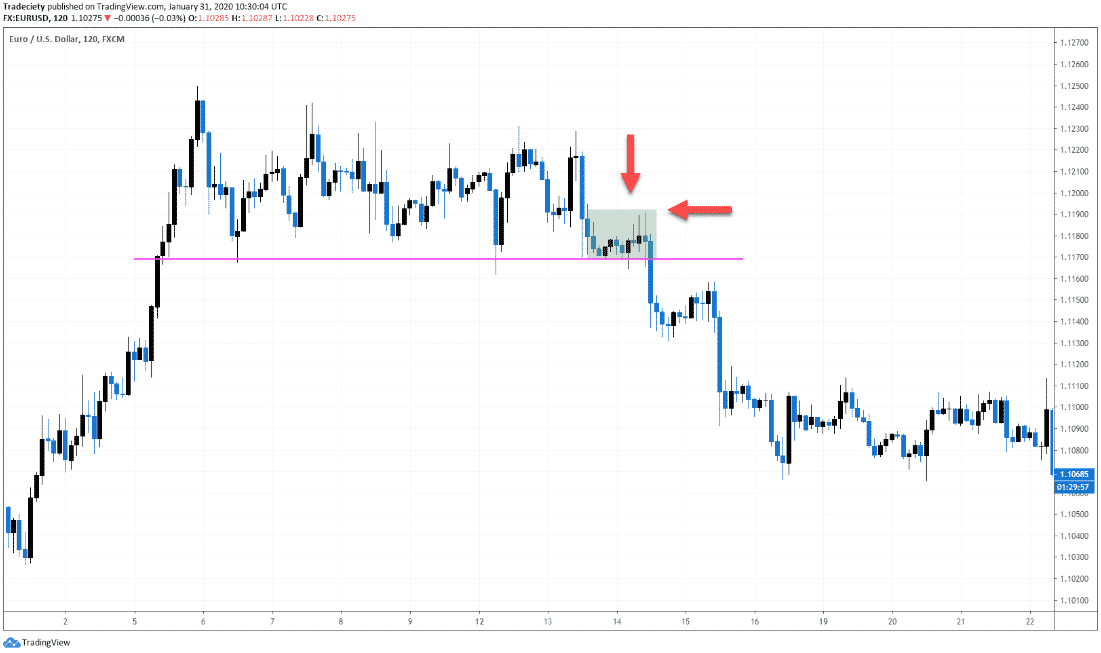
When you want to trade using any chart pattern, it is better to determine the pattern outline to trade into the outline.
Why does it happen?
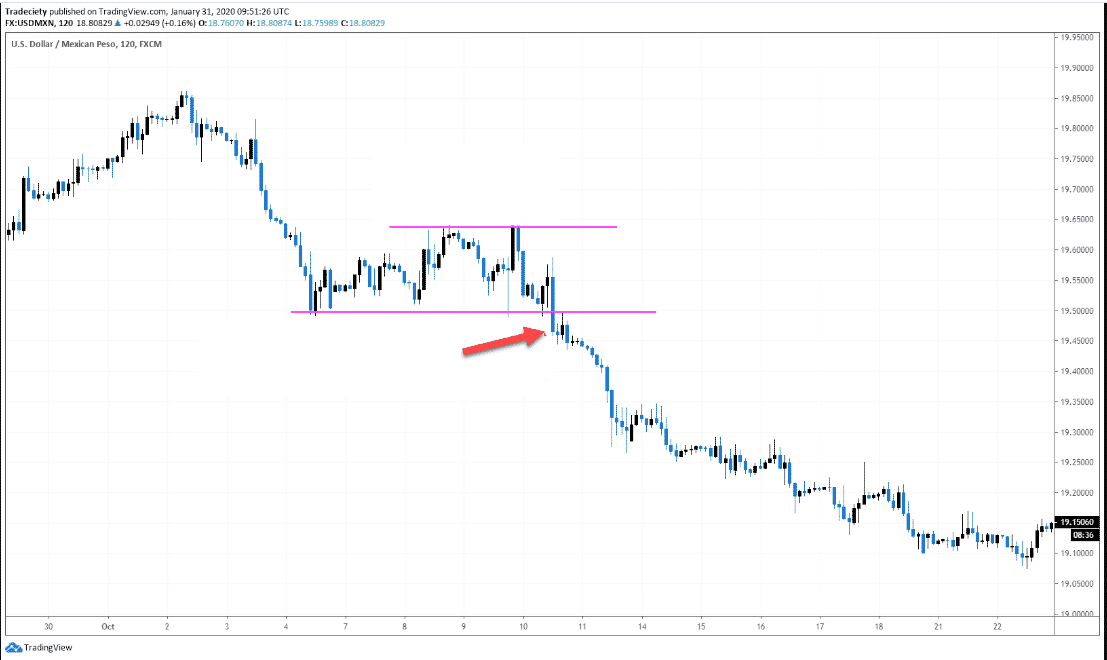
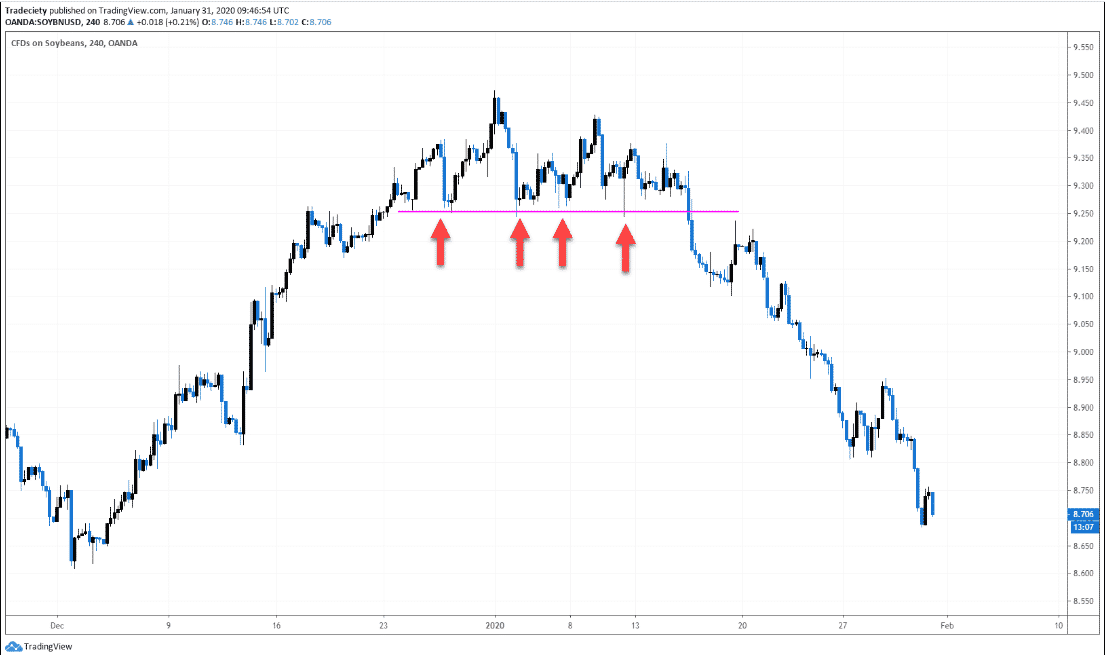
When you see the price stick to a level, there are high probabilities that the price breaks in either direction of price movements. The price usually bounces on any level due to participants’ actions. For example, look at the chart above and check the arrows illustrating that the price comes to the support level and bounces back upside every time as the buyers lose control over the asset price decline taking place and lastly breaks below the support level. If you can trade into the outline, it enables participation in a highly profitable sell trade.
How to avoid the mistake?
It requires determining foreshadows of breakouts to trade into the outline. You can confirm the decreasing buy pressure by drawing a trendline curved to the downside. Otherwise, avoid and enter the market after confirming the breakout.
Tip 2. Check trending environment or chart pattern context
Among the most popular textbook talks, every technical trader in the financial market may know that “trend is always your friend.” So executing trades in the direction of significant participants allows making more profits and decreases risks.
Why does it happen?
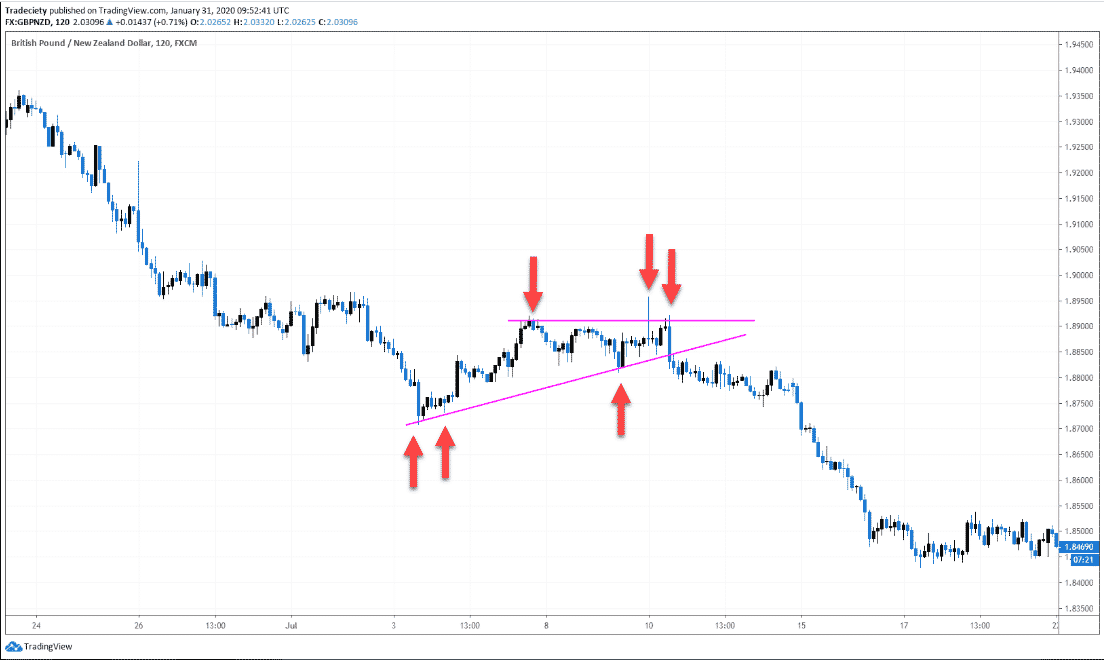
When the price enters in consolidating phases from any trend, the price movement occurs in sideway directions. In some cases, as the chart above shows, a slight uptrend occurs when you connect the lower lows after a sharp downtrend. Meanwhile, in the end, the price breaks below that trendline and resumes to decline.
How to avoid the mistake?
You can conduct multi time frame analysis to avoid mistakes as the long-term charts don’t usually illustrate the small consolidations of lower time frame charts.
Tip 3. Try to identify chart pattern trigger points before executing trades
Trigger points are the entry point of any trade. Determining the trigger point before executing trades helps to maintain the risk-reward ratio.
Why does it happen?
Expert crypto traders, more specifically swing traders, determine trigger points often depending on breakout levels. For example, check the chart above, the price consolidates after a sharp bearish movement, and a breakout occurs below the support level. Then the price continues to decline again, and the trigger point is below the support level.
How to avoid the mistake?
There can be a fakeout or failure of breakout. Better to determine the trigger point and wait until a valid breakout occurs before executing trades.
Tip 4. Check on wave structure confluences
Expert technical traders seek potentially profitable trading positions through price waves as waves build price charts.
Why does it happen?
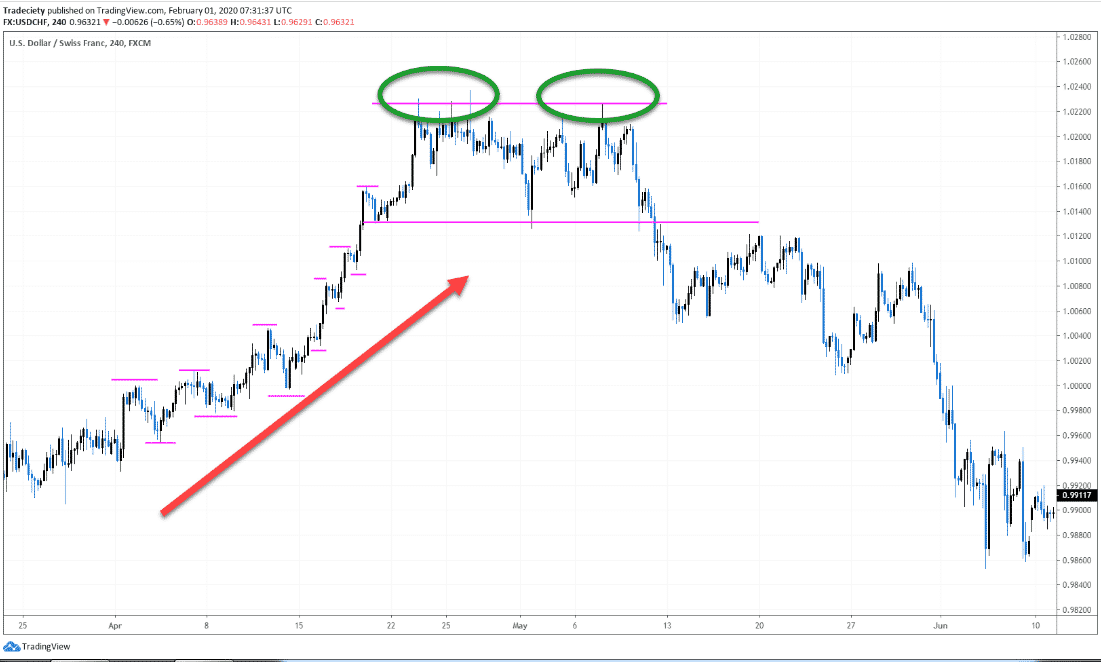
When seeking trading positions by following reversal patterns, we look for signs and exhaustion that declare that the current trend is losing power. The example chart above of the triple top pattern shows the reversal declaration through price waves. The price touches several times to the support resistance levels to illustrate consolidation.
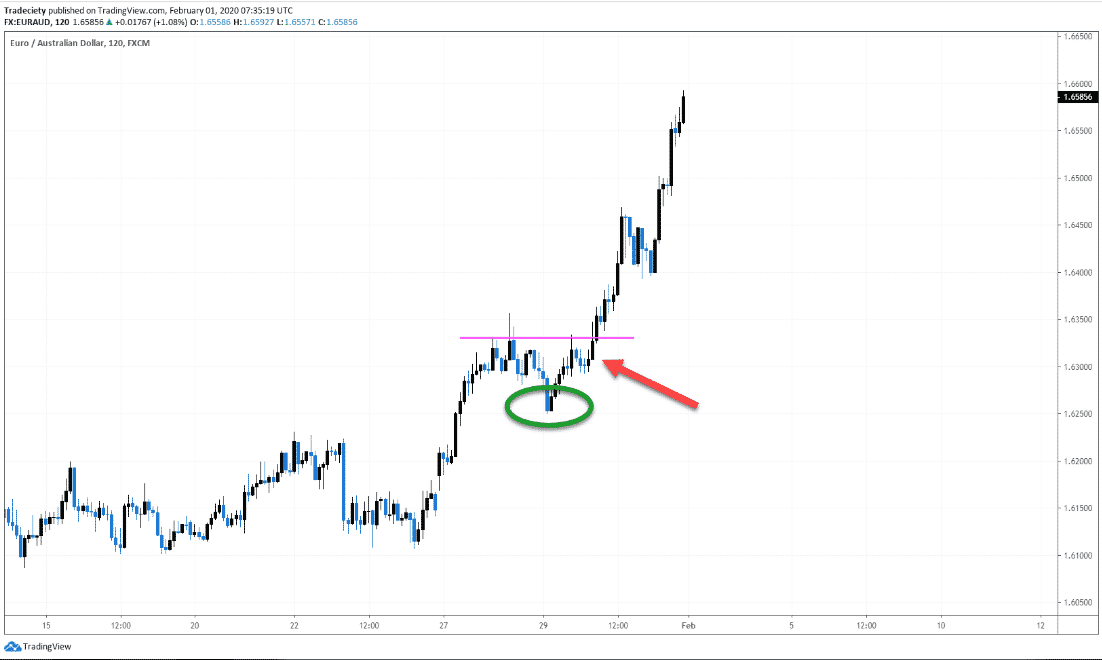
Meanwhile, wave structures are also effective in continuation phases. The chart above shows an example where the price declines by facing resistance and immediately bounces back to the upside as buying pressure increases.
How to avoid the mistake?
Technical traders often make mistakes by opening early positions when trading with wave structures. We suggest entering trades only after confirming the breakout or placing trades at the edges or the ranges during consolidation. You can use many technical indicators and combine them with chart patterns to determine the most profitable entry/exit points.
Tip 5. Check on chart pattern outline
When you can identify chart pattern outlines, it becomes easier to find the best patterns.
Why does it happen?
Any individual crypto trader can find any chart pattern outline by simply drawing horizontal lines. When you focus on chart patterns that enable determining outlines, the example chart above will significantly improve your chart pattern skills. When the price breaks in either direction of those outline levels, it opens trading opportunities.
How to avoid the mistake?
The price touches and respects any horizontal level several times to confirm the pattern. Wait till a valid breakout before executing any trade to avoid mistakes while trading using these types of crypto chart patterns.
Final thought
Finally, we list the top five tips to execute constantly successful trading positions through any crypto chart pattern trading strategy. This article provides a framework for obtaining the market context that does not require memorizing textbook chart patterns.
