The Double Exponential Moving Average (DEMA) is a technical indicator that uses a unique calculation to obtain the market context. Many financial investors frequently use this technical indicator to make trade decisions. So it makes sense that this DEMA indicator is also helpful to crypto investors when using the concept appropriately.
However, it is mandatory to have a particular level of understanding of any technical indicator while starting to make trade decisions using that specific tool. This article introduces the Double Exponential Moving Average (DEMA) indicator and lists the top five professional tips to use this indicator most effectively.
What is the DEMA indicator?
It is among the MA indicators family and uses a unique calculation to eliminate market noise and reduce lags while obtaining the market context. This indicator uses two EMA lines to show the market data. The formula this indicator use.

You can use this indicator as traditional MA indicators to identify trends, support resistance, trend switching points, breakouts, sideways, etc. It enables providing more efficient results than other MA types.
Top five tips for using the DEMA indicator for crypto trading
When using any technical indicator to generate crypto trading ideas, it is better to follow professional investors’ approaches to obtain the best results. In this part, we list the top five tips for using the DEMA indicator.
Tip 1. Determine swing points using the DEMA indicator
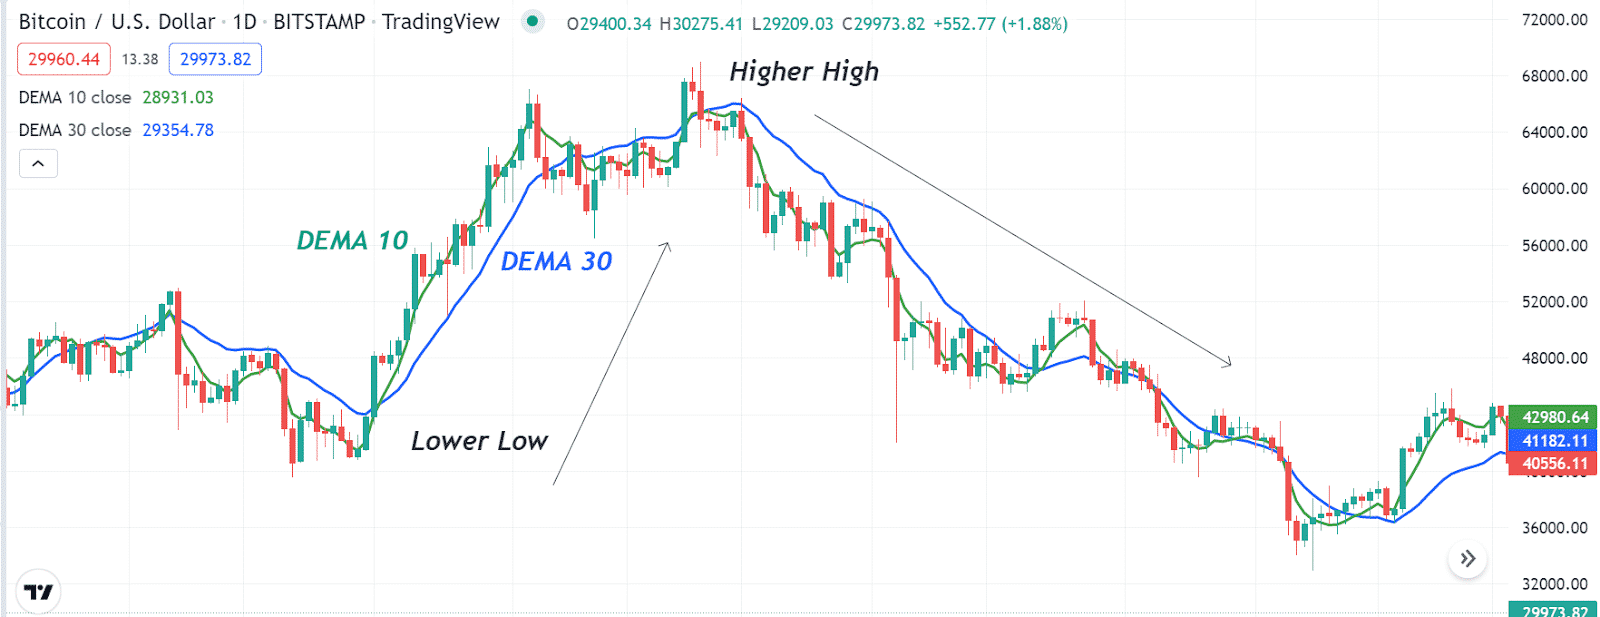
You can use the MA crossover concept to spot trend switching points. You can use the DEMA indicator to determine swing points. For example, you may use DEMA 10 (green) and DEMA 30 (blue) lines. When the green DEMA line reaches above the blue DEMA line, a valid swing-low already takes place and vice versa when the opposite crossover occurs.
Why does this happen?
It happens as this indicator uses the traditional MA crossover concept when a DEMA line using a smaller parameter crosses above any DEMA line of a significant parameter, declaring a potential bullish pressure on the asset price and vice versa.
How to avoid mistakes?
Using this concept, determine swing points enter trades by following other scenarios as both DEMA lines may be heading in any specific direction. Moreover, checking on upper timeframe charts enables knowing the actual trend, so check and match before entering any trade.
Tip 2. Determine trends using the DEMA indicator
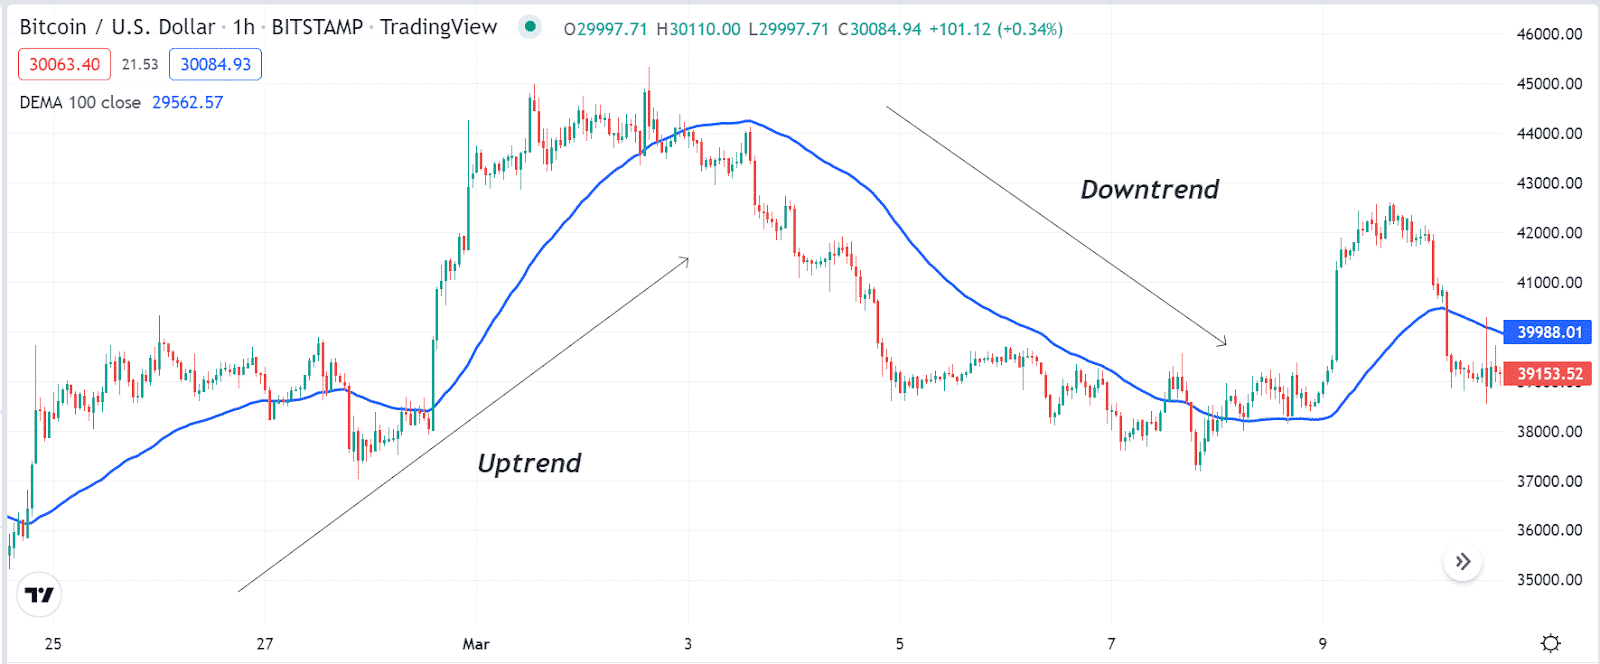
You can use the DEMA indicator to determine trends. For example, you may use a line of 50 periods in your target asset chart. When the price reaches above that DEMA line, it starts sloping on the upside and remains that way; it declares an uptrend. Meanwhile, the exact opposite scenario indicates a downtrend.
Why does this happen?
It happens as the DEMA indicator collects the price change info and shows the average price movement, either gaining or falling according to market context.
How to avoid mistakes?
When detecting trends and using them for entering trades, use proper stop loss to reduce risks on capital. This indicator can fail due to fundamental reasons and only calculates historical price movements.
Tip 3. Determining support resistance
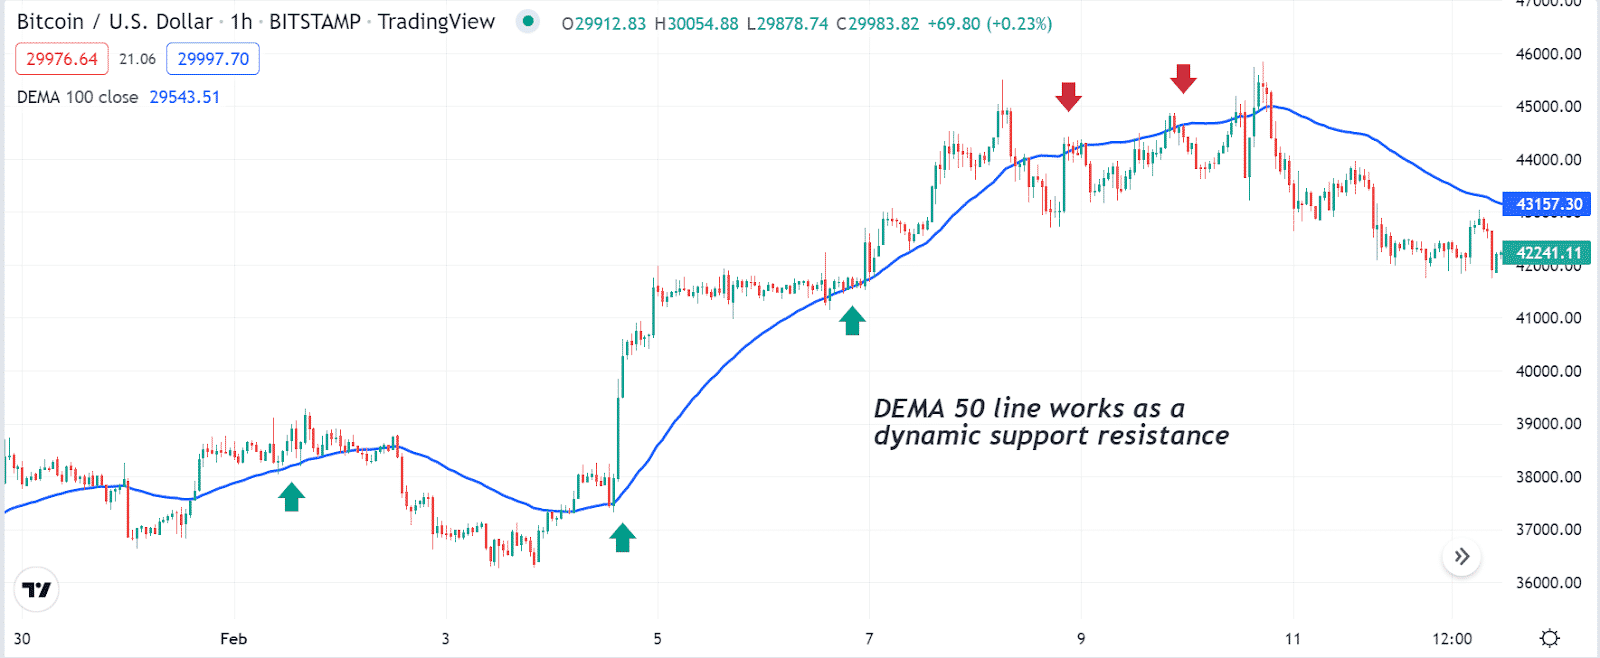
You can use the DEMA indicator to determine support resistance. For example, look at the chart below; it shows several times the price reaches a DEMA (50) line and bounces back on the upside or downside, declaring support resistance. The price reaction at the DEMA line is visible.
How does this happen?
The price reacts to certain price levels according to participants’ actions. When the price reaches the DEMA line during any specific trend, average participants increase volume, so the price movements react.
How to avoid mistakes?
Confirm the overall trend direction from upper timeframe charts while using this concept to execute trades. This dynamic support resistance concept is beneficial in algorithmic trading as these are short-term trades and trade executions occur in shorter time frame charts. Using it manually must check upper timeframe charts to confirm the current trend.
Tip 4. Detecting breakouts
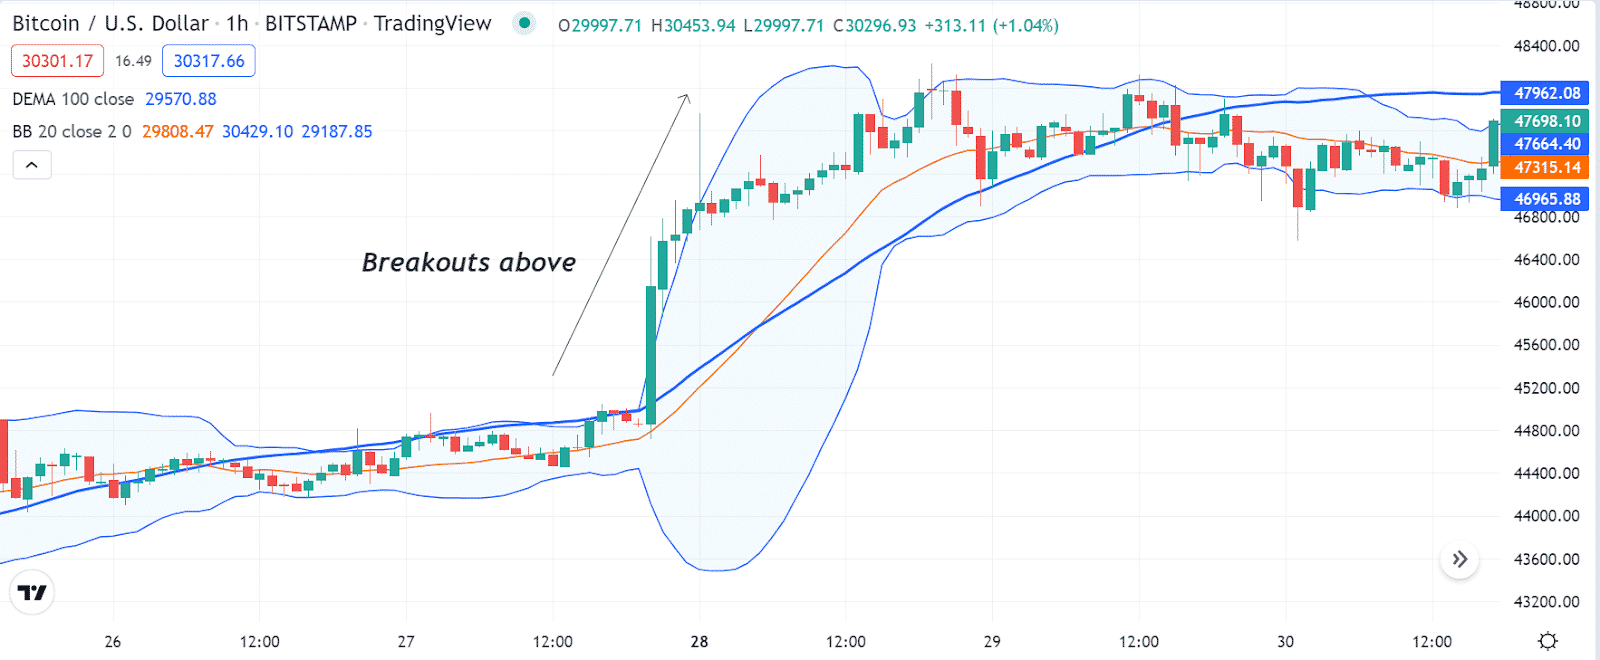
You can use the Bollinger Bands and combine them with the DEMA indicator to detect breakouts. For example, the price may enter a consolidating phase, and the bands of the BB indicator get closer. Meanwhile, the price rises above the DEMA indicator, and the BB indicator gets wider on the upside, indicating a bullish breakout and vice versa.
Why does this happen?
The BB indicator is a very familiar technical indicator to identify breakout levels. Meanwhile, the DEMA indicator confirms the price direction of breakouts.
How to avoid mistakes?
When any breakout occurs, generate swing trading ideas. These trades enable making significant profit from single trades and smaller risks. So place the initial stop loss above or below the bullish/bearish momentum.
Tip 5. Combining RSI indicators for more efficiency
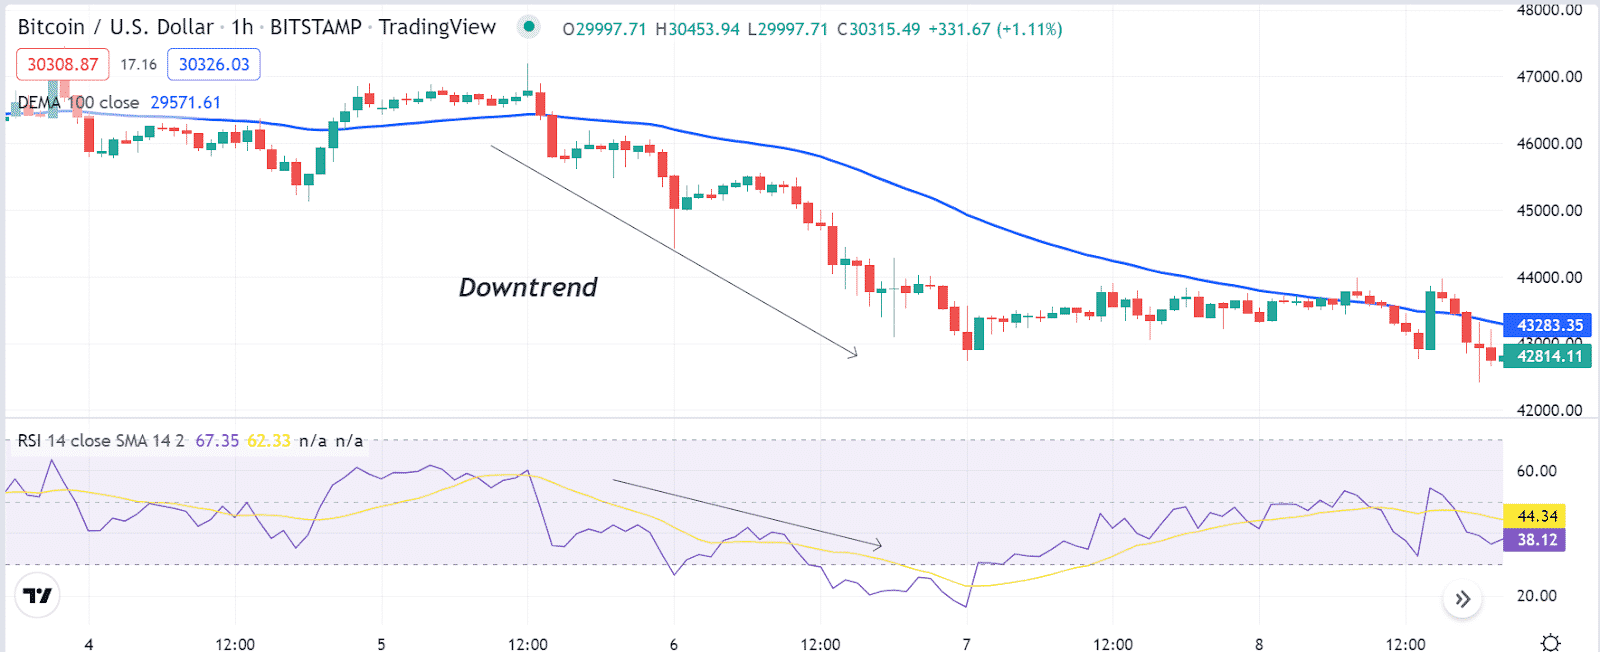
You can use the RSI indicator as a supportive technical indicator alongside the DEMA indicator while making trade decisions. For example, check the RSI window if the price starts to decline as it comes below the DEMA indicator and the indicator line slopes downward. If the RSI dynamic line reaches below the central (50) level and heads down, it declares a downward price force.
Why does this happen?
It happens as both indicators suggest the price movement in any specific direction enables potentially profitable trade opportunities. Combining both indicators readings helps determine the actual price direction and suggests more efficient trading positions.
How to avoid mistakes?
When using two or more indicators for crypto trading, combine readings carefully. Moreover, use proper trade and money management rules to reduce risks on your capital alongside increasing profitability.
Final thought
Finally, this article introduces you to a top potent technical indicator in the financial market. You can use this technical indicator to generate consistently profitable trading ideas. You can use the tips above or combine many other technical indicators and tools to create a more sustainable crypto trading strategy using the DEMA indicator, including parabolic SAR, Fibonacci retracement, MACD, ADX, etc.


