The Ichimoku cloud indicator sounds complex to the vast majority just because of the strange name. It holds a lot of data that may be tricky to understand and work with, but the tool is a lot simpler than people make it out to be.
Once you can comprehend what the Ichimoku cloud indicator is showing, it can prove helping you make high-probability decisions in a crypto market. This article will elaborate on how this is so, keeping in view some tips that will lead to professionalism.
What is the Ichimoku Cloud indicator?
“Ichimoku” is Japanese for “glimpse.” It allows us to find market trends in the simplest terms. It is also known as Ichimoku Kinko Hyo and is a prevalent technical analysis tool.
Essentially, the Ichimoku is an amalgam of many other technical indicators. It comprises five different elements or multiple averages, depicted by lines.
These lines create a cloud that is then used to predict where the cryptocurrency’s price will find support or resistance.
These five lines are:
- Base line
- Conversion line
- Lagging Span
- Leading Span A
- Leading Span B
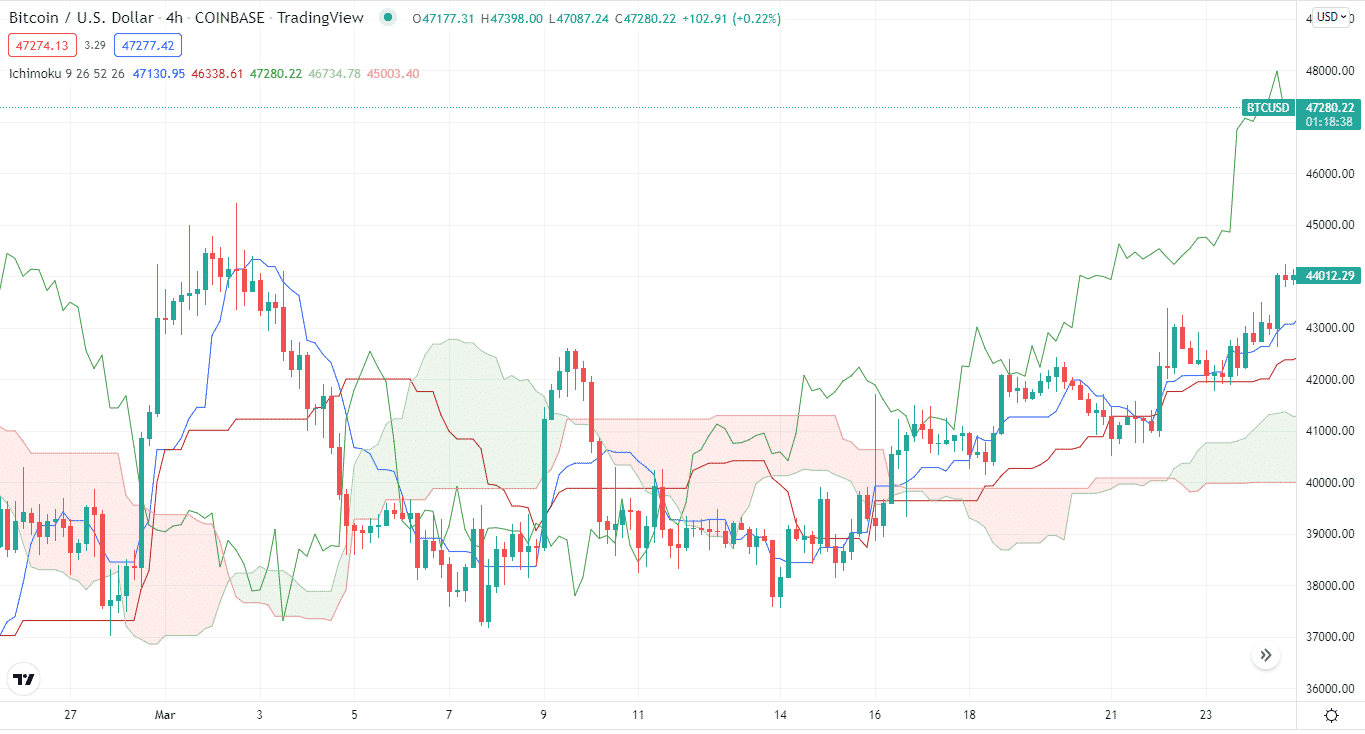
The cloud is the area that signifies either support or resistance. You trade by first identifying the Leading Span A-line and then the Leading Span B line.
If the Leading Span A line is below the Leading Span B line, we can conclude that the crypto is moving in a negative direction. Conversely, the converse means that the crypto is gaining momentum.
Top tips for trading with Ichimoku Cloud
We will now move on to tips and tricks that will surely help any crypto trader become a professional.
Tip 1. Momentum signals
Momentum trading is the simplest Ichimoku Cloud strategy.
Why does it happen?
Momentum signals are determined based on the relationship between three components, namely, baseline, market price, and conversion line.
Bearish momentum signals happen when the market line moves below the baseline. This can also occur if the short MA line (or both), indicated by blue, moves below the baseline.
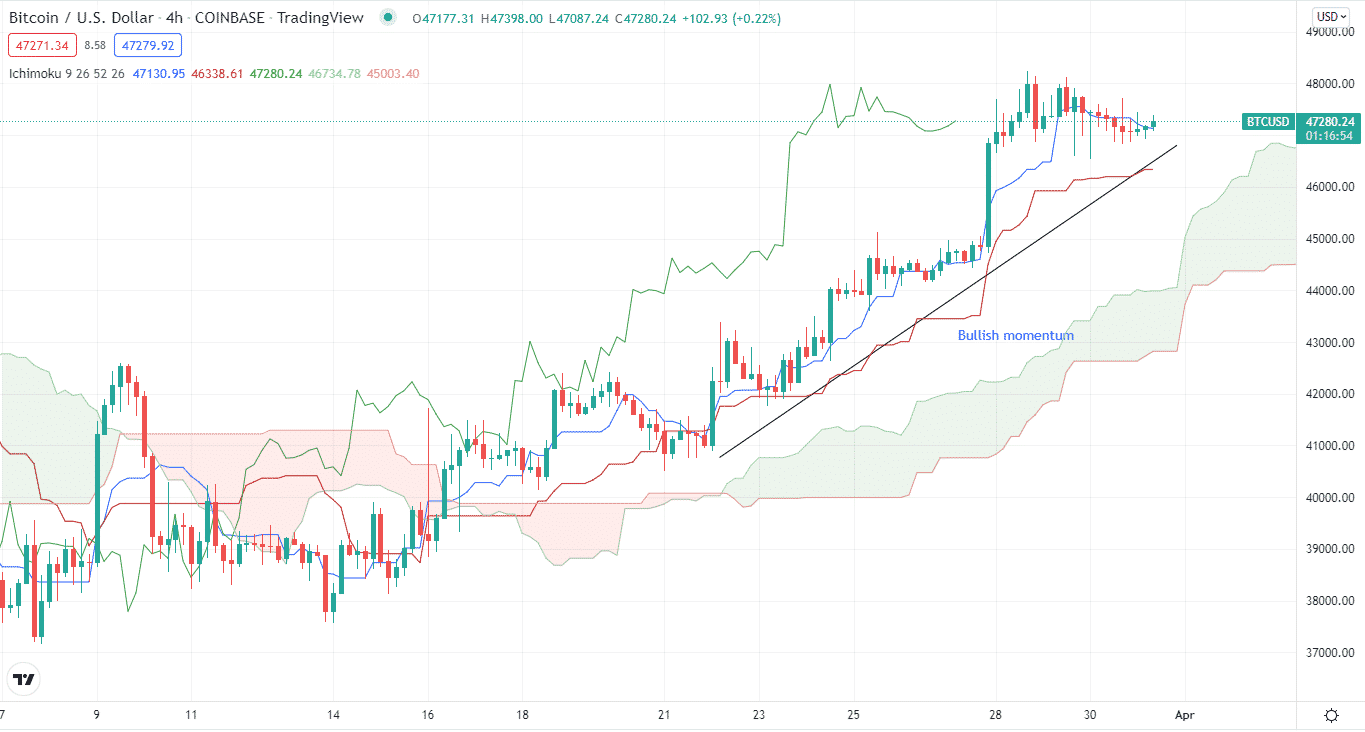
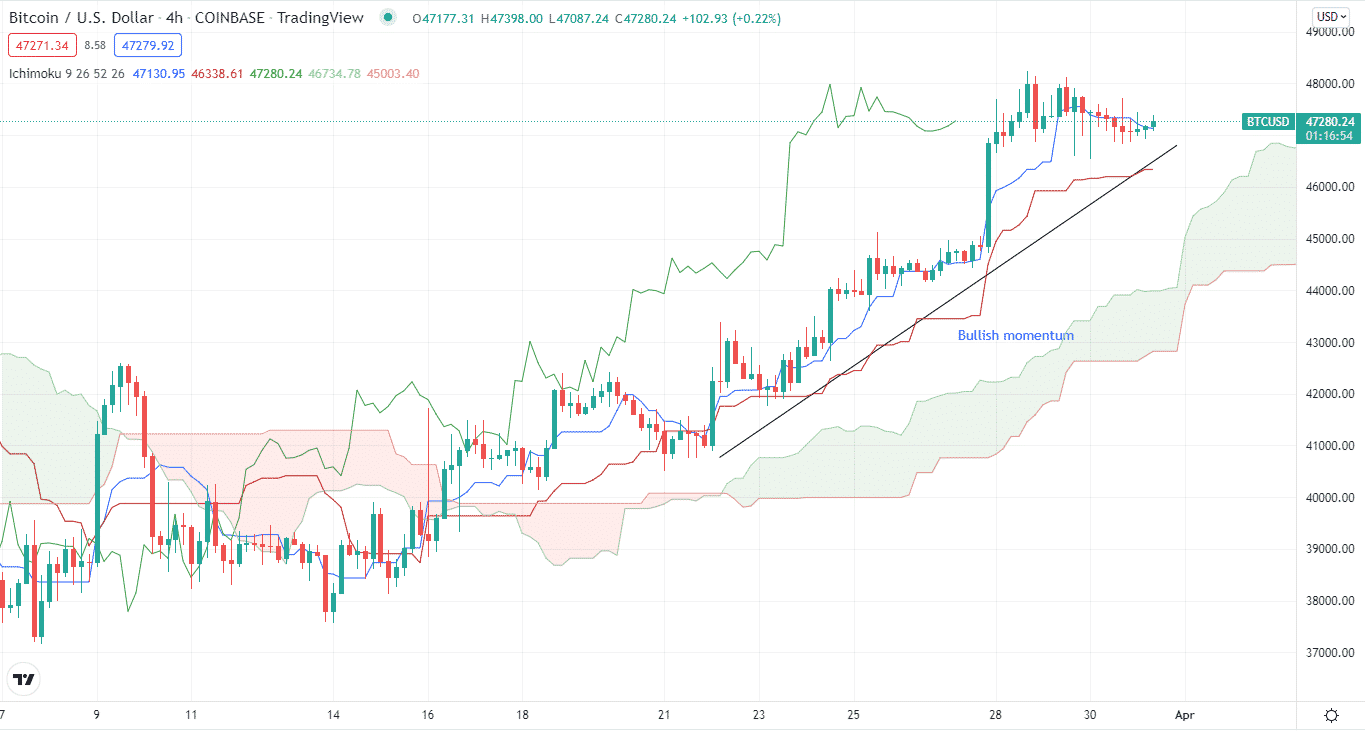
Similarly, a bullish momentum signal is created when the market price or the conversion line (or both) move above the baseline.
How to avoid the mistake?
Learn the bullish or bearish signals corresponding to the indicator lines. The different colors usually enable traders to memorize the cause and effects.
Read the momentum signals with diligence, as the lines can be difficult to interpret if they are all crossing one another.
Tip 2. Watch out for crosses on the Ichimoku cloud
Crosses are an important part of Ichimoku Cloud. Like the traditional MAs, the bullish and the bearish crosses tell us about the current state of the trend.
Why does it happen?
As the indicator combines many indicators, several lines can cross each other. The interaction of these lines and their positioning matter a lot more than one would think. For this reason, spend extra time figuring out what the different crosses mean.
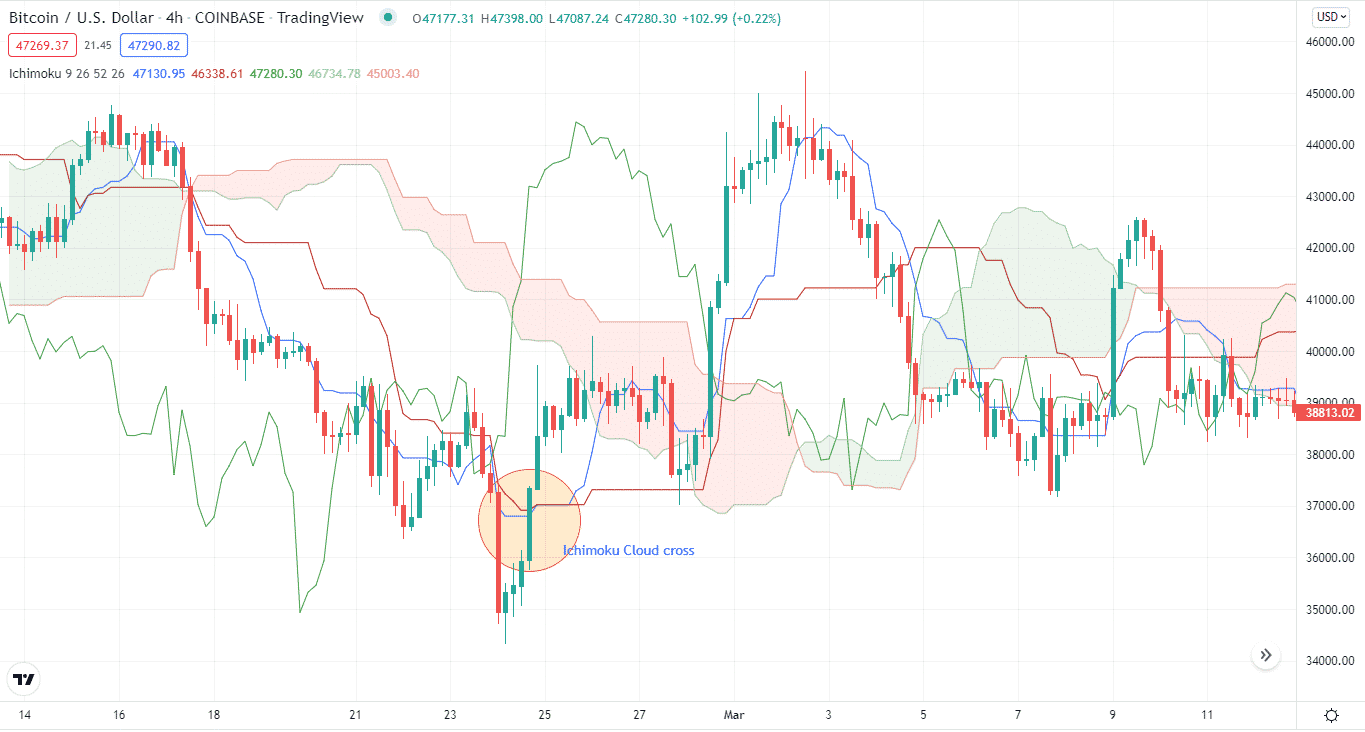
Crosses of the cloud matter just as much as that individual lines. We touched upon the relevant details in the previous point, but as a general tip, remember that a cross of the cloud means a change in the trend.
How to avoid the mistake?
As mentioned earlier, when the crypto market moves upwards, it signifies an uptrend. Here, the lines should be ordered from highest to lowest, creating a Lagging Span.
When the market moves in a downtrend, the lines are ordered from lowest to highest. This creates a Leading Span.
Tip 3. Look out for Moving Averages
MAs are an important component of Ichimoku Cloud. Looking out for the signals produced by the indicator’s MAs help us determine the direction of the trend.
Why does it happen?
A fast-moving average, or MA, above a long MA signals a strong uptrend. This means it is a bullish signal. But, of course, the opposite is also true, signaling a bearish trend.
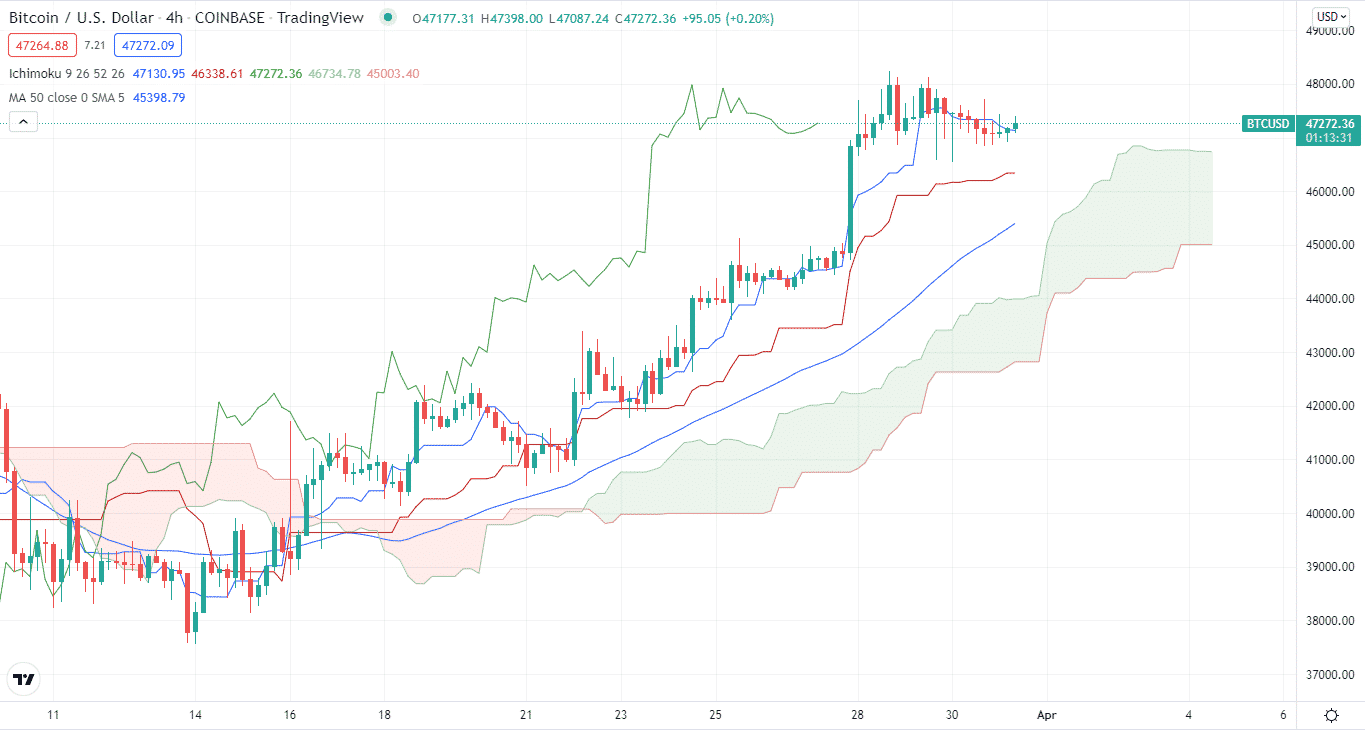
Crypto traders use such logic, in combination with price and cloud, to determine their move.
How to avoid the mistake?
Think of combing the MA signals.
When the price is above the cloud, and the fast MA crosses the long MA, this forms two bullish trends. At this point, long position openings are suitable.
The same criteria as cloud apply to MAs. The crypto asset price above the cloud calls for the market to be bullish. Similarly, the long MA moving above the cloud is a bullish signal.
Tip 4. Know about the lagging spans and their locations
A lagging Span can also help us identify what the cloud is indicating, specifically about the strength of the price action.
Why does it happen?
A lagging Span shows a general trend. A lagging span crossing above the fast MA will depict a strong bullish signal.
Similarly, a lagging span crossing below the fast MA means a bearish trend occurs.
How to avoid the mistake?
A lagging Span shows a successful occurrence of a bullish signal as it crosses over a fast-moving average. Remember to know that there is a trend consolidation or transition if Span A is the highest or the lowest line. Span B being the highest or lowest signals a strong downtrend or strong uptrend, respectively.
Final thoughts
So many indicators make up the Ichimoku cloud, requiring extensive understanding and consequent interpretations. It can be slightly chaotic to look at or understand, but you will surely reap the benefits once you get it.
A crypto trader should know about all of the numerous lines of an Ichimoku cloud indicator and what kind of trend each of their movement’s signals is. In this way, the Ichimoku cloud indicator can be significantly valuable in the crypto market.
